Re-entry Long idea on ETHUSDBased on :
-quantitative analysis
-Volume analysis
-Option flow analysis
Ethlong

ETHUSD: Outlook for the Upcoming DaysMonthly View:
The monthly timeframe remains bullish overall, but ETH has pulled back to gather strength. This kind of move is typical when the market is gearing up to break a higher high. The broader structure hasn’t shifted—this is simply a deeper retracement inside a bullish narrative.
Weekly View:
The weekly chart is showing a similar story. Price has been dropping consistently without giving even a single proper reversal. If ETH truly wanted to fall aggressively, it would normally make a move up first, trigger traders’ stop-losses near previous highs, and then dump. But this time, it didn’t do that.
This unusual behavior hints that the market may be preparing something different from what most traders expect.
Daily View:
The daily timeframe is where things get really interesting. ETH spent more than half the recent sessions moving sideways, collecting liquidity on both sides. After that, it dipped and formed a lower high—but that lower high hasn’t been broken yet.
According to my analysis, ETH is currently sitting in the Discount Zone, an area where buyers often start becoming active.
4-Hour View:
On the 4H chart, I already had a clean short setup earlier, but now I’m watching for signs of a potential reversal. That reversal idea is not guaranteed, though—it becomes invalid if ETH fails to break the series of lower highs.
There’s also another scenario: ETH might refuse to break the lower highs and begin forming higher lows at the same time. If that happens, we’ll see a period of sideways consolidation. When the breakout finally comes—whichever direction it chooses—the move is likely to be powerful.
Final Thoughts:
Based on my analysis, ETH is showing mixed but promising signals across the higher and lower timeframes. The monthly structure is still bullish, and this pullback looks more like preparation for a stronger push rather than a trend reversal. Weekly price action hasn’t shown any meaningful bounce yet, which is unusual—and that alone hints that the market might be setting up something unexpected.
On the daily chart, ETH has swept liquidity after moving sideways for quite a while, and now it’s resting in the Discount Zone, where smart money usually becomes active. The 4H timeframe already gave clean short opportunities earlier, but now the market is approaching a point where a reversal could begin—unless lower highs remain untouched.
If ETH starts forming higher lows without breaking lower highs, the market will likely slip into a compression phase. When price finally breaks out of that squeeze, the move—up or down—can be very strong.
Again, this is just my personal viewpoint. Please do your own analysis before investing. Your profits and losses are entirely your responsibility—I’m only sharing what the charts are suggesting to me right now. Stay alert to the reaction levels ahead; that’s where the next major direction will reveal itself.
----------------------------------------------------------------------------------------------
Thanks for checking out this analysis! If you enjoyed it, hit that follow button so you don’t miss future updates. And if this breakdown helped you out, drop a like 👍 and share your thoughts in the comments 💬—I always appreciate the feedback!

ETH Long - Golden Pocket BITSTAMP:ETHUSD is very oversold and showing signs of a short squeeze building on the 4 hour chart. Almost all long liquidity was wiped around 2920 area ($1.3BB on hyper liquid) and there is currently a large cluster of short liquidations around $3120, so it should start to head that direction and cascade up from there until we reach the golden pocket.
There are plenty of macro headwinds, including NASDAQ:NVDA earnings after the bell today that could easily compromise this outlook in the short-term but I believe we will push higher from here. Even if we wick lower in the short-term, I believe that it's close enough to a bottom to enter here with a stop below LOD and some put options to hedge.

Why my ETH Holding has grownIn my last ETH update when the price was at $1700 and it looked as if the world was crashing, I mentioned I thought ETH was going to set a new ATH and so far it did but not at the price area I was expecting. I also did mention that I expected a return to around $3000 which is close to where it currently is.
All that said, I have had more time to look at the ETH chart and I think I may have been less bullish than I should have and as a result I grew my ETH holding since then. A few things I would like to point out.
One of which I mentioned in my last update. Looking at the ETH chart, it looks too similar to the gold chart with the ABC shakeout that gold went into before the massive rally.
Imagine holding GLD from Aug 2023 and selling in Oct 2023 because you could no longer handle the pain at this point below?
Now imagine those that held during this time, the fear and uncertainty they would have gone through. Personally, I think that is what the bookmakers are doing to ETH holders. If you believe the narrative that every asset will be tokenized and it ETH is the most trusted, then it makes sense to shake as many people out as possible before the GLD like rally.
Secondly, (although its a toss up) the action ETH is displaying now is similar to that of 2018 to 2020 and that we are in Sep-Oct of 2020 as you can see from the main chart and below as well.
Finally, the one bearish scenario is that we are doing the gold option but that we fail like this stock (PSNL) once we go and set a new ATM from here.
I had noticed the-same gold pattern and traded it but luckily I sold just before the failed breakout (so far) and you can clearly see the ABC pattern exactly like GLD before the breakout.
This is not a financial advice and I am not asking you to buy ETH. Just my opinion.
Please like, share and leave a comment.

#ETH/USDT : Rebound Setup from ascending channel Support#ETH
The price is moving within an ascending channel on the 1-hour timeframe and is adhering to it well. It is poised to break out strongly and retest the channel.
We have a downtrend line on the RSI indicator that is about to break and retest, which supports the upward move.
There is a key support zone in green at the 2930 price level, representing a strong support point.
We have a trend to stabilize above the 100-period moving average.
Entry price: 3064
First target: 3100
Second target: 3168
Third target: 3260
Don't forget a simple money management rule:
Place your stop-loss order below the green support zone.
Once you reach the first target, save some money and then change your stop-loss order to an entry order.
For any questions, please leave a comment.
Thank you.

$ETH accumulating around $3K?CRYPTOCAP:ETH accumulating around $3K? Spot on it’s coiling at ~$3,100 (up 3.44% short-term, per latest feeds), building steam after the recent dip.
Next resistance retest at $3,400 makes sense: that’s the broken support-turned-resistance from early Nov, aligning with the 50-day MA and Fib 0.5 extension. Break it, and we’re eyeing $3,850–$3,900 by month-end (Fusaka upgrade hype + ETF inflows fueling the push).
Whale zones at $2,800–$2,400? Bullish af—matches on-chain data where big players scooped $1.37B during the $3,331 breakdown (June highs echoed in Nov buys like Tom Lee’s $63.6M stack today).
Wintermute’s loading millions amid the dump, signaling reversal vibes (last time = massive pump). If $2,800 holds (key Fib 0.618 + demand zone), that’s your dip-buy floor before $4K+.
Mildly bullish here (70/30 odds on upside) RSI resetting from oversold, HAR dipping but whales countering retail sells. Load on #SorooshX signals if it tests $2,800.
Your play? 😎
#ETH #Crypto


ETH:USD When bottom?ETH is at a make or break area at the moment. $2870-$2950 is a super major support zone for ETH. If price wants to go down a bit more, then the 0.5 fib level at $2730-$2630 would be another very strong support. The last bit of support would be the golden zone area between $2270 - $2180. Elliott wave perspective, ETH might have come to a spot where no one would complain if it turned around from here. RSI is showing bullish divergence. We can make a case for a full 5 waves for C. If market has other ideas, then this could be a larger wave 3 for a nested 1/2, 1/2. If that is the case, then price might head down to the lower levels mentioned above. But, for now, it does seem like capitulation has taken place, and the sell pressure has peaked. Until price is above at least $4285, it can still be a larger AB with another leg down for C. Ideally, we would want to see another ATH with a complete 5 waves sequence up before we know for sure. My plan is to start nibbling ASAP to add back to my bag with a stop loss. When the sentiment is this bearish, it has always worked out, at least in the short term. If the minor Wave 2 is indeed over, then we should start prepping for massive fireworks. On macro cycle minor wave 3s are the strongest. We'll see how things go, but I am hopeful; until market decides to throw dirt in my eyes!

ETHUSDT Weekly Chart – Full AnalysisETH is moving inside a long-term descending wedge/channel pattern, with the upper boundary acting as resistance and the lower as support.
Major Levels: Key horizontal levels include $2,502 (support) and $4,830 (major resistance). The wedge confines most price action since mid-2022.
Recent Action: ETH surged toward the wedge top near $4,830 but faced rejection, leading to the current pullback toward the wedge mid-zone and support. This retracement remains above trendline support and above the last key breakout region.
Bullish Path: If ETH rebounds from the wedge and horizontal support, a breakout above $3,600–$3,800 could re-test $4,830. On a breakout, long-term targets are $6,000+ based on the wedge height and prior cycle moves.
Bearish Risk: If the wedge support fails and ETH loses $2,500, further downside could be seen toward the $1,420–$1,030 area.
Cup & Handle/Accumulation: Multiple rounded bottoms and retests reflect long accumulation phases. A successful move above the wedge would complete this structure and suggest major upside.
ETH is consolidating within a large wedge structure, at support after a strong run and rejection near $4,830. Holding the $2,500–$2,800 zone is key for bullish continuation. A confirmed breakout can trigger a fresh multi-month rally, while a breakdown signals deeper retracement.
DYOR | NFA

ETHUSDT: Rebound Setup from Broadening Wedge SupportETH is currently respecting the lower boundary of a broadening wedge pattern, a structure known for sharp reversals once price taps the support zone. The latest reaction shows buyers defending this area, indicating a potential upside move.
Entry: Current support area of the broadening wedge, below $3200
Stop-Loss: $2900
Take-Profit: 10%, 20% , 40%
Cheers
Hexa

ETH — Signs of StrengthEthereum has printed a lower low at point B, but quickly reclaimed the low of A — another sign of strength despite overall market weakness.
From a Wyckoff perspective, the elevated volatility around A may indicate a Selling Climax (SC), where panic selling was actively absorbed. The lower low at B followed by a sharp recovery fits the structure of a Terminal Shakeout, which reduces the floating supply before a potential Mark-Up phase.
Price is currently interacting with the descending R-line. A breakout above this level may signal the start of a bullish impulse.
What I expect next:
— Potential bullish breakout above the R-line
— Formation of a local uptrend within the channel
— Move toward the 3,350–3,450 resistance zone, where the mid-term trendline is located (marked as Target)
— Possible confirmation of a shift toward a more bullish market tone heading into the new week

#ETHUSDT 2025–2028 OutlookFIB/GANN/classic Method Analysis
🔹 Gann Key Timing
According to Gann cycles,
25 November marks the start point of a new bullish attempt for ETH.
The $2,500 level is the critical line
if ETH closes a monthly candle below $2,500, it signals a significant change in the long-term roadmap.
Trend Setup
As long as ETH holds $2,500 and stays above the Blue Trend Line (A),
The bullish roadmap remains valid.
🎯 Roadmap Targets
Breakout Key:
$5,100 → Main breakout confirmation
Target 1:
$5,900 – $6,700 → First bullish leg (until Feb 2026)
Target 2:
$8,200 – $8,900 → Full bullish year if 2026 confirms
Target 3:
$10,150 → Extended top projection (2027–2028)
📌 All levels remain valid as long as ETH holds $2,500 on the monthly close.
💰 Trade Plan
We have active entries: from $3, XXX, with remaining buy levels between $1,500–$1,850–$2,150.
Set up invalidation: Monthly close below $2,500.
Max investment: 15 % of wallet.
Risk-Reward (R: R): ≈ 1: 2 or higher.
Example: If you hold 10 ETH, you risk about $10K vs. the potential upside of $35–70K.
⚖️ Summary
Support to hold: $2,500
Breakout confirmation: $5,100
Main targets: $5,900 → $6,700 → $8,900 → $10,150
Cycle: 2025 → 2028
Exposure: 15 % max
Always trade with a clear plan and controlled risk.
⚓ Renzo Tip
“The chart tells its truth to the patient — not the loudest trader, but the calm observer of time.”
🤲 Prayer
May Allah guide us to trade with clarity, protect our effort from greed and confusion,
and reward our discipline with lasting growth and wisdom.

ETH LONG 🟢 Entry : 3300$ - 3360$
🎯 Targets :
1) 3370$
2) 3450$
3) 3550$
4) 3700$+
🔴 Stop : Blw 3180$

Ethereum Eyes $5K on Rate Cuts Hopes & U.S. Shutdown ResolutionEthereum (ETH/USD) continues to show resilience as macroeconomic conditions begin to favor risk assets. With the U.S. Federal Reserve expected to cut interest rates by 25–50 basis points in December, investors are gradually rotating back into crypto, anticipating improved liquidity and higher capital inflows. Lower interest rates typically weaken the dollar and boost speculative assets like ETH and BTC, making this a potential catalyst for Ethereum’s next bullish leg.
Additionally, progress toward resolving the U.S. government shutdown, which has lingered for weeks, is helping stabilize investor sentiment. Once uncertainty around fiscal operations fades, institutional activity is expected to pick up across both traditional and digital markets — further supporting Ethereum’s recovery momentum.
On-chain fundamentals remain strong. Ethereum’s staking deposits continue to rise, now exceeding 33 million ETH locked in validator contracts. This sustained demand reduces circulating supply and underpins long-term price stability. Meanwhile, the Ethereum network maintains its dominance in decentralized finance (DeFi), non-fungible tokens (NFTs), and Layer-2 scaling activity, positioning it as the backbone of Web3 infrastructure even amid increasing competition.
Technically, ETH/USD has bounced from the $3,200 support zone, aligning with a long-term ascending trendline. The chart shows potential for a sustained push toward the $4,150 resistance before retesting and targeting the $5,000 high. A clear daily close above this level would confirm a continuation of the larger bullish structure and could open the door to new all-time highs in 2026 if macro tailwinds persist.
Overall, Ethereum’s fundamentals and technicals are converging at a favorable point, and with rate cuts on the horizon and fiscal fears fading, ETH may be preparing for a powerful rally into Q1 2026.
Can Ethereum Holders Help Price Break Its Month-Long Downtrend?Ethereum’s price stands at $3,604 at the time of writing, hovering just below the critical $3,607 resistance mark. The altcoin king has been struggling against its descending trendline for over a month, making this level a key breakout point.
If Ethereum can flip $3,607 into support, the next target would be $3,802, followed by a potential move toward $3,950. Sustained support from LTHs and rising sentiment could fuel this upward trajectory, allowing ETH to escape its bearish grip.
However, if investors begin taking profits, Ethereum could slip below the $3,489 support level. A further decline toward $3,287 would invalidate the bullish thesis. This would signaling renewed selling pressure and extending the ongoing downtrend.

BMNR BIG BULL RUN PROBABILITY SOON!!!🚨 BMNR HIGH PROBABILITY BUY SETUP 🚨
* Here We Can See Clearly The Next Potential Moves For BMNR Coming Hours/Days.
* Keep Your Eyes Close On Your Trading Positions.
* Happy PIP Hunting Traders.
FXKILLA.

#ETH/USDT Update. Important level to break!CRYPTOCAP:ETH needs to break above the 200 EMA, a key psychological level, to confirm continuation of the uptrend. Other altcoins are likely to follow if that happens.
Keep a close eye on this level; it could set the tone for the market.
Stay tuned for more charts.
ETH Daily: Tracking S&D Reaction and the Deeper QML SetupHi!
Price is currently pulling back toward a key Supply & Demand zone, where a short-term bullish reaction is still possible. This level acted as resistance previously and now lines up as a logical retest area after the recent drop.
However, the broader structure suggests that even if we do see a bounce here, it may only form a temporary correction before the price reaches deeper liquidity. The QML zone below remains the major point of interest.
A sweep into that QML area would fill remaining inefficiencies and tap into the stronger demand needed for a more convincing reversal. From there, the chart opens the possibility for a larger bullish leg heading into 2026.
In short:
Watching for a short-term reaction at S&D
Still expecting a deeper move into QML
That zone holds the higher-probability long setup
This scenario remains valid as long as the structure continues to unwind toward the lower liquidity pool.

#ETH/USDT Ethereum analysis#ETH
The price is moving within an ascending channel on the 1-hour timeframe and is adhering to it well. It is poised to break out strongly and retest the channel.
We have a downtrend line on the RSI indicator that is about to break and retest, which supports the upward move.
There is a key support zone in green at the 3350 price level, representing a strong support point.
We have a trend of consolidation above the 100-period moving average.
Entry price: 3397
First target: 3445
Second target: 3502
Third target: 3570
Don't forget a simple money management rule:
Place your stop-loss order below the green support zone.
Once the first target is reached, save some money and then change your stop-loss order to an entry order.
For any questions, please leave a comment.
Thank you.

ETH/USDT — Golden Zone: Major Reversal or Deeper Correction!The 1W chart of Ethereum (ETH/USDT) displays a clear Elliott Wave impulsive structure, with the price currently moving within Wave (4) — a corrective phase that often determines whether the main trend will continue or reverse.
The 3,630–3,200 USDT yellow zone acts as a critical battleground where long-term buyers and short-term sellers collide. This zone will define whether Ethereum is preparing for its next major rally or entering a prolonged correction.
---
Structure and Key Pattern
Elliott Wave Count: Waves (1), (2), and (3) are complete; price is now in Wave (4), which typically precedes the final impulsive move (5) if the structure remains valid.
Golden Pocket Zone (0.5–0.618 Fib): The range between 3,630–3,200 is the golden retracement zone — a region where high-probability reversals often form.
Historical Flip Zone: This same area served as a major resistance during 2021–2022 and now acts as structural support, making it an extremely important pivot level.
Volume Profile: Historically, this zone attracts accumulation before a large breakout, indicating potential institutional interest.
---
Bullish Scenario — The Start of Wave (5)
If Ethereum holds above the yellow zone and prints a strong reaction, the structure supports a continuation rally toward new highs as Wave (5) develops.
Bullish Triggers
1. Strong rejection candles (e.g., long lower wick or bullish engulfing) from 3.2–3.6k zone.
2. Confirmation occurs once price reclaims 4.1k and breaks above 4.7k with weekly close.
3. First target: 4.95k (previous ATH resistance).
4. Extended targets: If momentum is strong, Fibonacci extensions point toward 6k–9k zones — marking the full completion of Wave (5).
5. Increasing weekly volume during breakout strengthens the bullish continuation signal.
> Bullish Summary:
As long as price stays above 3,200, the impulsive Elliott structure remains intact — making this zone a potential launchpad for the next major Ethereum rally.
---
Bearish Scenario — Breakdown and Deeper Correction
If price fails to hold the 3,200 support and breaks below, the impulsive structure will be invalidated, signaling a possible larger corrective phase (A–B–C).
Bearish Triggers
1. Weekly close below 3,200 confirms support breakdown.
2. Next target would be ~2,700 USDT — the next key support zone.
3. If bearish momentum continues, the price could extend lower toward 1,700–900 USDT (0.786–0.886 retracement).
4. The structure then transitions from an impulsive rally into a corrective macro phase, indicating that the larger bullish wave is temporarily over.
> Bearish Summary:
A weekly close below 3,200 signals structural failure and the start of a long-term distribution or deeper correction phase before forming a new accumulation base below 3k.
---
Visual Interpretation
5-Wave Impulsive Pattern: Indicates that the macro trend remains bullish until 3,200 breaks.
Yellow Zone = Decision Point: This “golden battlefield” determines whether Ethereum resumes its major uptrend or shifts into correction.
If strong bounce occurs, a parabolic Wave (5) could unfold — usually accompanied by extreme optimism and renewed market euphoria.
---
Trading Strategy & Risk Management
Use weekly timeframe for structural confirmation; use daily for precise entries.
Scaling strategy: Gradually build positions within 3.63–3.2k zone; add more upon bullish weekly close.
Stop-loss: Below 3.1k to protect structure integrity.
Conservative approach: Wait for breakout above 4.7k before confirming trend continuation.
Keep an eye on macro news and Ethereum ecosystem updates, which could add volatility beyond technical patterns.
---
Final Takeaway
> Ethereum stands at its Golden Crossroads — between renewal and decline.
If the 3.630–3.200 zone holds, ETH could ignite Wave (5) and push toward new all-time highs (6k–9k).
But if it breaks, the market might enter a deep corrective phase lasting months.
This zone will likely decide Ethereum’s direction for the next 6–12 months.
#Ethereum #ETHUSDT #CryptoTA #ElliottWave #CryptoAnalysis #TechnicalAnalysis #ETHPrice #Fibonacci #CryptoTrading #BullishScenario #BearishScenario #CryptoInvesting

#ETH/USDT Does this scenario cross your mind? What if…#ETH
The price is moving in a descending channel on the 1-hour timeframe and is expected to break out and continue upwards.
We have a trend to stabilize above the 100-period moving average again.
We have a downtrend on the RSI indicator, which supports an upward move if it breaks above it.
We have a key support zone in green that pushed the price higher at 3186.
Entry price: 3230
First target: 3286
Second target: 3350
Third target: 3421
For risk management, don't forget your stop-loss and money management.
The stop-loss should be below the green support zone.
Upon reaching the first target, take some profits and then change your stop-loss order to an entry order.
For any questions, please comment.
Thank you.

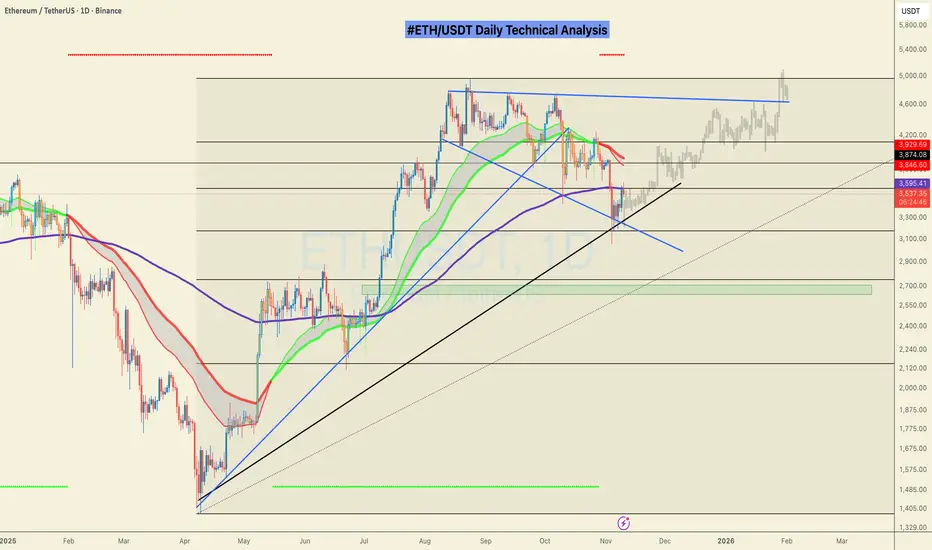
ETH/USDT chart analiysis !!ETHUSDT Daily Chart.
Downtrend Channel and Key Breakout
ETH traded lower in a descending channel for several months between January and April, marked by parallel lines.
A breakout above this channel in late April signaled a trend reversal, leading to a sharp uptrend.
Following the breakout, ETH reached the gray supply/resistance zone ($3,800–$3,900), which has been acting as a support and pivot area ever since.
When the price recently fell below this zone, it immediately found buyers and is attempting to reclaim it.
ETH is now forming a small descending channel from its highs, with the price at support.
The chart projection indicates a bullish reversal as long as ETH remains above gray support and breaks above the channel resistance. If this reversal mirrors previous moves, the next major upside target is $4,830.
Following the previous breakout and trend reversal, ETH is consolidating near key support. Confirmation above resistance could trigger another strong rally, so keep an eye on key areas for signals.
DYOR | NFA

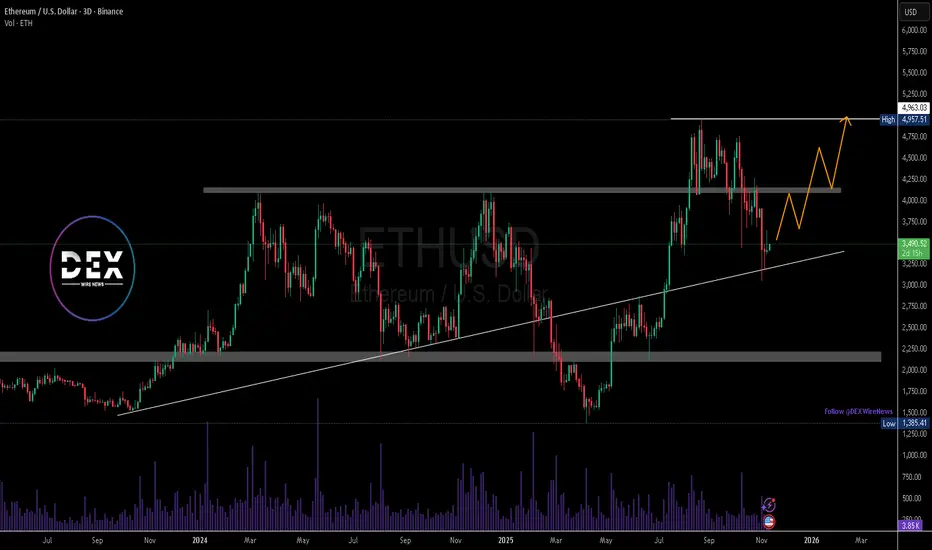
Ethereum: The Jewel of the Money-Printing EraEthereum has once again proven its resilience. After tagging new all-time highs near the $5,000 zone — right in line with prior expectations — the recent ABC corrective move down to the $3,000 region appears to be nothing more than a healthy reset within a much larger bullish cycle.
This correction has shaken out the weak hands while smart money quietly accumulates. On-chain data continues to show strong holding behavior among long-term wallets, with staking and Layer 2 growth tightening supply at a time when global liquidity is expanding again.
Let’s face it — we live in the money-printing era. Central banks can’t stop expanding balance sheets. Debt keeps climbing, interest payments grow unsustainable, and the only escape valve left is higher asset prices. In such an environment, scarce digital assets like Ethereum are not just speculative plays — they’re refuges from fiat decay.
Ethereum isn’t just a coin; it’s the backbone of decentralized finance, NFTs, and Web3. Every new wave of innovation still finds its way back to the ETH network, reinforcing its role as the digital oil of the new economy.
Technically, as long as the $3,000-$2,500 correction base holds, the next impulse wave could target $6,000 and beyond.
In a world drowning in printed money and endless debt, Ethereum remains the shining jewel — a true asset of the new financial order.
