$Q / USDT — Long SetupAfter a healthy pullback, $Q is showing a fresh bullish structure on the LTF. If it holds above support, a strong upside move is likely ahead.
🟢 Entry: 0.0181$ & 0.01770$
🎯 Targets:
T1 — 0.0188$
T2 — 0.0194$
T3 — 0.0215$
T4 — 0.0230$
🛑 SL: 0.01625$
🔥 Momentum building — A breakout above short-term resistance could trigger a sharp bullish move — stay ready, because #Q might surprise with a strong surge soon!
Ethlong

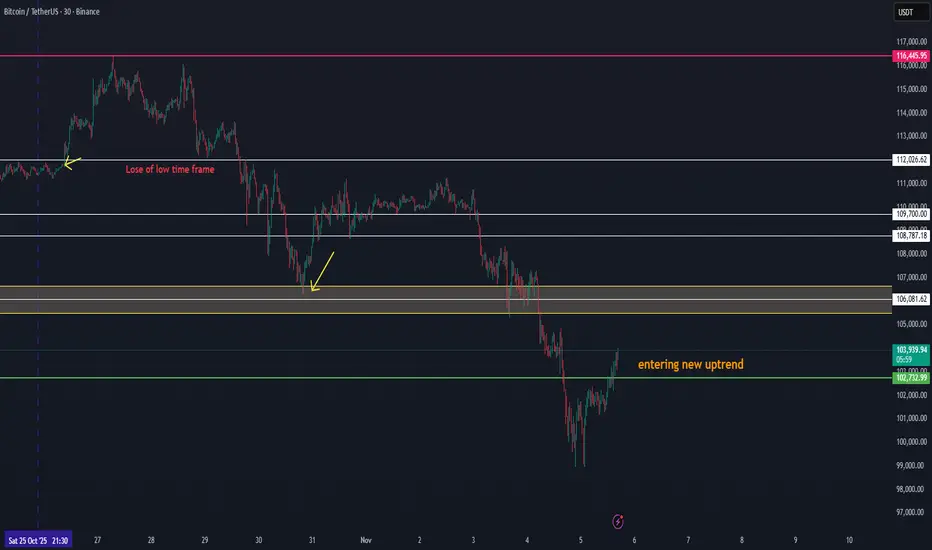
BTC Showing Early Signs of a New Uptrend Volume FormationBTC Showing Early Signs of a New Uptrend Volume Formation
Bitcoin is beginning to show new uptrend volume structure after a long corrective phase. This current movement around the 103K zone could be the first confirmation of renewed bullish momentum forming after the 110K area breakdown.
Here’s the technical context:
🔹 Structure: BTC has established a short-term higher low and is now attempting to build a new rising channel.
🔹 Volume Confirmation: The growing buy volume around 103K suggests early accumulation — this could mark the start of a new volume phase.
🔹 Targets: A sustained move above 103.8K–104.2K may confirm continuation toward 105K+, which would act as the first key resistance and validation of renewed market strength.
💡 Outlook:
If BTC maintains its current momentum and volume continues to rise, this could be the first stage of a new uptrend, with 105K+ as the initial upside target and potential re-entry toward the broader 110K recovery structure later.
ETH - LETS GOOOO BEARISH ..;;;... CRYPTOCAP:ETH - No Nudes, But This Chart’s Got Me Looking Twice 🍑
This is why you voted for me – now a winner of the #Binance #TheBlockchain100 event. 🔥
See you in Dubai this December! ✈️

ETHUSDT 4-Hour Chart Analysis. ETHUSDT 4-Hour Chart Analysis.
ETH is forming a falling wedge, a typically bullish reversal pattern, with price just above strong support ($3,389, orange line).
RSI: The indicator is showing bullish divergence—price is making lower lows, but RSI lows are rising, hinting at possible reversal.
Expect further consolidation or small dips toward wedge support, followed by a breakout attempt.
On breakout, resistance is at $3,900–$4,100, then $4,830 as the next major target.
ETH is holding above support and showing bullish RSI divergence. Watch closely for wedge breakout—this could trigger a strong rally if confirmed.
DYOR | NFA

#ETH/USDT Ethereum at a Crossroads: Accumulation vs. Profit-Tak#ETH
The price is moving within an ascending channel on the 1-hour timeframe and is adhering to it well. It is poised to break out strongly and retest the channel.
We have a downtrend line on the RSI indicator that is about to break and retest, which supports the upward move.
There is a key support zone in green at the 3663 price, representing a strong support point.
We have a trend of consolidation above the 100-period moving average.
Entry price: 3720
First target: 3750.45
Second target: 3815.15
Third target: 3885.60
Don't forget a simple money management rule:
Place your stop-loss order below the green support zone.
Once the first target is reached, save some money and then change your stop-loss order to an entry order.
For any questions, please leave a comment.
Thank you.

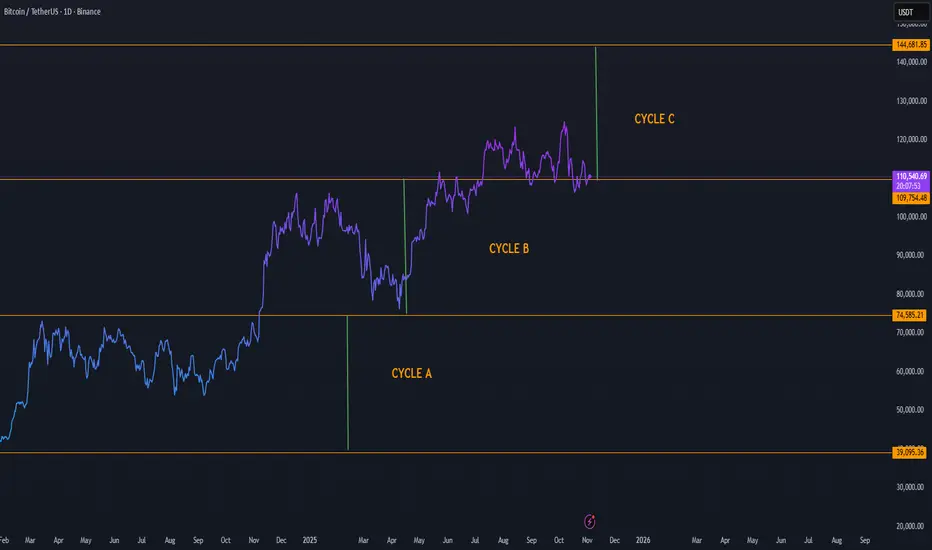
Bitcoin Cycle Analysis Entering Cycle C with Target Toward $144KBitcoin’s long-term market structure continues to evolve in well-defined phases, as visible through Cycle A, Cycle B, and the current Cycle C formation. Each previous cycle has followed a similar pattern: accumulation, expansion, correction, and new leg upward — and Cycle C appears to be following this same rhythm.
Here’s what the structure shows:
Cycle A: Represented the deep accumulation zone and base formation, bottoming near $39K–$75K.
Cycle B: Brought a strong recovery and expansion phase, establishing a stable mid-level support around $110K.
Cycle C (Current): Price is consolidating around the $110K area, likely preparing for the next expansion wave.
If Bitcoin maintains this cyclical rhythm, the next major target lies near $144K, aligning with the top boundary of Cycle C. This zone represents the next major resistance level and potential completion point of the current macro cycle.
Key observations:
Holding above $109K keeps Cycle C active and healthy.
Increasing volume during the next upward move could confirm a breakout continuation.
A successful push beyond $120K would strengthen momentum toward the $144K region.
$ETH UPDATE Nothing has changed for Ethereum price still holdiCRYPTOCAP:ETH UPDATE
Nothing has changed for Ethereum price still holding below the crucial $4K zone. As long as ETH stays under this level, the remaining downside targets are likely to be hit soon. Stay patient the chart is still playing out exactly as expected.

My doodle predictions for EthereumIt's crazy how strong this level is, my idea is we might have to scare some people to drop their ETH buy from them and then long upwards, if it was up to me I would go with scenario D.

ETHUSDT: Short-Term Pullback Toward Trendline Before PotentialHi guys!
On the current 1h chart, Ethereum shows a clear structure of recovery following a liquidity sweep marked as “Hunting happened.” This move indicates that liquidity below the previous lows has already been collected, creating a potential base for a short-term bullish correction.
Price is currently consolidating above a minor support zone (highlighted in pink), showing a possible accumulation phase. The projected path suggests a potential bullish move toward the major supply zone around $4,080–$4,180, which aligns with the descending trendline acting as dynamic resistance.
However, given the overall bearish market structure and the dominance of the descending trendline, the area around $4,100 could serve as a strong reaction zone. A rejection from this level would likely confirm continuation of the broader downtrend, with a possible retracement toward the $3,700–$3,750 area.

Can Short-Term Holders Rescue Ethereum From a Drop to $3,500?At the time of writing, Ethereum is trading at $3,846, holding just above the $3,802 support level. The altcoin king is likely to remain rangebound as market conditions show limited volatility.
Ethereum’s price currently fluctuates between $4,154 and $3,802. This consolidation range could persist in the coming sessions, with ETH possibly retesting resistance if short-term momentum returns.
However, if bearish conditions intensify and Ethereum loses the $3,802 support, a further drop could follow. A breakdown below this level may send the price under $3,742 and toward $3,500, invalidating the bullish thesis and signaling deeper market weakness ahead.

Ethereum is deciding where it wants to live.This is not a trade idea, this is a long term concept, most of my portfolio is swing when bull market comes (monthly/yearly) not trade (daily/weekly).
This is a solid question that will have to be played out in the upcoming years, Ethereum keeps changing its monetary policy and right now has less supply increase than BTC (due to burning mechanisms), will that stay forever? What will happen in the future to the policy? What it will mean for price?
Right now we can clearly see this is a bull case for future months.

Ethereum $ETH still has weekly demand in control. Will it rally?Ethereum CRYPTOCAP:ETH still has weekly demand in control. Will it rally higher? Waiting for some more bullish price action or a pullback to the weekly demand lower at $2,600.

#ETH/USDT Buy Opportunity#ETH
The price is moving within an ascending channel on the 1-hour timeframe and is adhering to it well. It is poised to break out strongly and retest the channel.
We have a downtrend line on the RSI indicator that is about to break and retest, which supports the upward move.
There is a key support zone in green at the 3900 price level, representing a strong support point.
We have a trend to stabilize above the 100-period moving average.
Entry price: 4020
First target: 4050
Second target: 4100
Third target: 4179
Don't forget a simple point: capital management.
Upon reaching the first target, save some money and then change your stop-loss order to an entry order.
For any questions, please leave a comment.
Thank you.

ETHUSDT Long Setup - Smart Money Concept Analysis & Risk Managem💰 Symbol: ETHUSDT.P (Binance)
⏰ Timeframe: 1H
📊 Current Price: $4,124.58
📈 Technical Analysis:
Current market structure shows bullish momentum, supported by institutional buying at these levels. The main indicators in play are BigBeluga Smart Money Concepts and VPFR Support/Resistance, confirming volume areas and clear entry/exit zones.
🔍 Setup Details:
- Entry (Buy): Around $4,124–$4,125
- **TP (Take Profit):** $4,216.64 (Target zone, +4%)
- **SL (Stop Loss):** $3,972.13 (Safe support/volume cutoff)
- **Risk/Reward Ratio:** 1.97 (Targeting almost 2x reward vs. risk, statistically optimal)
🔎 VPFR/POC Levels:
- Upper POC: $4,159.35 → major upper volume node, significant resistance to watch
- Lower POC: $4,110.21 → supports accumulation thesis
📝 Chart Notes:
- Target: 162.07 (4%) | Amount: 1491.48 | Red resistance/volume zone noted as primary TP.
- Stop: 82.44 (2.03%) | Amount: 750 | Purple support considered as SL.
- Open P&L: 70.01 | QTY: 3.03
🎯 Trade Plan:
- Entry: Buy when price sustains above $4,110 with bullish confirmation.
- SL below major volume support, TP at upper resistance or breakout target.
⚠️ Risk Disclaimer:
This is not financial advice. Always do your own due diligence and adjust your sizing according to your personal risk profile.

ETH Daily Technical Overview — Cycle & Box AnalysisCycle Structure:
HWC (Higher Wave Cycle – Long-Term): Bullish 🔼
MWC (Middle Wave Cycle – Mid-Term): Range 🔁
LWC (Lower Wave Cycle – Short-Term): Bearish 🔽
Market Context:
The first step is to assess the market from a cycle and wave perspective 🧐. Recent sharp down moves are ignored as they are emotional reactions.
The current support is a box 📦 that has been tested for around 35 days with four significant touches. My bias is long here 🚀.
Long Setup:
Weakness in the short-term MWC 🔁 could trigger a bullish move if 4232 resistance is broken and confirmed ✅.
The next resistance at 4757 🚧 could turn all cycles bullish 🔼🔼🔼 if broken, offering strong upside potential 📈.
Short Consideration:
The market is unpredictable ⚠️, so short scenarios should be considered too.
Until price reaches 3708 ⬇️, I won’t consider shorts ❌.
Shorts require more structure and confirmation.
Remember, downside moves are still possible ⚡, so risk management is key 🛡️.
📌 Signature:
If you want a specific coin analyzed, drop a comment 💬👇 and I’ll cover it.
⚠️ Without proper risk management, you're just a ticking time bomb 💣

Ethereum Buying opportunity Previous week Ethereum closed above weekly resistance level $4093. Currently trading within a top range. ETH has decisively broken above the prior week's High, signalling continued bullish momentum. The probability of ETH retesting its previous all-time high of $4,951 in the near future is very high.

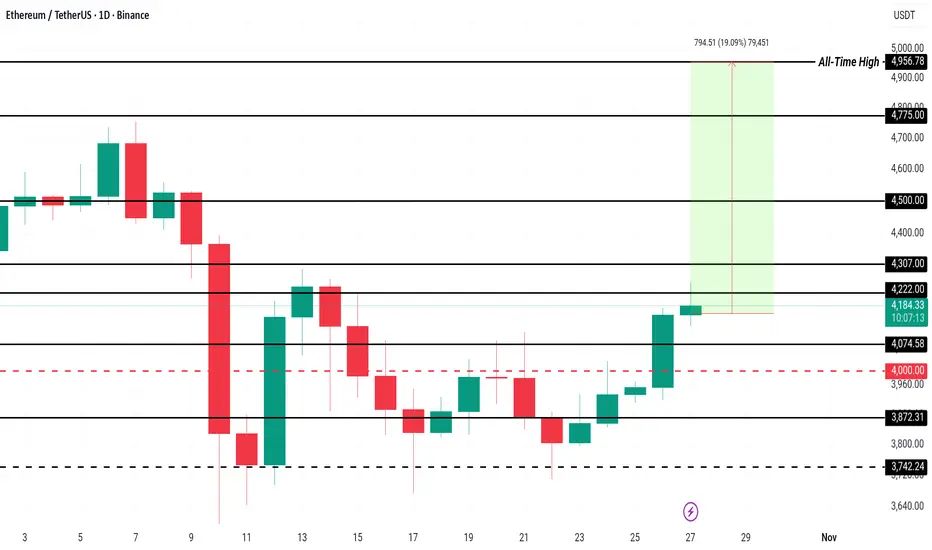
3 Altcoins That Could Hit All-Time Highs In November 2025Ethereum is trading at $4,156, holding firmly above the $4,000 support while facing resistance at $4,221. The altcoin king's recent consolidation reflects cautious optimism among traders.
To reach its all-time high of $4,956, Ethereum needs a 19% price increase. This requires breaking through resistances at $4,221 and $4,500. The Relative Strength Index (RSI) indicates strengthening bullish momentum, suggesting buyers are regaining control and could drive ETH higher.
However, if selling pressure intensifies, Ethereum could fall below $4,000 and target $3,872 or even $3,742. Such a decline would signal weakening demand and invalidate the bullish outlook.
#ETH/USDT : Another Attempt To Resume Upward Movement
#ETH
The price is moving within a descending channel on the 1-hour frame, adhering well to it, and is heading for a strong breakout and retest.
We have a bearish trend on the RSI indicator that is about to be broken and retested, which supports the upward breakout.
There is a major support area in green at 3826, which represents a strong support point.
We are heading for consolidation above the 100 moving average.
Entry price: 3831.
First target: 3920.
Second target: 3969.
Third target: 4200.
Don't forget a simple matter: capital management.
When you reach the first target, save some money and then change your stop-loss order to an entry order.
For inquiries, please leave a comment.
Thank you.

Long on EthereumWe are currently above the 50 EMA and 200 EMA.
Breaking out of the giant ascending triangle with a retest.
This could be a 4/5x from here with a top target of approximately $20,000 per ETH.
I’ll be long Ethereum until we hit or get close to the price action trendline.

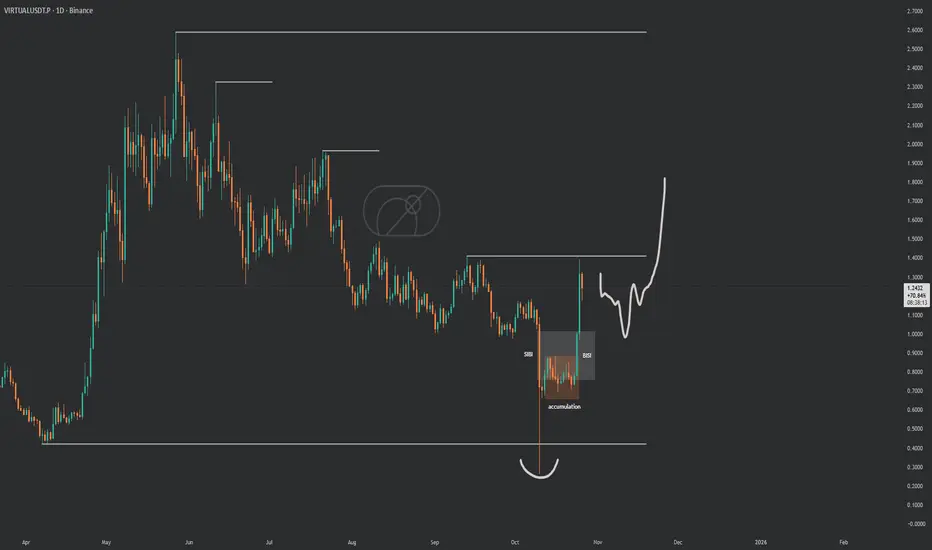
$VIRTUAL got that clean range clean price actionSPARKS:VIRTUAL got that clean range clean price action straight textbook accumulation. Lot of coins looking just like this, coiling up for the first real upside blast !If it dips to hand us $1, that's the golden entry.
new month watch list : SEED_WANDERIN_JIMZIP900:ASTER AMEX:XPL SPARKS:VIRTUAL
technical analysis for your ETH/USD chart:Pair: Ethereum / U.S. Dollar (ETH/USD)
Current Price: around $3,931
Structure: Rising channel pattern
Key Zones:
Support Level: $3,850 – $3,880
Target Level: $4,120.70
📊 Technical Analysis
Trend Structure:
ETH/USD is currently trading within an ascending channel, reflecting a short-term bullish structure.
Price is consolidating just above the midline of the channel, suggesting a potential retracement before the next bullish leg.
Support Area Reaction:
The support level near $3,850 – $3,880 aligns with the lower channel boundary.
A possible pullback into this zone could act as a liquidity grab before a bullish continuation.
Bullish Scenario (Primary Expectation):
If price retests and holds above the support level, expect a rebound toward $4,120.
Confirmation: Bullish candlestick pattern or breakout above the local resistance around $3,970.
Bearish Scenario (Alternative):
A confirmed break below $3,850 could invalidate the bullish setup.
In that case, ETH could extend lower toward $3,780 – $3,750 support area.
⚙️ Trading Plan (Summary)
Direction Entry Zone Stop-Loss Target
🔺 Long (Buy) 3,850 – 3,880 Below 3,820 4,120
🔻 Short (Sell – only if breakdown) Below 3,850 Above 3,900 3,750
🧩 Technical Indicators (Implied)
Trend: Bullish structure intact within ascending channel.
Momentum: Neutral–bullish (possible short-term retracement).
Market Sentiment: Buyers maintaining control unless $3,850 breaks. NASDAQ:TSLA NASDAQ:NVDA NASDAQ:AMD NASDAQ:PLTR NASDAQ:META NASDAQ:MSFT NASDAQ:NFLX NASDAQ:INTC NASDAQ:BYND NASDAQ:MSTR

Etherium to 7500Right now BINANCE:ETHUSDT is just barely holding above 3500 area which is a good sign and showing it's potential to break ATH. But remember 3500 is not that major support, so it may break this support area and look for major support zone which is around 2100-2600 area. That would be a perfect opportunity enter long position on BINANCE:ETHUSDT , or maybe buy on spot. It can also fakeout 3500 area and go up. And also there is a obvious triangle pattern appeared in 1W timeframe which is a very good sign to go up in my opinion. Our first target will be 7500 and then 10k, 12k, 15k. So time will tell.

$EPT/USDT delivered a solid breakout with a massive 72% pump! $EPT/USDT delivered a solid breakout with a massive 72% pump! Both targets hit perfectly as predicted 0.005 and 0.006 levels achieved. Momentum was strong, and the breakout played out beautifully. Now waiting to see if bulls push for the next leg up.
