ETHUSD Potential Long After Liquidity Sweep (1H)ETH swept sell-side liquidity and showed a strong reaction from demand. Price is currently setting up for a potential bullish continuation if structure holds.
🔹 Entry: 2,954.74
🔹 Stop Loss: 2,891.06
🔹 Take Profit: 3,327.00
📊 Risk / Reward: ~1:5.85
📈 Target Move: +12.59%
📌 Confluences:
Sell-side liquidity sweep
Strong displacement from demand
Clear invalidation level
Clean RR profile
⚠️ Setup invalidated if price closes below 2,891.06.
🤡 Disclaimer: Not financial advice. I’m just a random person on the internet drawing colorful boxes on a chart. Trade at your own risk.
Ethlongsetup

ETH | TRADE ANALYSIS📌 Trade Setup:
* Entry Level: 3,071
* Stop Loss: 3,026
* Target: 3,155
ETH is holding above an important intraday support zone, showing signs of renewed buyer interest. Momentum is gradually shifting upward, and if price sustains above the entry zone, a push toward the target area becomes likely. This setup focuses on short-term strength, with clear levels for controlled risk.
Disclaimer: This is not financial advice; it reflects only my personal market analysis. Please do your own research before trading.

ETH Trade Plan (December 12, 2025)ETH Trade Plan (December 12, 2025)
(D1 / H4 / H1 / M15)
⬛️ 1. Higher Timeframe Context (D1 and H4)
• D1 bias: bullish
• D1 range (approx): $3,000 – $3,500
• Key D1 zones:
• Supply: $3,450–$3,500
• Demand: $3,000–$3,192
• H4 bias: buy dips
• H4 zones of interest:
• H4 Sell Zone 1: – previous highs
• H4 Buy Zone 1: – support cluster
Active setups trend-aligned.
⬛️ 2. Preferred Setups by Horizon
🔳 2.1 Swing Setup (D1/H4)
• Idea: Buy dips to $3,192 (trend-aligned).
• Time horizon: multi-day.
• Context: On-chain + macro.
🔲 2.2 Intraday Setup (H1 focus)
• Idea: Long above $3,250.
• Time horizon: intraday.
• Context: Impulse regime.
▫️ 2.3 Scalp Setup (M15 focus)
• Idea: Buy pullbacks with absorption.
• Time horizon: minutes–hours.
▪️ 2.4 Arbitrage/Pairs Concept
• None.
⬛️ 3. Entry Zones and Triggers
🟩 3.1 Long Setup (Trend-Aligned)
• Execution timeframe: H1
• Trigger timeframe: M15
• Entry zone:
• Context: H4 demand.
• Pattern tags:
Trigger conditions:
• Hold support + positive delta.
• ML-Predictive (15m): upside ≥ downside.
• Risk not extreme.
🔴 4. Stops (Invalidation Levels)
Long setups:
• Stop: $3,100.
• Logic: Demand break.
🟢 5. Targets
Long:
• TP1: $3,300 – H1 level.
• TP2: $3,450 – H4 supply.
• TP3 (optional): $3,500 – D1 objective.
⬛️ 6. Position Sizing
• Baseline risk:
• Trend-aligned: 1.0.
• Adjust: medium uncertainty (Fed).
Final: 0.7 for long.
⬛️ 7. Risk Flags
• Fed event.
• Put skew.
• Mixed flows.
⬛️ 8. Flip Conditions
• Long to bear: Below $3,192 + sell delta.
⬛️ 9. Alternative Scenario
Rejection at $3,450: short zone $3,400–$3,450, stop $3,500, targets $3,300/$3,192. Failed break vs continuation.
⬛️ 10. Model Self-Critique
• Assumptions: Rally on macro, no surprise.
• Vulnerabilities: Risk-off.
• Do not overleverage pre-event.
⬛️ 11. Uncertainty and Constraints
• Uncertainty.level: medium.
• Avoid leverage, require confirmation.

CATCH ON ETHERUM HIGH PROBABILITY LONG SETUP SOON!!!🚨ETHER HIGH PROBABILITY BUY SETUP 🚨
* Here We Can See Clearly The Next Potential Moves For ETCUSD Coming Hours/Days.
* Keep Your Eyes Close On Your Trading Positions.
* Happy PIP Hunting Traders.
FXKILLA.

EthereumETHUSD
- Completed " 12345 " Impulsive Waves and " AB " Corrective Waves
- Break of Structure
- Sell Side Liquidity
- Break of Structure
- Bullish Channel as an corrective pattern in Long Time Frame

ETH/USDT : LIVE TRADEHello friends
you can see that a spike has formed and then the price has ranged.
Now with a valid breakout from above and a breakout from below, buyers can push the price to the specified points.
This analysis is purely technical and is not a buy or sell recommendation. So please refrain from emotional behavior.
*Trade safely with us*

ETH, againYesterday I thought about extending the SL lower, I wasn´t liking 100% the sideway movement it was making... so obsviously it went to hell today, just now. I´m making a new attempt, 15% up or 2% down.

ETH Trade Plan (December 10, 2025)ETH Trade Plan (December 10, 2025)
(D1 / H4 / H1 / M15)
⬛️ 1. Higher Timeframe Context (D1 and H4)
• D1 bias: bullish
• D1 range (approx): $3,000 – $4,000
• Key D1 zones:
• Supply: $3,800–$4,000 (historical resistance)
• Demand: $3,000–$3,300
• H4 bias: buy dips
• H4 zones of interest:
• H4 Sell Zone 1: – highs cluster
• H4 Buy Zone 1: – OB + demand
Active setups are trend-aligned with D1/H4.
⬛️ 2. Preferred Setups by Horizon
🔳 2.1 Swing Setup (D1/H4)
• Idea: Buy dips to $3,300 for $4,000+ (trend-aligned).
• Time horizon: multi-day.
• Context: Macro risk-on + on-chain strength.
🔲 2.2 Intraday Setup (H1 focus)
• Idea: Long above $3,370.
• Time horizon: intraday.
• Context: H4 impulse + rally regime.
▫️ 2.3 Scalp Setup (M15 focus)
• Idea: Buy pullbacks to $3,350 with absorption.
• Time horizon: minutes–hours.
▪️ 2.4 Arbitrage/Pairs Concept (if relevant)
• Long ETH/BTC – outperforming bias.
⬛️ 3. Entry Zones and Triggers
🟩 3.1 Long Setup (Trend-Aligned)
• Execution timeframe: H1
• Trigger timeframe: M15
• Entry zone:
• Context: H4 demand, whale flows supportive.
• Pattern tags:
Trigger conditions:
• Reclaim above $3,370 with positive delta.
• ML-Predictive (15m): upside ≥ downside.
• No extreme risk flags.
🔴 4. Stops (Invalidation Levels)
Long setups:
• Stop: $3,300.
• Logic: Break of demand; idea wrong below.
🟢 5. Targets
Long:
• TP1: $3,500 – H1 extension.
• TP2: $3,800 – H4 supply.
• TP3 (optional): $4,000 – D1 objective.
⬛️ 6. Position Sizing
• Baseline risk:
• Trend-aligned setups: 1.0.
• Adjust: low uncertainty + high alignment.
Final: 1.0 for trend long.
⬛️ 7. Risk Flags
• Put skew volatility.
• Fed event risk.
• High OI crowding.
⬛️ 8. Flip Conditions
• Long to bear: Close below $3,300 + negative funding.
⬛️ 9. Alternative Scenario
Rejection at $3,800: double top, short zone $3,750–$3,800, stop $3,850, targets $3,500/$3,300. Differs as failed breakout vs continuation.
⬛️ 10. Model Self-Critique
• Assumptions: Rally sustains on macro, no Fed surprise.
• Vulnerabilities: Sudden risk-off, misinterpreted flows.
• Do not chase highs without confirmation.
⬛️ 11. Uncertainty and Constraints
• Uncertainty.level: low.

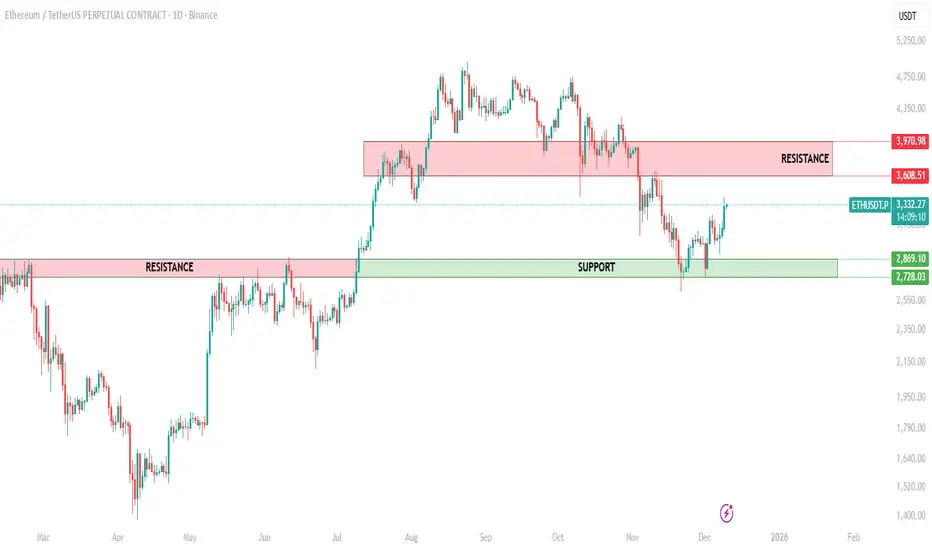
ETH Daily Chart UpdateEthereum has bounced strongly from the key support zone at 2728–2869 and is now pushing upward. This level has acted as a reliable demand area throughout the year, and the latest reaction confirms buyers are active again.
The next major hurdle is the resistance zone at 3608–3970. ETH will need a clean breakout above this range to open the door for a larger trend continuation.
For now, the structure remains intact:
• Support held perfectly
• Momentum shifting upward
• All eyes on the resistance above
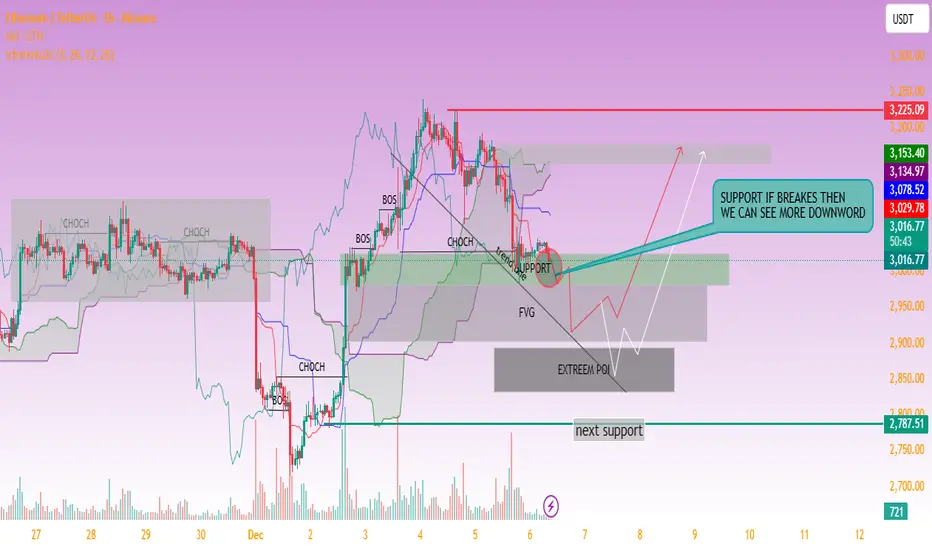
ETH 1H Outlook: Key Support Retest With Potential Downside RiskKey observations:
1. Support Level Under Pressure
ETH is retesting this support multiple times.
The annotation suggests: “SUPPORT IF BREAKS THEN WE CAN SEE MORE DOWNWORD” — meaning a breakdown could trigger further selling.
2. Downside Targets
If the current support fails, the next liquidity zones highlighted are:
FVG (Fair Value Gap) around $2,950–$2,900
Extreme POI zone around $2,880–$2,850
Major support at $2,787 (marked as “next support”).
3. Upside Scenario
If support holds, ETH could bounce toward:
$3,078
$3,134
High resistance around $3,225
4. Market Structure
Several CHoCH and BOS labels indicate mixed structure, showing recent weakness but with potential for rebound if buyers defend support strongly.
ETHUSDT Trade Plan (December 8, 2025)ETH Trade Plan (December 8, 2025)
(D1 / H4 / H1 / M15)
⬛️ 1. Higher Timeframe Context (D1 and H4)
• D1 bias: neutral (bullish reversal attempt)
• D1 range (approx): $2,800 – $3,762
• Key D1 zones:
• Supply: $3,350–$3,762 (previous breakdown + OB cluster)
• Demand: $2,800–$3,050
• H4 bias: buy dips
• H4 zones of interest:
• H4 Sell Zone 1: – previous rejection cluster (decaying)
• H4 Buy Zone 1: – OB + HVN + weekend absorption
All active setups are trend-aligned with emerging H4/D1 bullish structure.
⬛️ 2. Preferred Setups by Horizon
🔳 2.1 Swing Setup (D1/H4)
• Idea: Long dips into $3,100–$3,150 for retest $3,500+ (post-Fusaka accumulation).
• Time horizon: multi-day.
🔲 2.2 Intraday Setup (H1 focus)
• Idea: Long reclaim/break $3,150–$3,190 zone.
• Time horizon: today / overnight.
▫️ 2.3 Scalp Setup (M15 focus)
• Idea: Dip-buy $3,100–$3,110 with absorption or breakout >$3,140.
• Time horizon: minutes–hours.
▪️ 2.4 Arbitrage/Pairs Concept
• Long ETH/BTC ratio – defending key support, mean-reversion bias up.
🟩 3. Entry Zones and Triggers
Main Long Setup (Trend-Aligned)
• Execution timeframe: H1
• Trigger timeframe: M15/M5
• Entry zone:
• Context: H4 demand + weekend sweep reclaim + institutional spot buying
• Pattern tags:
Trigger conditions:
• Price holds $3,100 bid cluster + M15 bullish structure (higher low + volume delta buy)
• CVD positive or diverging bullish
• ML-Predictive 15m upside prob ≥0.65
• No aggressive ask walls rebuilding
🔴 4. Stops (Invalidation Levels)
Long setups:
• Stop: $3,045 (below weekend low + H4 demand)
• Logic: Structural failure, CHoCH down confirmed.
🟢 5. Targets
Long:
• TP1: $3,190 – local supply + FVG fill (H1/H4)
• TP2: $3,350 – supply retest + LVN void (H4/D1)
• TP3 (swing): $3,600+ – next HVN + extension (D1)
⬛️ 6. Position Sizing
• Baseline risk trend-aligned: 1.0%
• Adjustments: −0.2× (put skew + weekend tail) +0.1× (strong absorption + news)
• Effective risk: 0.9% main long, max 0.4% aggressive scalps
⬛️ 7. Risk Flags
• Persistent put skew → vol expansion downside risk
• Weekend liquidity memory (potential gap lower Asia)
• High OI + neutral funding → crowded long risk if macro flips
• Death cross D1 still active (macro timeframe bearish pressure)
⬛️ 8. Flip Conditions
Bull → bear flip: H4 close < $3,050 + CVD strongly negative + funding negative.
⬛️ 9. Alternative Scenario
Fakeout above $3,190 → sharp rejection (spoofing + gamma) → trap longs → drop to $2,950–$3,000 (next demand + round number). Requires delta selling + macro risk-off trigger.
⬛️ 10. Model Self-Critique
• Main assumptions: Fusaka narrative sustains buying, institutional accumulation continues, no macro shock.
• Vulnerabilities: put skew buyers re-assert, whale distribution at supply, weekend gap lower, misread absorption.
• Do NOT chase extended above $3,200 without volume. Do NOT hold through Asia low liquidity without tight stops.
⬛️ 11. Uncertainty and Constraints
Uncertainty: medium
Constraints: require M15 confirmation + positive delta, no entries above $3,200, reduce size into NY close if no volume.

#ETH/USDT (1h) (spot)#ETH
The price is moving in a descending channel on the 1-hour timeframe. It has reached the lower boundary and is heading towards a breakout, with a retest of the upper boundary expected.
We are seeing a bearish trend in the Relative Strength Index (RSI), which has reached near the lower boundary, and an upward bounce is expected.
There is a key support zone in green at 2970, and the price has bounced from this level several times. Another bounce is expected.
We are seeing a trend towards stabilizing above the 100-period moving average, which we are approaching, supporting the upward trend.
Entry Price: 30019
First Target: 3058
Second Target: 3124
Third Target: 3202
Remember a simple principle: Money Management.
Place your stop-loss order below the green support zone.
For any questions, please leave a comment.
Thank you.

Ethereum crypto strong demand at $2,880 playing outEthereum tapped a major demand zone at $2,880, and the reaction is clear: buyers stepped in, just like they usually do when a clean, fresh imbalance takes control. The last time ETH reacted to a similar structure on the bigger timeframes, we saw extended bullish legs unfolding week after week.
Right now, the question is simple:
Will this demand level hold long enough to push ETH toward $4,120 and beyond?
Based on the current imbalance structure, the answer leans strongly toward yes.

ETH/USDT 4HOUR CHART UPDATE !!ETH/USDT is retracing after being rejected by the 3,150–3,200 resistance area and the descending 200 MA, but is still trading within a larger contracting structure with higher lows forming.
The price broke above the short-term downtrend line but quickly failed near the green moving average and is now sliding back toward the confluence of old diagonal resistance and rising support around 2,850–2,900.
This zone is the first major demand zone; below it, the next major support on this chart is the wide yellow block at 2,500–2,550, where the previous strong rally began.
ETH moved sideways down inside the converging trendline, forming a base around 2,800–2,900, before a sharp move higher toward 3,300+ if buyers defend that area.
A clean 4H close below the rising lower trendline, and especially below 2,500, would invalidate the bullish consolidation idea and create room for a deeper correction towards previous higher-timeframe support.
DYOR | NFA

#ETH/USDT (1h) (spot)#ETH
The price is moving in a descending channel on the 1-hour timeframe. It has reached the lower boundary and is heading towards breaking above it, with a retest of the upper boundary expected.
We have a downtrend on the RSI indicator, which has reached near the lower boundary, and an upward rebound is expected.
There is a key support zone in green at the 2960 price level. The price has bounced from this zone multiple times and is expected to bounce again.
We have a trend towards stability above the 100-period moving average, as we are moving close to it, which supports the upward move.
Entry price: 3000
First target: 3033
Second target: 3080
Third target: 3140
Don't forget a simple principle: money management.
Place your stop-loss below the support zone in green.
For any questions, please leave a comment.
Thank you.

ETHUSD 1H — Short Opportunity After Channel BreakCOINBASE:ETHUSD
Price is trading inside a broad descending structure, and the recent move appears corrective, forming a rising channel. This type of structure often represents distribution before continuation lower.
A sweep into the 3,250–3,320 supply zone aligns with previous imbalance and trendline rejection. If the price rejects this zone with momentum, the bearish continuation setup becomes valid.
Key Scenarios
❌ Bearish Case (Primary Setup) 📉
Ideal Entry: 3,250–3,320 Zone (Supply)
→ 🎯 Target: 2,700–2,650 (Liquidity Sweep + Demand Zone)
→ 🛑 Stop Loss: Above 3,380
Confirmation triggers:
• Break of rising channel
• Bearish engulfing candle
• Wick rejection into the zone
Levels to Watch
Type Price
Short Entry 📍 3,250–3,320
Target 🎯 2,650–2,700
Stoploss ❌ 3,380
Invalid if Broken Trendline + Structure Flip
⚠️ This analysis is for educational purposes only — not investment advice.

ETHUSD Long Setup — Potential Reversal After Liquidity SweepAfter an extended sell-off during the session, ETH formed a sharp liquidity sweep near the $2,720 – $2,730 zone, followed by a strong bullish reaction. Price has broken short-term structure to the upside and is now forming higher lows on the 15-minute timeframe.
📌 Entry: around $2,800
📌 Stop-loss: below the liquidity sweep zone (~$2,725)
📌 Take-profit: targeting $2,960 – $2,970 zone from previous imbalance / inefficiency
➕ Confluences
Rejection from higher-timeframe demand
Aggressive selling exhausted after liquidity grab
Bullish market structure shift (MSS) on M15
Increasing volume on upward candles
⚠️ What invalidates the setup?
A clean break below $2,725 with strong selling pressure would invalidate the reversal bias and open space for continuation to the downside.

ETH : SELL MARKET!!!Hello friends
Well, as you can see, we are in a very strong downtrend and the sellers have full control.
Now, any price increase can be a selling opportunity, until the buyers show strength, we cannot say that the trend has changed...
Of course, we are also at important support and we need to see whether buyers support the price or not. Until then, we will not trade on guesswork and predictions.
This analysis is purely technical and is not a buy or sell recommendation, so please exercise your risk and capital management.
*Trade safely with us*

Selena | ETHUSD 1H – Bullish Continuation SetupCOINBASE:ETHUSD
The recent rejection from the upper trendline created short-term corrective movement. Liquidity sweeps below minor support hint at accumulation, and as long as price remains above the invalid zone at 2899, bullish momentum is favored. Holding demand could fuel another expansion toward the next resistance block.
Key Scenarios
✅ Bullish Case 🚀
Hold above Demand Zone (≈ 2990–3020) →
→ 🎯 Target 1: 3110
→ 🎯 Target 2: 3180
→ 🎯 Target 3: 3220 (Top Resistance)
❌ Bearish Breakdown 📉
Break below 2899 invalidation zone
→ Potential retracement toward 2755 – strong support zone
→ Deeper demand sits near 2621 if structure fully collapses.
Current Levels to Watch
Resistance 🔴: 3110 | 3180 | 3220
Support 🟢: 3020 | 2899 | 2755
⚠️ Disclaimer: Educational analysis only. Not financial advice.

Selena | ETHUSD 2H — Bullish Momentum Retest Setup |COINBASE:ETHUSD
After a strong sell-off, ETH formed a base around $2620 and reclaimed structure. The recent breakout and consolidation suggest accumulation before continuation. As long as price holds above $2940–$3000, bullish continuation remains favored toward the next supply zone
Key Scenarios
✅ Bullish Case 🚀
If price holds above $2940–$3000 support:
🎯 Target 1: $3200
🎯 Target 2: $3350–$3450 (major supply zone)
❌ Bearish Case 📉
A clean break below $2940 may invalidate the bullish structure and open deeper retracement.
Current Levels to Watch
Support Zone: $2940–$3000
Rising Channel Support
Liquidity Target: $3350–$3450
⚠️ Disclaimer: This analysis is for educational purposes only. Not financial advice.

$ETH Bounce Time – Scalping Long SetupCharts show everything – your move is simple:👇
🟢 Entry Zones: $3430 | $3390(Dca)
🎯 Targets :
1️⃣ TP1 → $3500
2️⃣ TP2 → $3550
3️⃣ TP3 → $3600
4️⃣ TP4 → $3700 (maximum upside if momentum continues)
⚡ Stop Alert: If CRYPTOCAP:ETH closes below $3350 on 4H/Daily, manually exit. Backup stop: $3300
🟢 Buy : CRYPTOCAP:ETH now & catch the bounce!
🚀 Follow market flow & don’t miss the profit!
#ETH/USDT Does this scenario cross your mind? What if…#ETH
The price is moving in a descending channel on the 1-hour timeframe and is expected to break out and continue upwards.
We have a trend to stabilize above the 100-period moving average again.
We have a downtrend on the RSI indicator, which supports an upward move if it breaks above it.
We have a key support zone in green that pushed the price higher at 3186.
Entry price: 3230
First target: 3286
Second target: 3350
Third target: 3421
For risk management, don't forget your stop-loss and money management.
The stop-loss should be below the green support zone.
Upon reaching the first target, take some profits and then change your stop-loss order to an entry order.
For any questions, please comment.
Thank you.

ETH-----Sell around 3475, target 3408 areaETH Contract Technical Analysis (November 6th):
On the daily chart, yesterday's close was a small positive candle, with a pattern of consecutive negative candles followed by a single positive candle. The price is below the moving average, and the accompanying indicators are in a death cross, indicating a clear downtrend. Yesterday's rebound was a correction after a significant drop, with the price correcting back to the moving average and facing secondary downward pressure – a common and predictable pattern. On the hourly chart, the rebound after the decline lacks strength and continuity, making it unlikely to establish a short-term trend. Therefore, intraday trading is expected to be range-bound, with the European session likely to see further downward pressure.
Today's ETH Short-Term Contract Trading Strategy:
Sell at 3475, stop-loss at 3510, target 3408.
