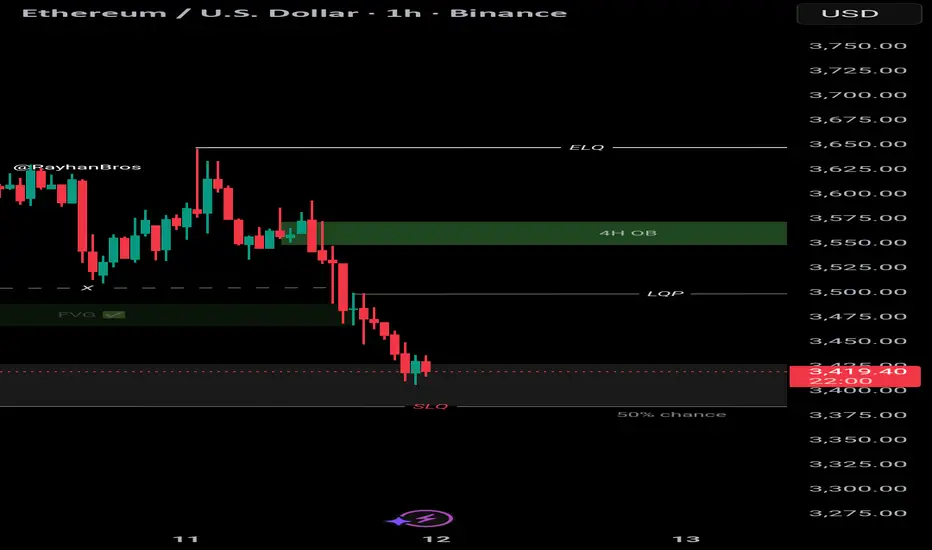
ETH : SELL MARKET!!!Hello friends
Well, as you can see, we are in a very strong downtrend and the sellers have full control.
Now, any price increase can be a selling opportunity, until the buyers show strength, we cannot say that the trend has changed...
Of course, we are also at important support and we need to see whether buyers support the price or not. Until then, we will not trade on guesswork and predictions.
This analysis is purely technical and is not a buy or sell recommendation, so please exercise your risk and capital management.
*Trade safely with us*
Ethlongsetup

Selena | ETHUSD 1H – Bullish Continuation SetupCOINBASE:ETHUSD
The recent rejection from the upper trendline created short-term corrective movement. Liquidity sweeps below minor support hint at accumulation, and as long as price remains above the invalid zone at 2899, bullish momentum is favored. Holding demand could fuel another expansion toward the next resistance block.
Key Scenarios
✅ Bullish Case 🚀
Hold above Demand Zone (≈ 2990–3020) →
→ 🎯 Target 1: 3110
→ 🎯 Target 2: 3180
→ 🎯 Target 3: 3220 (Top Resistance)
❌ Bearish Breakdown 📉
Break below 2899 invalidation zone
→ Potential retracement toward 2755 – strong support zone
→ Deeper demand sits near 2621 if structure fully collapses.
Current Levels to Watch
Resistance 🔴: 3110 | 3180 | 3220
Support 🟢: 3020 | 2899 | 2755
⚠️ Disclaimer: Educational analysis only. Not financial advice.

Selena | ETHUSD 2H — Bullish Momentum Retest Setup |COINBASE:ETHUSD
After a strong sell-off, ETH formed a base around $2620 and reclaimed structure. The recent breakout and consolidation suggest accumulation before continuation. As long as price holds above $2940–$3000, bullish continuation remains favored toward the next supply zone
Key Scenarios
✅ Bullish Case 🚀
If price holds above $2940–$3000 support:
🎯 Target 1: $3200
🎯 Target 2: $3350–$3450 (major supply zone)
❌ Bearish Case 📉
A clean break below $2940 may invalidate the bullish structure and open deeper retracement.
Current Levels to Watch
Support Zone: $2940–$3000
Rising Channel Support
Liquidity Target: $3350–$3450
⚠️ Disclaimer: This analysis is for educational purposes only. Not financial advice.

$ETH Bounce Time – Scalping Long SetupCharts show everything – your move is simple:👇
🟢 Entry Zones: $3430 | $3390(Dca)
🎯 Targets :
1️⃣ TP1 → $3500
2️⃣ TP2 → $3550
3️⃣ TP3 → $3600
4️⃣ TP4 → $3700 (maximum upside if momentum continues)
⚡ Stop Alert: If CRYPTOCAP:ETH closes below $3350 on 4H/Daily, manually exit. Backup stop: $3300
🟢 Buy : CRYPTOCAP:ETH now & catch the bounce!
🚀 Follow market flow & don’t miss the profit!
#ETH/USDT Does this scenario cross your mind? What if…#ETH
The price is moving in a descending channel on the 1-hour timeframe and is expected to break out and continue upwards.
We have a trend to stabilize above the 100-period moving average again.
We have a downtrend on the RSI indicator, which supports an upward move if it breaks above it.
We have a key support zone in green that pushed the price higher at 3186.
Entry price: 3230
First target: 3286
Second target: 3350
Third target: 3421
For risk management, don't forget your stop-loss and money management.
The stop-loss should be below the green support zone.
Upon reaching the first target, take some profits and then change your stop-loss order to an entry order.
For any questions, please comment.
Thank you.

ETH-----Sell around 3475, target 3408 areaETH Contract Technical Analysis (November 6th):
On the daily chart, yesterday's close was a small positive candle, with a pattern of consecutive negative candles followed by a single positive candle. The price is below the moving average, and the accompanying indicators are in a death cross, indicating a clear downtrend. Yesterday's rebound was a correction after a significant drop, with the price correcting back to the moving average and facing secondary downward pressure – a common and predictable pattern. On the hourly chart, the rebound after the decline lacks strength and continuity, making it unlikely to establish a short-term trend. Therefore, intraday trading is expected to be range-bound, with the European session likely to see further downward pressure.
Today's ETH Short-Term Contract Trading Strategy:
Sell at 3475, stop-loss at 3510, target 3408.

#ETH/USDT Ethereum at a Crossroads: Accumulation vs. Profit-Tak#ETH
The price is moving within an ascending channel on the 1-hour timeframe and is adhering to it well. It is poised to break out strongly and retest the channel.
We have a downtrend line on the RSI indicator that is about to break and retest, which supports the upward move.
There is a key support zone in green at the 3663 price, representing a strong support point.
We have a trend of consolidation above the 100-period moving average.
Entry price: 3720
First target: 3750.45
Second target: 3815.15
Third target: 3885.60
Don't forget a simple money management rule:
Place your stop-loss order below the green support zone.
Once the first target is reached, save some money and then change your stop-loss order to an entry order.
For any questions, please leave a comment.
Thank you.

ETH-----Sell around 3890, target 3830 areaETH Contract Technical Analysis (November 3rd):
On the daily chart, yesterday's close was a small positive candle. While the candlestick pattern shows consecutive positive days, the momentum and continuation are weak, and the price is below the moving averages. The accompanying indicators are showing a death cross, indicating a clear downward trend. Therefore, the trading strategy remains sell. On the hourly chart, the resistance level is around 3920. The current price has rebounded to near the 4-hour moving average resistance level. Given the clear downward trend, further upward movement is unlikely. Therefore, the focus for today and the European session should be on a break below support levels.
Today's ETH Short-Term Contract Trading Strategy:
Sell at 3890, stop loss at 3930, target 3830.

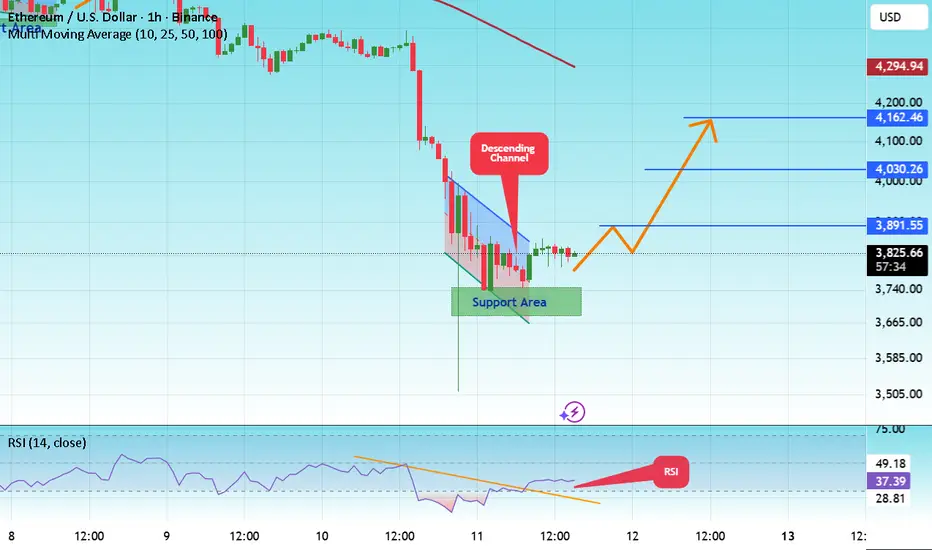
ETHUSDT: Short-Term Pullback Toward Trendline Before PotentialHi guys!
On the current 1h chart, Ethereum shows a clear structure of recovery following a liquidity sweep marked as “Hunting happened.” This move indicates that liquidity below the previous lows has already been collected, creating a potential base for a short-term bullish correction.
Price is currently consolidating above a minor support zone (highlighted in pink), showing a possible accumulation phase. The projected path suggests a potential bullish move toward the major supply zone around $4,080–$4,180, which aligns with the descending trendline acting as dynamic resistance.
However, given the overall bearish market structure and the dominance of the descending trendline, the area around $4,100 could serve as a strong reaction zone. A rejection from this level would likely confirm continuation of the broader downtrend, with a possible retracement toward the $3,700–$3,750 area.

Ethereum $ETH still has weekly demand in control. Will it rally?Ethereum CRYPTOCAP:ETH still has weekly demand in control. Will it rally higher? Waiting for some more bullish price action or a pullback to the weekly demand lower at $2,600.

ETH-----Sell around 4035, target 3960 areaETH Contract Technical Analysis (October 29th):
On the daily chart, yesterday's close was a small bearish candle, indicating a consecutive decline. The price is still within a range, and the accompanying indicators show a golden cross with decreasing volume. The overall trend remains bullish, but the price is currently in a range-bound movement. However, attention should be paid to data releases and news-driven stimuli. On the hourly chart, the price faced downward pressure during the US session, but rebounded from early support this morning. The current candlestick pattern shows a consecutive bullish reversal, while the accompanying indicators show a bearish cross with decreasing volume. However, the four-hour chart shows significant price suppression, with resistance around the 4035 area.
Today's ETH Short-Term Contract Trading Strategy:
Sell at the 4035 area, stop loss at the 4070 area, target 3960 area;

Ethereum Buying opportunity Previous week Ethereum closed above weekly resistance level $4093. Currently trading within a top range. ETH has decisively broken above the prior week's High, signalling continued bullish momentum. The probability of ETH retesting its previous all-time high of $4,951 in the near future is very high.

#ETH/USDT : Another Attempt To Resume Upward Movement
#ETH
The price is moving within a descending channel on the 1-hour frame, adhering well to it, and is heading for a strong breakout and retest.
We have a bearish trend on the RSI indicator that is about to be broken and retested, which supports the upward breakout.
There is a major support area in green at 3826, which represents a strong support point.
We are heading for consolidation above the 100 moving average.
Entry price: 3831.
First target: 3920.
Second target: 3969.
Third target: 4200.
Don't forget a simple matter: capital management.
When you reach the first target, save some money and then change your stop-loss order to an entry order.
For inquiries, please leave a comment.
Thank you.

technical analysis for your ETH/USD chart:Pair: Ethereum / U.S. Dollar (ETH/USD)
Current Price: around $3,931
Structure: Rising channel pattern
Key Zones:
Support Level: $3,850 – $3,880
Target Level: $4,120.70
📊 Technical Analysis
Trend Structure:
ETH/USD is currently trading within an ascending channel, reflecting a short-term bullish structure.
Price is consolidating just above the midline of the channel, suggesting a potential retracement before the next bullish leg.
Support Area Reaction:
The support level near $3,850 – $3,880 aligns with the lower channel boundary.
A possible pullback into this zone could act as a liquidity grab before a bullish continuation.
Bullish Scenario (Primary Expectation):
If price retests and holds above the support level, expect a rebound toward $4,120.
Confirmation: Bullish candlestick pattern or breakout above the local resistance around $3,970.
Bearish Scenario (Alternative):
A confirmed break below $3,850 could invalidate the bullish setup.
In that case, ETH could extend lower toward $3,780 – $3,750 support area.
⚙️ Trading Plan (Summary)
Direction Entry Zone Stop-Loss Target
🔺 Long (Buy) 3,850 – 3,880 Below 3,820 4,120
🔻 Short (Sell – only if breakdown) Below 3,850 Above 3,900 3,750
🧩 Technical Indicators (Implied)
Trend: Bullish structure intact within ascending channel.
Momentum: Neutral–bullish (possible short-term retracement).
Market Sentiment: Buyers maintaining control unless $3,850 breaks. NASDAQ:TSLA NASDAQ:NVDA NASDAQ:AMD NASDAQ:PLTR NASDAQ:META NASDAQ:MSFT NASDAQ:NFLX NASDAQ:INTC NASDAQ:BYND NASDAQ:MSTR

Etherium to 7500Right now BINANCE:ETHUSDT is just barely holding above 3500 area which is a good sign and showing it's potential to break ATH. But remember 3500 is not that major support, so it may break this support area and look for major support zone which is around 2100-2600 area. That would be a perfect opportunity enter long position on BINANCE:ETHUSDT , or maybe buy on spot. It can also fakeout 3500 area and go up. And also there is a obvious triangle pattern appeared in 1W timeframe which is a very good sign to go up in my opinion. Our first target will be 7500 and then 10k, 12k, 15k. So time will tell.

ETHUSDTBINANCE:ETHUSDT have a amazing trend because this is second the best crypto an head of all project so is in watchlist of best traders.
Support for buy: 3750$
Resistance for targets: 4045 - 4200 - 4435 - 4755
Please your risk management.

ETH(20251022) market analysis and operationTechnical Analysis of the ETH Contract on October 22nd:
Today, the large-scale daily chart closed with a small negative candlestick pattern. The K-line pattern continued to decline, and the price remained at a low level. The accompanying indicator formed a downward death cross, and the overall downward trend is still very clear. Although the overall momentum is not strong at present and remains within the range, such a trend is easily affected by news or data, and a significant downward breakout is likely. Therefore, the short-term trading strategy of the high point remains unchanged. The short-term hourly chart showed downward pressure on the price in the early morning. The current K-line pattern continued during the Asian morning. The accompanying indicator formed a downward death cross and broke through the previous day's low. Therefore, today is a simple matter. Focus on the day and wait for a pullback correction in the European session before entering the market and selling directly. The strategy and timing are relatively clear, so please strictly follow it.

ETHUSD Is showing a great buy opportunity - low risk high rewardETHER - ETH/USD experienced a big drop to the downside like most other cryptocurrencies... but it nows has very clear signs of a major bullish movement ahead. There is currently a head and shoulders pattern forming which has given us high confidence that it will head to the upside. BUY NOW!

Ethusdt - dragon longIf you like the idea, please put a ‘like’. It's the best ‘Thank you!’ 😊 P.S. Always do your own analysis before a trade. Set a stop loss. Capture profits in instalments. Withdraw profits in fiat and make yourself and your friends happy.

ETH : BUY OR SELL ?Hello friends
Given the good decline we had, there was a good opportunity to buy at good prices with capital and risk management and in steps and move towards the specified goals.
*Trade safely with us*

#ETH/USDT forms bullish patterns#ETH
The price is moving in a descending channel on the 1-hour frame and is expected to break and continue upward.
We have a trend to stabilize above the 100 moving average once again.
We have a downtrend on the RSI indicator that supports the upward move with a breakout.
We have a major support area in green that pushed the price higher at 3700.
Entry price: 3817.
First target: 3890.
Second target: 4030.
Third target: 4162.
To manage risk, don't forget stop loss and capital management.
When you reach the first target, save some profits and then change your stop order to an entry order.
For inquiries, please comment.
Thank you.
Ethereum Swing Trade Analysis - ETH LONGEthereum Swing Trade Analysis
Following a clear rejection at a supply zone after filling a daily imbalance (FVG), price action has shown notable structural changes. Specifically, we observed a break of structure on the 4-hour chart, which appears to be a direct reaction to the mitigation of this imbalance.
Additionally, a series of down-close candles on the H4 timeframe indicate potential bullish absorption, often suggestive of a reversal in momentum. This confluence, along with the recent fill of the daily fair value gap, suggests that price has likely found support at this key level.
Given these technical signals : rejection at resistance, structural break, and supportive price behavior around the filled FVG.
I am considering to enter a swing long position after filling M15 FVG imbalance.
The target for this trade is the equal highs on the buy-side liquidity around the $4,385 level.
Will be updating the course of this trade in the following days until it reaches final take profit target.
Talk to you soon !

$ETH Performing Ascending Channel
An ascending channel, or rising channel, is a chart pattern used in technical analysis to identify a security's ongoing uptrend. It is characterized by the price fluctuating between two parallel, upward-sloping trendlines.
Key components
Higher highs and higher lows:
The price consistently makes higher swing highs and higher swing lows over a period of time, indicating steady bullish momentum.
Parallel trendlines:
Two parallel lines are drawn to frame the price action.
Upper line (resistance):
Connects the higher swing highs. It represents the point where selling pressure is strong enough to temporarily stop the price from rising.
Lower line (support):
Connects the higher swing lows. This line indicates where buying pressure is strong enough to prevent the price from falling further.
