Continuation of the previous idea based on the Harmonious EnergyThe consolidation phase is coming to an end. The market structure is gradually moving into the next stage of the energy cycle, where a new flow direction is forming.
At the moment, I am observing a continuation of the energy movement with a noticeable manifestation of buyer strength. The key focus is on price behaviour near the resistance level — this is where it will become clear whether buyers will be able to maintain control and continue the upward momentum, or whether the market will enter a redistribution phase.
According to the GPE concept, this moment reflects the transition from balance to energy release — when the accumulated potential turns into real movement.
📌 Observation: price reaction to resistance and confirmation of the flow's strength.
💬 If you have any questions or would like to discuss the idea in more detail, I am always open to dialogue.
Ethlongsetup

Trading idea based on the Harmonious Energy Flow (HEF) conceptAt the current stage, there is a clear manifestation of buyers’ strength, even though the market environment is changing rapidly without any significant price movement. This forms a state of consolidation, where energy is being accumulated for the next impulse.
According to the HEF concept, consolidation represents a transitional phase — the market is searching for balance before initiating a new wave of directional movement. My current expectation is focused on the moment of breakout from consolidation, when the market will reveal the true side of strength.
📌 Main focus: observing how buyers maintain their advantage within this narrow structure and waiting for a signal confirming the exit from balance.
If you find my charting approach interesting, you are welcome to connect and discuss further. I’m open to communication and collaboration.
Would you like me to refine this version for maximum stylistic alignment with TradingView’s publication tone (slightly shorter, more analytical, and visually structured)?
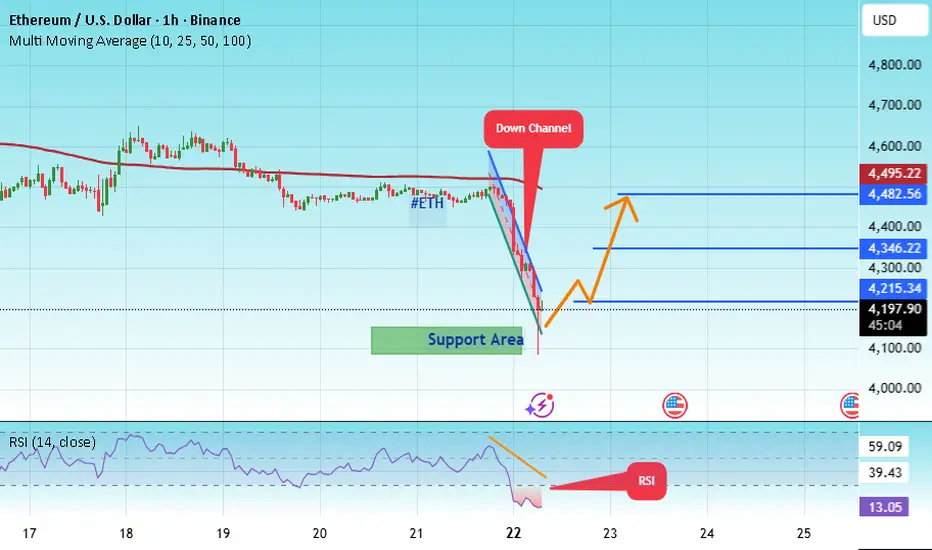
#ETH/USD - Roll back - Its coming baack to 4500#ETH
The price is moving within a descending channel on the 1-hour frame, adhering well to it, and is heading for a strong breakout and retest.
We have a bearish trend on the RSI indicator that is about to be broken and retested, which supports the upward move.
There is a major support area in green at 4111, which represents a strong support point.
We are heading for consolidation above the 100 moving average.
Entry price: 4136.
First target: 4215.
Second target: 4346.
Third target: 4482.
Don't forget a simple matter: capital management.
When you reach the first target, save some money and then change your stop-loss order to an entry order.
For inquiries, please leave a comment.
Thank you.
BTC smashes 120K, ETH tests 4.5K! Is Altseason finally here?Bitcoin breaks through $120K while Ethereum retests critical $4500 resistance. Our analysis reveals why this "Uptober" rally could signal the start of the biggest altcoin surge since 2021.
🚀 Rally catalysts
US Government shutdown : Dollar weakness from political uncertainty and Fed policy paralysis
"Uptober Effect" : Bitcoin historically averages 20%+ gains in October (currently up 5-6% with 3 weeks remaining)
Institutional flows: $4B+ institutional buying, 850K ETH whale accumulation in past 2 weeks
Q4 seasonality: Crypto's strongest quarter with historical momentum into year-end
📊 Bitcoin Technical Analysis
Pattern : Bullish hidden divergence confirmed with swing high breakout above $118K resistance
Current structure : Potential 5-wave Elliott sequence suggesting final impulse leg
Key levels : Support at $117K (trendline), resistance cluster $122K-$124K
Momentum : RSI recovering, MACD bullish crossover confirms continuation
⚡ Ethereum technical breakdown
Weekly setup : Successful retest and hold above $4K support, pennant/triangle breakout in play
RSI divergence : Bullish divergence confirmed on multiple timeframes, RSI near 60 (room to 70+)
Elliott wave count : Either completing Wave 5 (correction ahead) or early Wave 3 (massive move higher)
Cup & Handle : Measured move target to $6,850 based on long-term pattern
🔥 Altseason indicators - Total3 analysis
Chart pattern : Cup & handle formation on Total3 (altcoins ex-BTC/ETH) approaching ALL-TIME HIGHS
Key level : $1.1T breakout threshold - confirmation needs 3 daily closes above ATH
BTC dominance: Break below 60% support signals potential altcoin rotation
Targets: $1.2T initial, $1.3T extension if breakout sustains
💹 Trading Strategy
ETHEREUM LONG Setup:
Entry: $4,300 on pullback (current: $4,500)
Stop Loss : Below $4,050 (1.618 Fib extension)
Take Profit 1 : $5,200 (2:1 R/R)
Take Profit 2 : $6,850 (measured move target)
Risk Management : Trail stops above breakeven after TP1
Key levels to watch:
Bitcoin : $117K support, $122-124K resistance zone
Ethereum : $4,126 critical support, $4,500 resistance, $6,850 long-term target
Total3 : $1.1T breakout level for altseason confirmation
🎯 Market outlook
October living up to "Uptober" reputation with favourable macro setup. Dollar weakness, institutional flows, and technical breakouts align for potential crypto supercycle. Watch Total3 breakout - if altcoins breach ATH, we could see 2021-style altseason explosion.
This content is not directed to residents of the EU or UK. Any opinions, news, research, analyses, prices or other information contained on this website is provided as general market commentary and does not constitute investment advice. ThinkMarkets will not accept liability for any loss or damage including, without limitation, to any loss of profit which may arise directly or indirectly from use of or reliance on such information.

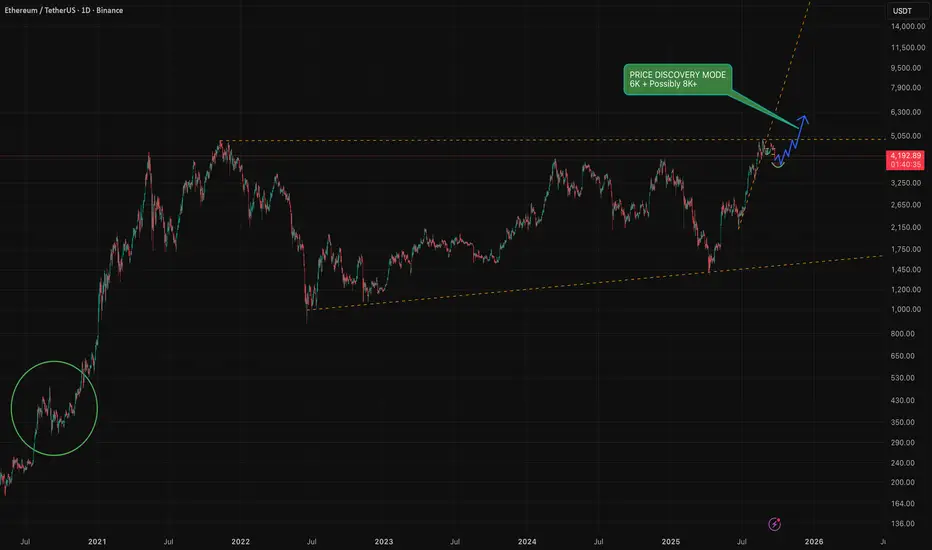
ETH Top / all time high In my earlier analysis I predicted the 2020 September happening again and it is happening as you are reading this.
From the chart and my analysis I can see ETH topping out around 6.8K this run !
I know, we are all hoping for 12K this BullRun and more but personally I am taking out profits around 6K slowly until the top hits and see a clear reversal.

History doesn't repeat but RHYMES ! I highly recommend everyone to have look at September 2020
I personally think that this will be the same scenario where we will have some fake-outs to drive the retails out / liquidate then the price will carry on upwards and go into price discovery mode where we are more likely to see 6K and hopefully more, if the volume and kicks in the ETF's and more retail pump we can see somewhere between 8K to 12K ( Optimistically )
I personally will be taking profits along the way tho and not going to wait for the top as we all know no one can predict the top nor the bottom !
Thank you all for reading my idea and feel free to share yours here in the comments.
To get access to my indicators please join the FREE tg channel, link in my BIO !
Market idea based on the Harmonious Energy Flow (HEF) conceptAt the current stage, we can observe a clear manifestation of buyers’ strength, even though the market conditions are shifting rapidly without any significant price expansion. This creates a state of consolidation, where energy is being accumulated for the next move.
According to the HEF concept, consolidation represents a transitional phase — the market is searching for balance before moving into a new wave of directional flow. My current expectation is the transition towards the breakout moment, when price finally exits this consolidation zone and reveals the true side of strength.
📌 Key focus: monitoring how buyers sustain their advantage within this tight structure, and waiting for the signal of release from balance.
If you find my charting approach interesting, you are very welcome to connect for further discussion. I am open to dialogue and exchange of views.

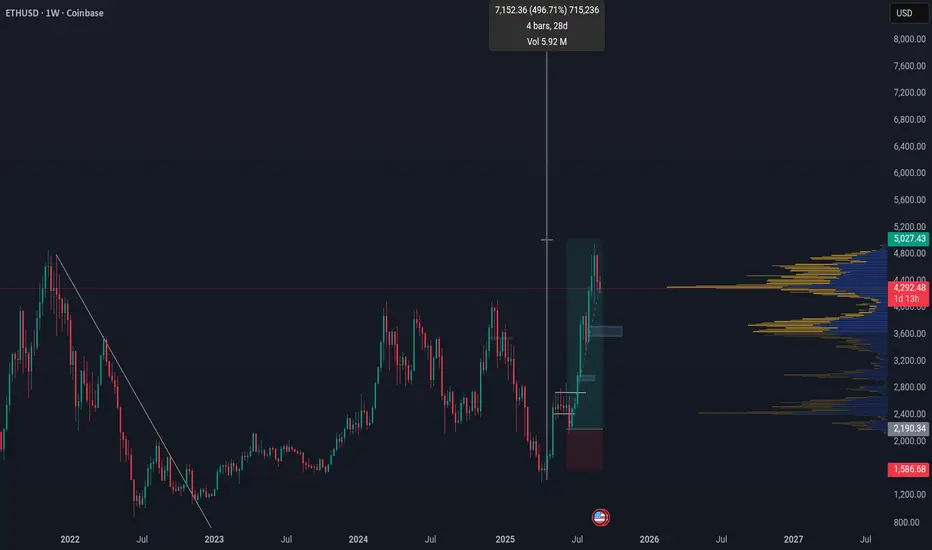
ETHUSD Weekly Scenarios BullsWeekly Scenarios
Bulls
If ETH holds support at $4,200 and manages to rebound above the $4,500-4,600 resistance, we can expect a rally to $5,000 and beyond.
Sideways/Consolidation
The price may remain stuck in the $4,200-4,600 range until the market finds enough signal or volume to break out.
Bears
A breakout below $4,200 with volume confirmation will lead to a decline to $3,800 and below.

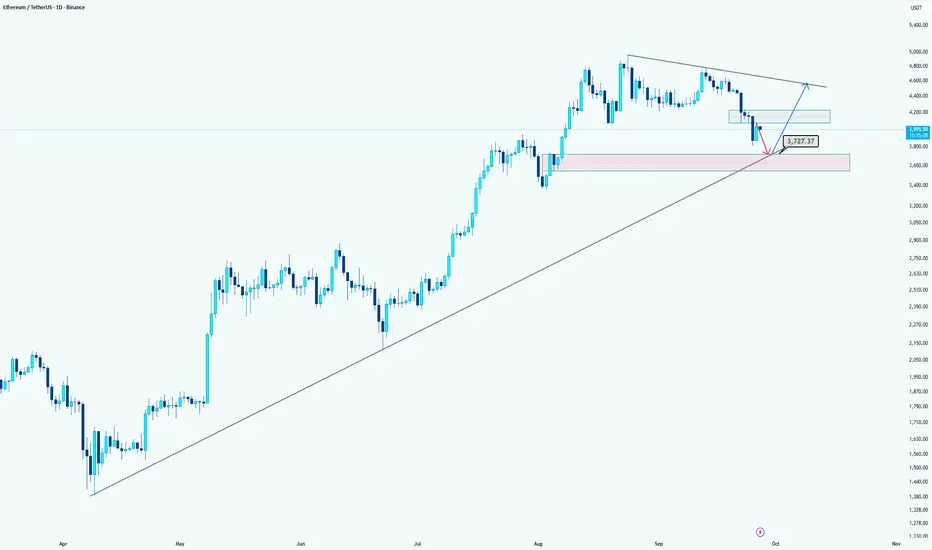
Ethereum: Levels to WatchHi guys!
Ethereum is currently showing weakness after failing to break higher. The price is likely to retest the MPL zone around $3727, which also aligns with the long-term ascending trendline, making it a strong confluence support.
The pink area highlights a potential demand zone where buyers may step in. If the market confirms bullish signals in this area, a long position toward the descending trendline resistance could be considered. However, extra confirmations are recommended before entering long.
Summary:
Short-term target for shorts: $3727 (MPL plus trendline support).
Watch the pink zone for potential long entries, but wait for confirmation.
Let's see what will happen!
Ethereum $ETH crypto trade idea using the weekly demand levelThere is an Ethereum CRYPTOCAP:ETH crypto trade idea using the weekly demand at $3,872. This is a very similar crypto swing trade idea I recently shared with BitCoin. Let's see if it wants to rally for a couple of weeks. You can use the smaller timeframes to trade crypto intraday strategies or scalping strategies.

ETH UPDATEHello friends
Well, you can see that due to the bearish market cycle, the downward steps have gradually become smaller and we have hit a higher ceiling at the specified support, which is a sign of a weak trend or price flooring. If this specified price floor is maintained, the price can move to the specified targets.
*Trade safely with us*

HARD SHORTMy former analysis successfully landed to target zone. And now market wants a pull back.
1-Above there is low liqudation
2-Next week we will probably see a rate cut. thats why I am a little nervous abot open short
3-Till that day I think whales will chase cheap asset that is where my courage come from
4-Market wants to see a pull back
be careful about short you may just want to open long at the below
Always manage your own risks this is not a investment advise I am not responsible neither your loss nor profit.

ETHUSDT.PHello friends
Given the good growth we had, the price has made a 14% correction. If the specified support is maintained, the price can see the specified targets. If the support is broken, the price can fall by another step. We have identified important support points for you.
*Trade safely with us*

#ETH/USDT Testing Wedge Breakout Amid Key Support#ETH
The price is moving within a descending channel on the 1-hour frame, adhering well to it, and is heading for a strong breakout and retest.
We have a bearish trend on the RSI indicator that is about to be broken and retested, which supports the upward move.
There is a major support area in green at 4480, which represents a strong support point.
For inquiries, please leave a comment.
We are in a consolidation trend above the 100 Moving Average.
Entry price: 4524
First target: 4585
Second target: 4645
Third target: 4715
Don't forget a simple matter: capital management.
When you reach the first target, save some money and then change your stop-loss order to an entry order.
For inquiries, please leave a comment.
Thank you.

ETH *UPDATE*Hello friends
Given the channel breakdown and the entry of buyers, it now seems that the price is in a pullback. In this case, the price pivots of the channel, which are now becoming supported, are expected to be good support and cause the price to grow and move with it to the specified targets.
*Trade safely with us*

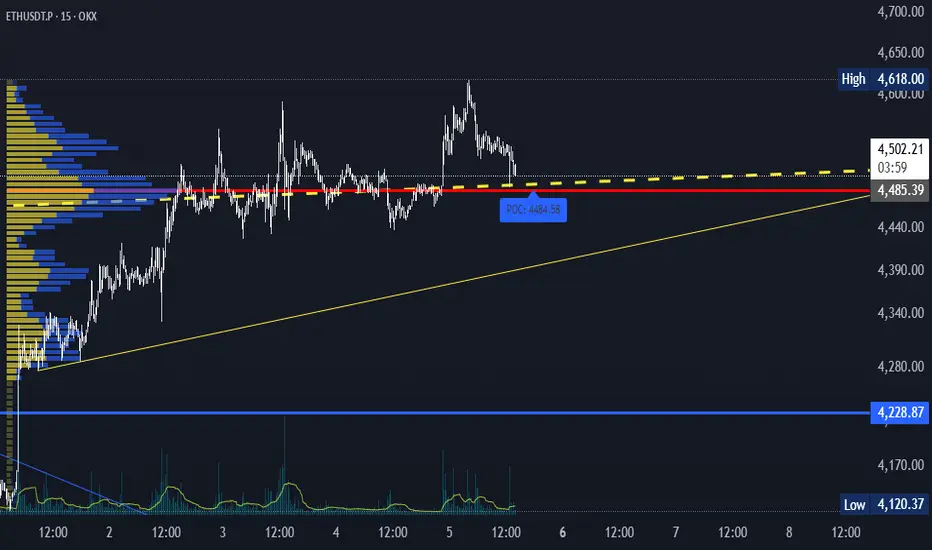
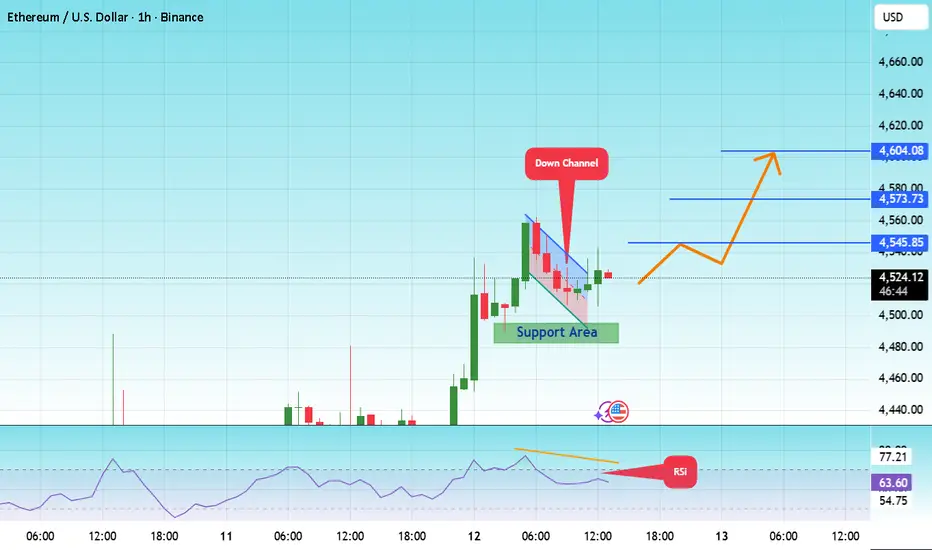
#ETH/USDT –> Falling Wedge Breakout Within Ascending Channel#ETH
The price is moving within a descending channel on the 1-hour frame and is expected to break and continue upward.
We have a trend to stabilize above the 100 moving average once again.
We have a downtrend on the RSI indicator that supports the upward move with a breakout.
We have a support area at the lower boundary of the channel at 4500, acting as strong support from which the price can rebound.
We have a major support area in green that pushed the price upward at 4485.
Entry price: 4525
First target: 4545
Second target: 4573
Third target: 4604
To manage risk, don't forget stop loss and capital management.
When you reach the first target, save some profits and then change your stop order to an entry order.
For inquiries, please comment.
Thank you.
ETH/USDT 15m – Breakout Above $4,600/- Whats Next For #ETH ?🚀 ETH just broke out of the $4,600 zone, holding strong above the EMA200.
Fresh Fair Value Gaps (FVG) and demand zones are supporting momentum, with bulls now eyeing $4,700–$4,800 next.
🔎 Market Structure
EMA200 trend remains bullish on 15m.
Breakout from the $4,520–$4,560 consolidation.
Liquidity above $4,600 cleared → momentum intact.
📍 Key Levels
Support 1: $4,535 (intraday demand / FVG retest)
Support 2: $4,480–$4,520 (previous base)
Deep Bullish FVG: $4,360–$4,400
Resistance 1: $4,700–$4,720
Resistance 2: $4,800–$4,850
📈 Trade Plan (FVG Strategy)
Entry Zone: $4,606 – $4,620
Stop Loss: $4,585
Targets:
TP1: $4,700
TP2: $4,760
TP3: $4,800+
✅ Outlook
As long as $4,535 holds, dips into FVG/demand zones remain buy opportunities.
A clean break above $4,700 could accelerate momentum to $4,800–$4,850.
⚠️ Breakdown below $4,535 would weaken structure and open downside to $4,480 / $4,360.
💡 Not financial advice. Educational purposes only. Manage risk carefully.
📢 What’s Your Take?
Do you think ETH can hold $4,535 support and push toward $4,800?
Drop your thoughts below & hit follow for daily crypto setups 🚀
🔖 Hashtags
#ETHUSDT #ETH #Ethereum #Crypto #Altcoins #15m #Scalping #DayTrading #SwingTrading #EMA200 #FVG #PriceAction #TechnicalAnalysis
ELong

ETH USD SELL NOW 4510ETHUSD SELL @ 4510
ETHUSD – Bearish Setup at 4510 | Reversal Play
Ethereum has reached a key resistance zone near 4510, where price action shows signs of exhaustion and rejection. Momentum indicators are flashing bearish divergence, and volume is fading—setting up a clean short opportunity.
📌 Trade Parameters
- Entry: 4510
- Stop Loss: 4550 (above resistance wick)
- Take Profit: 4400 (near support zone)
- Risk/Reward Ratio: ~2.75:1
📊 Technical Confluence
- Bearish divergence on RSI
- MACD histogram fading after bullish impulse
- Rejection from upper trendline
- Volume drop on bullish candles
- Lower high structure forming on 1H chart
💬 Trade Narrative
ETHUSD has rallied into a resistance zone but failed to break above 4510 with strength. This setup targets a retracement toward 4400, with tight risk above 4550. If price breaks below 4475, expect acceleration toward the target. Setup remains valid unless bulls reclaim 4550+ with volume.
This trade favors short-term tactical execution, especially with BTC showing signs of consolidation and broader crypto sentiment cooling off.
📣 Trader’s Note:
Watch for confirmation on lower timeframes (15M/1H). If price breaks below 4475 with momentum, consider trailing stop or scaling in.

Ethereum ETH Trade Setup: Resistance, Liquidity, and BoS Idea🟣 Ethereum (ETH) Update (further to my previous idea) 🟣
ETH is currently bullish 🟢📈 and pressing into a key resistance level ⚖️ where we see multiple relative equal highs 📍📍 forming consecutively. This is a major level 🔑.
Here’s what I’m watching:
1: The current pullback may give us a bullish BoS for an entry.
2: If price trades above this resistance 🚀, it will likely trigger buy stops 🎯, providing the liquidity 💧 needed for a potential pullback 🔽.
3: If price then breaks through decisively 💥, I’ll be looking for a retest + hold 🔄, followed by a bullish break of market structure (BOS) 🔓 as confirmation to get long 🟢.
⚠️ This is educational only, not financial advice. 📚

Ethereum ETH at Key Resistance: Equal Highs and Liquidity Play🟣 Ethereum (ETH) Update 🟣
ETH is currently bullish 🟢📈 and pressing into a key resistance level ⚖️ where we see multiple relative equal highs 📍📍 forming consecutively. This is a major level 🔑.
Here’s what I’m watching:
If price trades above this resistance 🚀, it will likely trigger buy stops 🎯, providing the liquidity 💧 needed for a potential pullback 🔽.
If price then breaks through decisively 💥, I’ll be looking for a retest + hold 🔄, followed by a bullish break of market structure (BOS) 🔓 as confirmation to get long 🟢.
⚠️ This is educational only, not financial advice. 📚

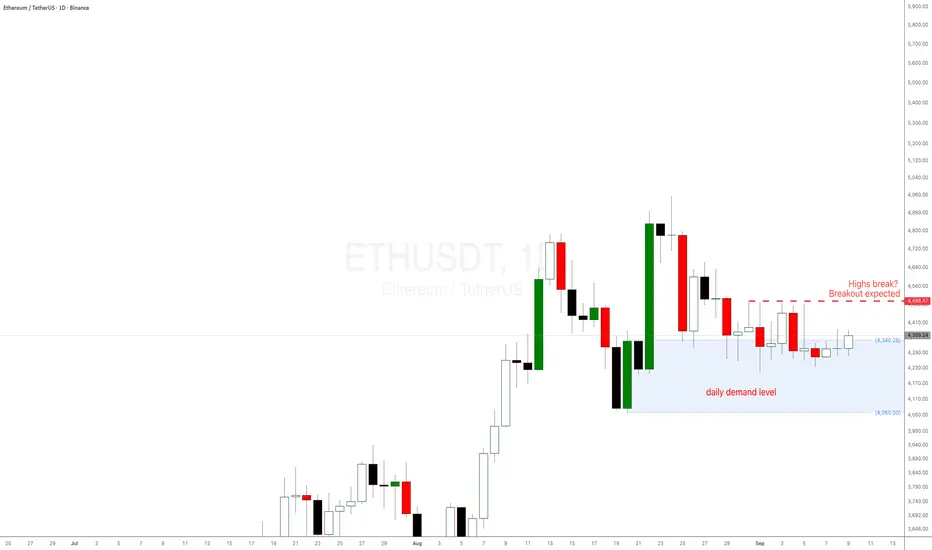
Ethereum ETH 2025 analysis and prediction daily demand levelEthereum ETH 2025 analysis and prediction as a reaction to the daily demand level at $4336. If the daily high in red is broken, a breakout is expected. ETH has been doing nothing for days, price action is not behaving as it usually does at these imbalances.
This is happening with Bitcoin BTC weekly demand level in control and playing out well. Refer to my BTC analysis in another trading idea.
#ETH/USDT towards upper levels#ETH
The price is moving within a descending channel on the 30-minute frame, adhering well to it, and is heading for a strong breakout and retest.
We have a bearish trend on the RSI indicator that is about to be broken and retested, which supports the upward move.
There is a major support area in green at 4255, which represents a strong support point.
For inquiries, please leave a comment.
We are in a consolidation trend above the 100 Moving Average.
Entry price: 4295
First target: 4326
Second target: 4367
Third target: 4417.83
Don't forget a simple matter: capital management.
When you reach the first target, save some money and then change your stop-loss order to an entry order.
For inquiries, please leave a comment.
Thank you.

We got the first profit! Next is 10k. Who's with me? ^_^
We got our perfect entry and reached our TP. Now that big institutions and whales are showing interest in BINANCE:ETHUSDT reaching 10k is more likely once the captial starts moving to ETH.
I too, with the experts have a similar view on ETH's future performance!
Not gonna list out things y'all already know. Feel free to drop your idea even if contradicting.
Good luck!
#BTC #ETH #bullrun #technicalanalysis #crypto #fundamentalanalysis #priceaction