Merry ETHmas, Everyone! - A Retrace to the Daily BOS ZoneMerry Christmas, everyone! On this 24th Day of ETHmas, my True Love gave to me...a signaled return to the Daily BOS Zone with a target of the H1 BOS Source.
If you have been following our ETH analyses for the last two months, you know this has been a seemingly wild ride with ETH...BUT, it has done almost EXACTLY what our analysis of the structure said it would do. Please see our previous posts for details on how we got here.
Where are we now?:
It's Christmas Eve and we have recently seen the H1 BOS Up out of this HUGE Daily Demand Zone. We have been waiting for this, and once we got it, the next target was a retracement back down to the H1 BOS Source. NOTE: We saw the price push up after the BOS Up, but it did not pass the retest rules, so there was no strength to keep moving.
What is next?:
Now that we have seen the rejection after the H1 BOS, it's simply retracing back down to this source area. So, once we get back into the Daily Demand Zone, the target is most likely this H1 BOS Source (2776 - 2811). At that point, we have a pretty strong area of support that should hold ETH...at least give us a consolidation period for the market to determine if it's ready for the strong move up. Keep in mind this is a Daily Demand Zone, so we could see a strong bullish response out or it could consolidate here for days.
Are there Trade Opportunities?:
For now, the possible trade opportunities are to short ETH back down to this H1 BOS Source. If you've been following our analysis, you would already be in that short after the H1 BOS Up.
Once we get to this source area, aggressive traders can take a long, with a stop loss below the Daily Demand Zone.
I pray you all have a MERRY CHRISTMAS! Please send me your comments and ideas, as I would love to hear what other traders are seeing and thinking!
Ethpriceanalysis

EthereumETHUSD
- Completed " 12345 " Impulsive Waves
- Break of Structure
- Bearish Channel as an corrective pattern in Short Time Frame
- Support Level
- Change of Characteristics

ETHUSD Weekend Bounce Setup (15m)Following a sharp liquidity sweep into lower intraday demand, ETH is now positioned for a potential weekend rebound. Price tapped into a cluster of overlapping demand levels between 3,045–3,067, an area that has historically produced strong reactive moves on lower timeframes.
Momentum is beginning to stabilize after the selloff, and the current structure favors a corrective bounce toward the nearest inefficiency and reclaimed levels above.
🔹 Entry: CMP
🔹 Target (TP): 3,230.40
🔹 Stop-Loss (SL): 3,045.89
This setup targets a short-term relief rally into the mid-range imbalance, with a clean 5% upside if weekend activity provides enough volatility. A break and hold above 3,180 would further validate the bounce, opening the door toward the white liquidity band overhead.
A decisive breakdown below 3,045 would invalidate the idea and signal continuation into the next demand block below 3,020.
As you can see there are plenty of targets bellow, be wise on risk management
⚠️ Financial Disclaimer (fun version):
Not financial advice. Just chart gymnastics. If you trade this with no stop-loss because “it’s the weekend,” ETH may personally teach you what volatility really means. DYOR and stay safe out there.

ETH | TRADE ANALYSIS📌 Trade Setup:
* Entry Level: 3,071
* Stop Loss: 3,026
* Target: 3,155
ETH is holding above an important intraday support zone, showing signs of renewed buyer interest. Momentum is gradually shifting upward, and if price sustains above the entry zone, a push toward the target area becomes likely. This setup focuses on short-term strength, with clear levels for controlled risk.
Disclaimer: This is not financial advice; it reflects only my personal market analysis. Please do your own research before trading.

ETHUSD TF15min – Technical Setup Update After a sharp pullback from the recent local high, ETH is stabilizing above short-term demand on the 15-minute chart. Price has begun to compress just beneath the mid-range, hinting at a potential rebound toward the upper liquidity bands if buyers step back in.
🔹 Entry: 3,130
🔹 Target (TP): 3,363.99
🔹 Stop-Loss (SL): 3,074.40
This setup presents a clean continuation-long opportunity, supported by confluence from prior reclaimed structure and unmitigated inefficiencies above. A push past the 3,325–3,330 pocket would likely trigger acceleration toward the target zone.
However, a decisive break below the red demand band would invalidate the bullish thesis and open the door to deeper retracement.
⚠️ Financial Disclaimer (the funny one):
This isn’t financial advice — it’s just chart scribbles on the internet. If you decide to trade using only vibes and screenshots, your balance may achieve price discovery… to the downside. Always DYOR and manage your risk like a civilized degen.

ETH Trade Plan (December 12, 2025)ETH Trade Plan (December 12, 2025)
(D1 / H4 / H1 / M15)
⬛️ 1. Higher Timeframe Context (D1 and H4)
• D1 bias: bullish
• D1 range (approx): $3,000 – $3,500
• Key D1 zones:
• Supply: $3,450–$3,500
• Demand: $3,000–$3,192
• H4 bias: buy dips
• H4 zones of interest:
• H4 Sell Zone 1: – previous highs
• H4 Buy Zone 1: – support cluster
Active setups trend-aligned.
⬛️ 2. Preferred Setups by Horizon
🔳 2.1 Swing Setup (D1/H4)
• Idea: Buy dips to $3,192 (trend-aligned).
• Time horizon: multi-day.
• Context: On-chain + macro.
🔲 2.2 Intraday Setup (H1 focus)
• Idea: Long above $3,250.
• Time horizon: intraday.
• Context: Impulse regime.
▫️ 2.3 Scalp Setup (M15 focus)
• Idea: Buy pullbacks with absorption.
• Time horizon: minutes–hours.
▪️ 2.4 Arbitrage/Pairs Concept
• None.
⬛️ 3. Entry Zones and Triggers
🟩 3.1 Long Setup (Trend-Aligned)
• Execution timeframe: H1
• Trigger timeframe: M15
• Entry zone:
• Context: H4 demand.
• Pattern tags:
Trigger conditions:
• Hold support + positive delta.
• ML-Predictive (15m): upside ≥ downside.
• Risk not extreme.
🔴 4. Stops (Invalidation Levels)
Long setups:
• Stop: $3,100.
• Logic: Demand break.
🟢 5. Targets
Long:
• TP1: $3,300 – H1 level.
• TP2: $3,450 – H4 supply.
• TP3 (optional): $3,500 – D1 objective.
⬛️ 6. Position Sizing
• Baseline risk:
• Trend-aligned: 1.0.
• Adjust: medium uncertainty (Fed).
Final: 0.7 for long.
⬛️ 7. Risk Flags
• Fed event.
• Put skew.
• Mixed flows.
⬛️ 8. Flip Conditions
• Long to bear: Below $3,192 + sell delta.
⬛️ 9. Alternative Scenario
Rejection at $3,450: short zone $3,400–$3,450, stop $3,500, targets $3,300/$3,192. Failed break vs continuation.
⬛️ 10. Model Self-Critique
• Assumptions: Rally on macro, no surprise.
• Vulnerabilities: Risk-off.
• Do not overleverage pre-event.
⬛️ 11. Uncertainty and Constraints
• Uncertainty.level: medium.
• Avoid leverage, require confirmation.

CATCH ON ETHERUM HIGH PROBABILITY LONG SETUP SOON!!!🚨ETHER HIGH PROBABILITY BUY SETUP 🚨
* Here We Can See Clearly The Next Potential Moves For ETCUSD Coming Hours/Days.
* Keep Your Eyes Close On Your Trading Positions.
* Happy PIP Hunting Traders.
FXKILLA.

EthereumETHUSD
- Completed " 12345 " Impulsive Waves and " AB " Corrective Waves
- Break of Structure
- Sell Side Liquidity
- Break of Structure
- Bullish Channel as an corrective pattern in Long Time Frame

ETH/USDT : LIVE TRADEHello friends
you can see that a spike has formed and then the price has ranged.
Now with a valid breakout from above and a breakout from below, buyers can push the price to the specified points.
This analysis is purely technical and is not a buy or sell recommendation. So please refrain from emotional behavior.
*Trade safely with us*

ETH Trade Plan (December 10, 2025)ETH Trade Plan (December 10, 2025)
(D1 / H4 / H1 / M15)
⬛️ 1. Higher Timeframe Context (D1 and H4)
• D1 bias: bullish
• D1 range (approx): $3,000 – $4,000
• Key D1 zones:
• Supply: $3,800–$4,000 (historical resistance)
• Demand: $3,000–$3,300
• H4 bias: buy dips
• H4 zones of interest:
• H4 Sell Zone 1: – highs cluster
• H4 Buy Zone 1: – OB + demand
Active setups are trend-aligned with D1/H4.
⬛️ 2. Preferred Setups by Horizon
🔳 2.1 Swing Setup (D1/H4)
• Idea: Buy dips to $3,300 for $4,000+ (trend-aligned).
• Time horizon: multi-day.
• Context: Macro risk-on + on-chain strength.
🔲 2.2 Intraday Setup (H1 focus)
• Idea: Long above $3,370.
• Time horizon: intraday.
• Context: H4 impulse + rally regime.
▫️ 2.3 Scalp Setup (M15 focus)
• Idea: Buy pullbacks to $3,350 with absorption.
• Time horizon: minutes–hours.
▪️ 2.4 Arbitrage/Pairs Concept (if relevant)
• Long ETH/BTC – outperforming bias.
⬛️ 3. Entry Zones and Triggers
🟩 3.1 Long Setup (Trend-Aligned)
• Execution timeframe: H1
• Trigger timeframe: M15
• Entry zone:
• Context: H4 demand, whale flows supportive.
• Pattern tags:
Trigger conditions:
• Reclaim above $3,370 with positive delta.
• ML-Predictive (15m): upside ≥ downside.
• No extreme risk flags.
🔴 4. Stops (Invalidation Levels)
Long setups:
• Stop: $3,300.
• Logic: Break of demand; idea wrong below.
🟢 5. Targets
Long:
• TP1: $3,500 – H1 extension.
• TP2: $3,800 – H4 supply.
• TP3 (optional): $4,000 – D1 objective.
⬛️ 6. Position Sizing
• Baseline risk:
• Trend-aligned setups: 1.0.
• Adjust: low uncertainty + high alignment.
Final: 1.0 for trend long.
⬛️ 7. Risk Flags
• Put skew volatility.
• Fed event risk.
• High OI crowding.
⬛️ 8. Flip Conditions
• Long to bear: Close below $3,300 + negative funding.
⬛️ 9. Alternative Scenario
Rejection at $3,800: double top, short zone $3,750–$3,800, stop $3,850, targets $3,500/$3,300. Differs as failed breakout vs continuation.
⬛️ 10. Model Self-Critique
• Assumptions: Rally sustains on macro, no Fed surprise.
• Vulnerabilities: Sudden risk-off, misinterpreted flows.
• Do not chase highs without confirmation.
⬛️ 11. Uncertainty and Constraints
• Uncertainty.level: low.

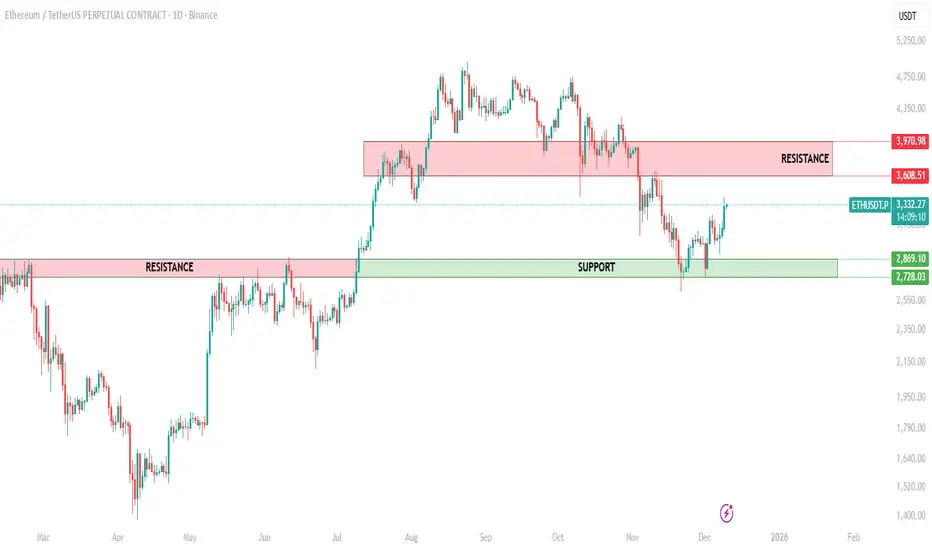
ETH Daily Chart UpdateEthereum has bounced strongly from the key support zone at 2728–2869 and is now pushing upward. This level has acted as a reliable demand area throughout the year, and the latest reaction confirms buyers are active again.
The next major hurdle is the resistance zone at 3608–3970. ETH will need a clean breakout above this range to open the door for a larger trend continuation.
For now, the structure remains intact:
• Support held perfectly
• Momentum shifting upward
• All eyes on the resistance above
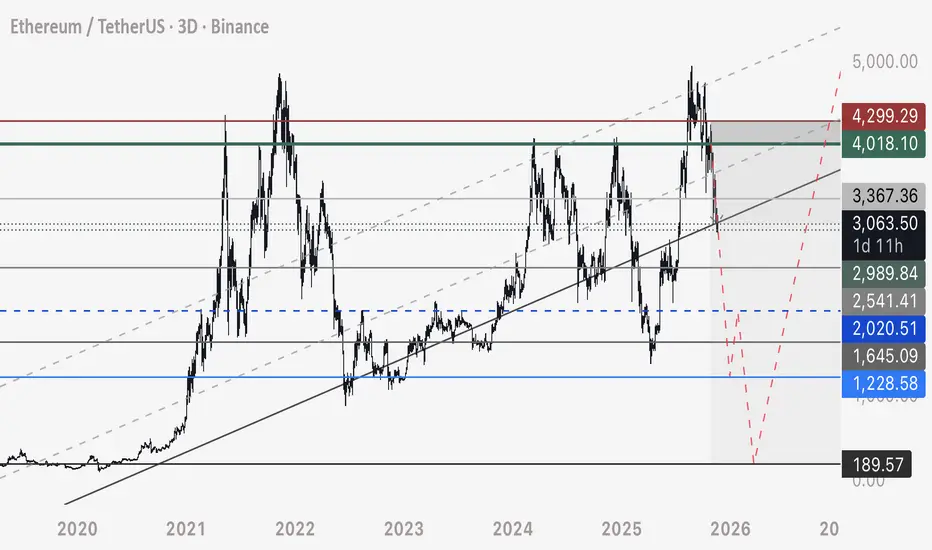
ETH: Upward!Ethereum has managed to rise towards the $3,100 level in recent hours. We still assign a 40% probability that, as part of blue wave alt.(b), ETH will move above resistance at $3,656 before selling off into our green Target Zone between $2,228 and $1,789. In our primary scenario, we also expect ETH to reach this zone—potentially without first exceeding the $3,656 level. In either case, once ETH enters the Target Zone, we anticipate a corrective rally, which should top out within the red Target Zone ($5,805 – $7,326) at the high of magenta wave (B).

ETHUSDT Trade Plan (December 8, 2025)ETH Trade Plan (December 8, 2025)
(D1 / H4 / H1 / M15)
⬛️ 1. Higher Timeframe Context (D1 and H4)
• D1 bias: neutral (bullish reversal attempt)
• D1 range (approx): $2,800 – $3,762
• Key D1 zones:
• Supply: $3,350–$3,762 (previous breakdown + OB cluster)
• Demand: $2,800–$3,050
• H4 bias: buy dips
• H4 zones of interest:
• H4 Sell Zone 1: – previous rejection cluster (decaying)
• H4 Buy Zone 1: – OB + HVN + weekend absorption
All active setups are trend-aligned with emerging H4/D1 bullish structure.
⬛️ 2. Preferred Setups by Horizon
🔳 2.1 Swing Setup (D1/H4)
• Idea: Long dips into $3,100–$3,150 for retest $3,500+ (post-Fusaka accumulation).
• Time horizon: multi-day.
🔲 2.2 Intraday Setup (H1 focus)
• Idea: Long reclaim/break $3,150–$3,190 zone.
• Time horizon: today / overnight.
▫️ 2.3 Scalp Setup (M15 focus)
• Idea: Dip-buy $3,100–$3,110 with absorption or breakout >$3,140.
• Time horizon: minutes–hours.
▪️ 2.4 Arbitrage/Pairs Concept
• Long ETH/BTC ratio – defending key support, mean-reversion bias up.
🟩 3. Entry Zones and Triggers
Main Long Setup (Trend-Aligned)
• Execution timeframe: H1
• Trigger timeframe: M15/M5
• Entry zone:
• Context: H4 demand + weekend sweep reclaim + institutional spot buying
• Pattern tags:
Trigger conditions:
• Price holds $3,100 bid cluster + M15 bullish structure (higher low + volume delta buy)
• CVD positive or diverging bullish
• ML-Predictive 15m upside prob ≥0.65
• No aggressive ask walls rebuilding
🔴 4. Stops (Invalidation Levels)
Long setups:
• Stop: $3,045 (below weekend low + H4 demand)
• Logic: Structural failure, CHoCH down confirmed.
🟢 5. Targets
Long:
• TP1: $3,190 – local supply + FVG fill (H1/H4)
• TP2: $3,350 – supply retest + LVN void (H4/D1)
• TP3 (swing): $3,600+ – next HVN + extension (D1)
⬛️ 6. Position Sizing
• Baseline risk trend-aligned: 1.0%
• Adjustments: −0.2× (put skew + weekend tail) +0.1× (strong absorption + news)
• Effective risk: 0.9% main long, max 0.4% aggressive scalps
⬛️ 7. Risk Flags
• Persistent put skew → vol expansion downside risk
• Weekend liquidity memory (potential gap lower Asia)
• High OI + neutral funding → crowded long risk if macro flips
• Death cross D1 still active (macro timeframe bearish pressure)
⬛️ 8. Flip Conditions
Bull → bear flip: H4 close < $3,050 + CVD strongly negative + funding negative.
⬛️ 9. Alternative Scenario
Fakeout above $3,190 → sharp rejection (spoofing + gamma) → trap longs → drop to $2,950–$3,000 (next demand + round number). Requires delta selling + macro risk-off trigger.
⬛️ 10. Model Self-Critique
• Main assumptions: Fusaka narrative sustains buying, institutional accumulation continues, no macro shock.
• Vulnerabilities: put skew buyers re-assert, whale distribution at supply, weekend gap lower, misread absorption.
• Do NOT chase extended above $3,200 without volume. Do NOT hold through Asia low liquidity without tight stops.
⬛️ 11. Uncertainty and Constraints
Uncertainty: medium
Constraints: require M15 confirmation + positive delta, no entries above $3,200, reduce size into NY close if no volume.

Ethereum crypto strong demand at $2,880 playing outEthereum tapped a major demand zone at $2,880, and the reaction is clear: buyers stepped in, just like they usually do when a clean, fresh imbalance takes control. The last time ETH reacted to a similar structure on the bigger timeframes, we saw extended bullish legs unfolding week after week.
Right now, the question is simple:
Will this demand level hold long enough to push ETH toward $4,120 and beyond?
Based on the current imbalance structure, the answer leans strongly toward yes.

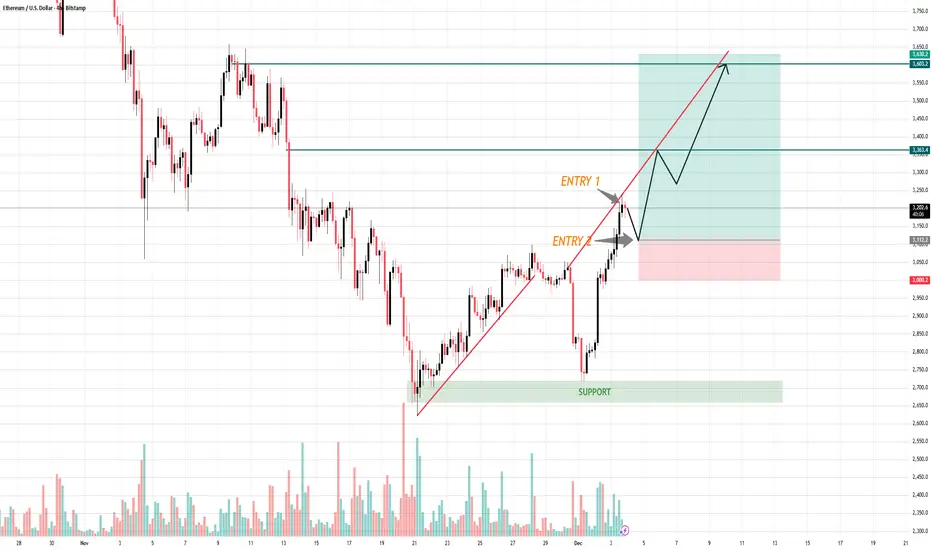
Traders Chase Breakouts. The Profitable Ones Wait for the Retest📈 ETH/USD — 4H MARKET OUTLOOK
- ETH has broken out of its short-term rising structure and is now pulling back into a high-probability retest zone, creating a clean bullish continuation setup. Market structure has shifted from bearish to bullish with higher highs, higher lows, and strong volume support.
- Your chart shows two potential long entries both valid depending on the aggressiveness of the trader.
1️⃣ Break of Structure + Trendline Retest
ETH successfully broke above the rising trendline and is now forming a corrective pullback.
This is exactly what we want to see before entering a continuation move.
- Impulse up = strong, clean candles
- Pullback = controlled, low volatility
- Trendline retest = confirmation of demand
This is textbook bullish market behavior.
2️⃣ Entry Zones
🔶 ENTRY 1 (Aggressive Entry)
- Positioned right at the trendline retest
- For traders who want early entry with more risk
- Expect volatility but strong R:R if the bounce holds
🔷 ENTRY 2
- Wait for price to retrace deeper into minor structure support
- Higher confirmation, lower risk
- Ideal for swing traders
Both entries target the same bullish continuation structure.
3️⃣ Target Zone
Your take-profit zone is correctly placed at $3,600–$3,650, aligned with:
- Previous major supply zone
- Strong historical rejection area
- Completion of the next liquidity sweep
If ETH maintains structure, this zone will be tested.
4️⃣ Stop-Loss Placement
A stop below $3,060 – $3,100 is ideal because:
- It sits under the retest zone
- Below previous higher low
- Below liquidity pockets that market makers typically manipulate
If this level breaks, bullish structure collapses so the SL is perfect.
➡️ Primary Scenario
ETH pulls back → creates a higher low → bounces from Entry 1 or Entry 2 → continuation into $3,600+.
Market structure is bullish and favors long setups.
⚠️ Risk Scenario
If price breaks and closes below $3,060, the bullish setup fails and ETH may revisit the major support zone near $2,750 – $2,800.
Your edge isn’t in predicting the market — it’s in being patient enough to wait for the setup that others ignore.
ETHUSD 1H — Short Opportunity After Channel BreakCOINBASE:ETHUSD
Price is trading inside a broad descending structure, and the recent move appears corrective, forming a rising channel. This type of structure often represents distribution before continuation lower.
A sweep into the 3,250–3,320 supply zone aligns with previous imbalance and trendline rejection. If the price rejects this zone with momentum, the bearish continuation setup becomes valid.
Key Scenarios
❌ Bearish Case (Primary Setup) 📉
Ideal Entry: 3,250–3,320 Zone (Supply)
→ 🎯 Target: 2,700–2,650 (Liquidity Sweep + Demand Zone)
→ 🛑 Stop Loss: Above 3,380
Confirmation triggers:
• Break of rising channel
• Bearish engulfing candle
• Wick rejection into the zone
Levels to Watch
Type Price
Short Entry 📍 3,250–3,320
Target 🎯 2,650–2,700
Stoploss ❌ 3,380
Invalid if Broken Trendline + Structure Flip
⚠️ This analysis is for educational purposes only — not investment advice.

ETH idea 12.11.2025On this market, I see the potential of the two closest scenarios, on the one hand, a short at the level of 3900-4000, where I would like to see the sfp above the previous high, and then a long one, which I would like when it falls below the wall at the price of 3180

ETHUSD: Outlook for the Upcoming DaysMonthly View:
The monthly timeframe remains bullish overall, but ETH has pulled back to gather strength. This kind of move is typical when the market is gearing up to break a higher high. The broader structure hasn’t shifted—this is simply a deeper retracement inside a bullish narrative.
Weekly View:
The weekly chart is showing a similar story. Price has been dropping consistently without giving even a single proper reversal. If ETH truly wanted to fall aggressively, it would normally make a move up first, trigger traders’ stop-losses near previous highs, and then dump. But this time, it didn’t do that.
This unusual behavior hints that the market may be preparing something different from what most traders expect.
Daily View:
The daily timeframe is where things get really interesting. ETH spent more than half the recent sessions moving sideways, collecting liquidity on both sides. After that, it dipped and formed a lower high—but that lower high hasn’t been broken yet.
According to my analysis, ETH is currently sitting in the Discount Zone, an area where buyers often start becoming active.
4-Hour View:
On the 4H chart, I already had a clean short setup earlier, but now I’m watching for signs of a potential reversal. That reversal idea is not guaranteed, though—it becomes invalid if ETH fails to break the series of lower highs.
There’s also another scenario: ETH might refuse to break the lower highs and begin forming higher lows at the same time. If that happens, we’ll see a period of sideways consolidation. When the breakout finally comes—whichever direction it chooses—the move is likely to be powerful.
Final Thoughts:
Based on my analysis, ETH is showing mixed but promising signals across the higher and lower timeframes. The monthly structure is still bullish, and this pullback looks more like preparation for a stronger push rather than a trend reversal. Weekly price action hasn’t shown any meaningful bounce yet, which is unusual—and that alone hints that the market might be setting up something unexpected.
On the daily chart, ETH has swept liquidity after moving sideways for quite a while, and now it’s resting in the Discount Zone, where smart money usually becomes active. The 4H timeframe already gave clean short opportunities earlier, but now the market is approaching a point where a reversal could begin—unless lower highs remain untouched.
If ETH starts forming higher lows without breaking lower highs, the market will likely slip into a compression phase. When price finally breaks out of that squeeze, the move—up or down—can be very strong.
Again, this is just my personal viewpoint. Please do your own analysis before investing. Your profits and losses are entirely your responsibility—I’m only sharing what the charts are suggesting to me right now. Stay alert to the reaction levels ahead; that’s where the next major direction will reveal itself.
----------------------------------------------------------------------------------------------
Thanks for checking out this analysis! If you enjoyed it, hit that follow button so you don’t miss future updates. And if this breakdown helped you out, drop a like 👍 and share your thoughts in the comments 💬—I always appreciate the feedback!

ETH - Short Update - Next Expected Moves ETH has been playing out this short beautifully since the high entry at 4,018.
Here are the next expected movements to complete this short, shown with solid blue lines and the red corrective path.
SHORT - 3,070 to target of 1,250
LONG - 1,225 to 1,250 entry - target of 2,000
SHORT - 2,000 to 2,020 entry - target of 200
BUY - 200-300
Expect this move to happen very quickly, and best to plan ahead.
Happy trading,
- DD
$ETH following my macro planCRYPTOCAP:ETH is following my macro plan. I shorted it on the retest with a stoploss slightly above the highest wick of previous week. This was a simple 13% so far. This is why I like high time frame trading it shows you more than just noise on short timeframe charts.
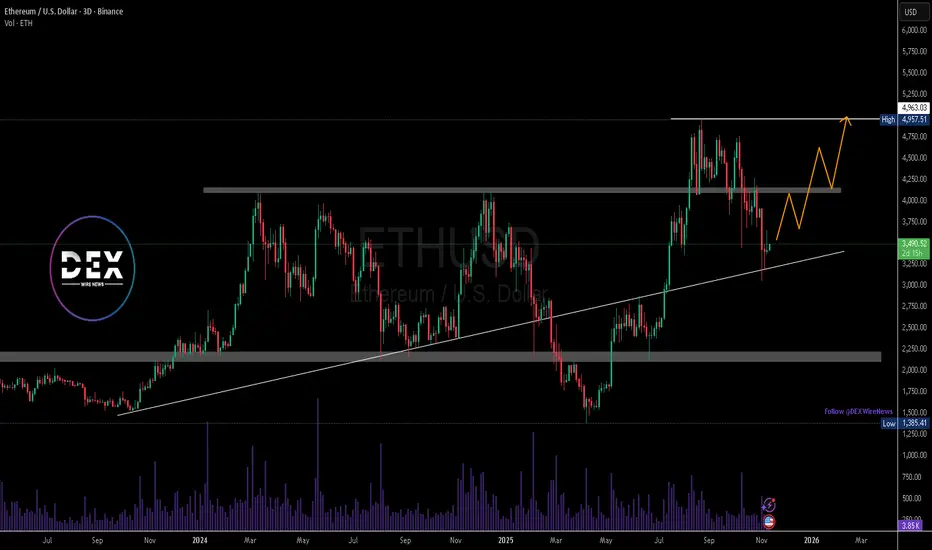
Ethereum Eyes $5K on Rate Cuts Hopes & U.S. Shutdown ResolutionEthereum (ETH/USD) continues to show resilience as macroeconomic conditions begin to favor risk assets. With the U.S. Federal Reserve expected to cut interest rates by 25–50 basis points in December, investors are gradually rotating back into crypto, anticipating improved liquidity and higher capital inflows. Lower interest rates typically weaken the dollar and boost speculative assets like ETH and BTC, making this a potential catalyst for Ethereum’s next bullish leg.
Additionally, progress toward resolving the U.S. government shutdown, which has lingered for weeks, is helping stabilize investor sentiment. Once uncertainty around fiscal operations fades, institutional activity is expected to pick up across both traditional and digital markets — further supporting Ethereum’s recovery momentum.
On-chain fundamentals remain strong. Ethereum’s staking deposits continue to rise, now exceeding 33 million ETH locked in validator contracts. This sustained demand reduces circulating supply and underpins long-term price stability. Meanwhile, the Ethereum network maintains its dominance in decentralized finance (DeFi), non-fungible tokens (NFTs), and Layer-2 scaling activity, positioning it as the backbone of Web3 infrastructure even amid increasing competition.
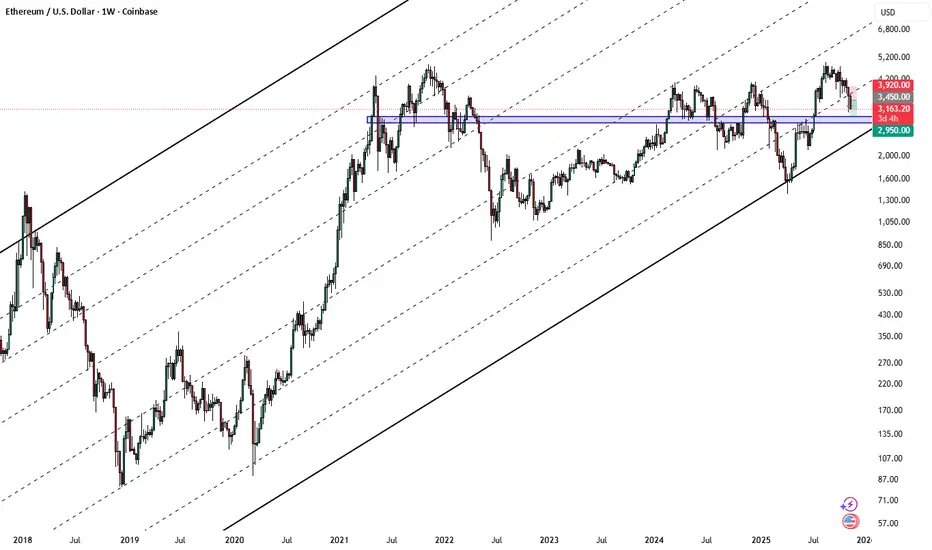
Technically, ETH/USD has bounced from the $3,200 support zone, aligning with a long-term ascending trendline. The chart shows potential for a sustained push toward the $4,150 resistance before retesting and targeting the $5,000 high. A clear daily close above this level would confirm a continuation of the larger bullish structure and could open the door to new all-time highs in 2026 if macro tailwinds persist.
Overall, Ethereum’s fundamentals and technicals are converging at a favorable point, and with rate cuts on the horizon and fiscal fears fading, ETH may be preparing for a powerful rally into Q1 2026.
ETH/USD Bearish trend analysis Read The captionSMC Trading point update
Technical analysis of (ETH/USD) on the 4-hour timeframe — aclassic retracement and continuation setup. Here's the breakdown:
---
1. Market Structure
ETH is currently in a clear downtrend — forming lower highs and lower lows.
The overall direction remains bearish, confirmed by price trading below the 50 EMA and 200 EMA.
Both EMAs are also sloping downward, reinforcing bearish momentum.
---
2. Correction Phase
After a sharp drop, ETH formed a falling wedge (a short-term corrective pattern).
It has broken out upward from that wedge — typically signaling a temporary retracement (pullback before continuation).
---
3. Key Zone (Supply / Rejection Area)
The blue box marks the supply zone or Fibonacci retracement area (0.62–0.79).
This zone also overlaps with the EMA 50 and EMA 200, creating strong confluence resistance.
The red arrow points to where a potential bearish reaction is expected — around $3,550–$3,700.
---
4. Expected Scenario
ETH may continue slightly higher to retest the Fibonacci 0.705–0.79 region.
Then a reversal (sell setup) is expected, leading to another leg down following the prevailing trend.
The target point for this bearish move is around $2,997, aligning with a previous liquidity and support zone.
---
5. Summary
Trend: Bearish
Bias: Short-term retracement → continuation lower
Key Resistance (Sell Zone): $3,550 – $3,700
Target: $2,997
Invalidation: Break and close above $3,863 (200 EMA + previous high)
Mr SMC Trading point
---
Trading Idea Summary:
“ETH remains in a downtrend. After a wedge breakout, a retracement toward the 3.55K–3.7K supply zone is likely before the next bearish continuation toward 3K. Sellers should look for confirmation signals near the resistance area.”
---
please support boost 🚀 this analysis

ETH-----Sell around 3475, target 3408 areaETH Contract Technical Analysis (November 6th):
On the daily chart, yesterday's close was a small positive candle, with a pattern of consecutive negative candles followed by a single positive candle. The price is below the moving average, and the accompanying indicators are in a death cross, indicating a clear downtrend. Yesterday's rebound was a correction after a significant drop, with the price correcting back to the moving average and facing secondary downward pressure – a common and predictable pattern. On the hourly chart, the rebound after the decline lacks strength and continuity, making it unlikely to establish a short-term trend. Therefore, intraday trading is expected to be range-bound, with the European session likely to see further downward pressure.
Today's ETH Short-Term Contract Trading Strategy:
Sell at 3475, stop-loss at 3510, target 3408.
