ETHmas Tree...Oh, ETHmas Tree...Thy Candles are so Falling!!!What in the World is going on with ETH, you say??? Well, this is following our market structure almost to a T. See my previous posts on ETH to see how we got here and why the market is moving the way it is. This is Structural Market Making Moves, and has absolutely nothing to do with the News, Tariffs, Fed Reports, etc.
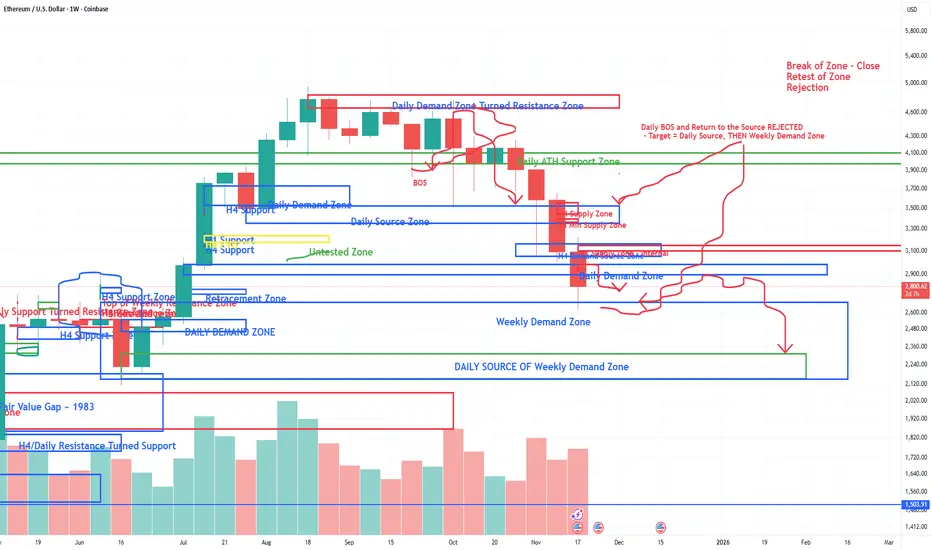
What just happened:
In the last look, we had an H1 BOS up that led us all the way back up to this H4 Supply Zone. Over the Thanksgiving Holiday and long weekend, the market tried to push up and break out of this zone. BUT...it is an H4 Supply zone, and as mentioned previously, there are a LOT of sellers waiting to sell their ETH here. After failing to overcome those sellers, we have seen the huge rejection expected.
What is significant about this move:
It is VERY important to note now that during all of this up and down over the weekend, and the ultimate failure to break any higher, we have gotten an H4 BOS Up from the lows....This H4 Supply Zone was broken with a closed H4 Candle. So, at this point we are looking for the market to push back down to the Source of that H4 BOS ~ (2680 - 2750). So, this huge fall we've just seen should take us back down to that area to retest and see IF the overall Fall from All Time Highs is finally over.
What to look for:
From here, we need to watch as we approach this H4 BOS Source and look for signs on the 15 min that the drop will end there. The H4 BOS could hold, but there is still the prevailing Weekly Demand Zone (~2150 - 2670) that is what is overall pulling the price down. So, this H4 BOS zone is the first attempt to see if the Weekly Zone is satisfied.
If this H4 BOS Zone holds and we do not get an H4 close below it, ETH could finally start to regain strength. Otherwise, if this H4 BOS Zone gets broken with an H4 close, then the weekly takes over again, and we're back to looking at the Weekly View. The Daily Source of that large weekly zone is still the target (~2150-2300).
Ethpump

ETH Reversal??? Is it Finally Here???So, ETH has been pushing up quite a bit now these last couple of days, but is this a real pump back up, or is it a TRAP? I'll let you decide. Here's what I see....
As posted previously, we have seen an H1 BOS out of the HUGE Weekly Demand Zone. In fact, it came out of the Daily Source of that Weekly Zone, so this push back up is definitely expected. We have fallen so much and fell down to near the bottom of the Weekly Demand Zone.
So, this H1 BOS will nearly always lead to a pullback to the H1 Source of that break, or to the H4 Supply Zone. This is playing out perfectly. We have just pulled back to this H4 supply Zone.
So....This is the area to look for any confirmation that the overall sell will continue. This H4 Supply Zone is full of sellers waiting to dump ETH, and it needs to be tested.
What to look for here:
Inside of this H4 Supply Zone, we need to see a 15 Min BOS down to signal that this whole move was a huge fakeout to trap buyers. IF we see that, look for another fake-out return to the source of that break for the Fall of Falls.
What if it doesn't Stop:
We are ALWAYS Reading the market, not predicting it. So, if this move up is to continue, we must see a clear break of that H4 Supply Zone. An H4 Candle needs to close above that zone and give us a retest, with a bullish rejection. IF that happens, ETH can keep pushing up to the next target - the H1 Supply Source (3170 - 3200).
This is just clear, technical trading, folks, and if you've been following, the market has done almost exactly what it has TOLD us it would do.

Is the ETH Problem Solved Yet????ETH has traded exactly as expected from this last recent high and break down of structure that followed. Please see my last analysis on ETH from 11/11/25. We have dropped down into this Weekly Demand Zone (2150 - 2680), and are now seeing a bullish response out of it as expected. This response is most likely to pull back up to retest the previous Daily Demand Zone (2900 - 2980) and get Rejected.
The most likely targe of this fall is still to continue to the Daily Source inside of this weekly zone. The problem is that this Weekly Demand Zone was very large, leaving a wide range of buyers in this area. The most concentrated demand will be inside of the Daily Source (2150 - 2314).
This is just the market being the market and following a solid technical analysis structure.
What to look for Next?:
Keep in mind that the overall market is STILL BULLISH. This so called "collapse of the market, flash crash, crypto winter", etc. is only because we extended way too far from the last Weekly Demand Zone. The price of ETH and BTC pushed too far, too fast, and we are only returning to normal market structure. There HAS to be this kind of correction in the market in order to move forward.
So, to resume the bullish case for ETH right now, all we need to see a clear Break of Structure out of this large Weekly Demand Zone on the H4 Time frame. The H4 will be the tell tell sign that the decline is ending. That is most likely to happen within the Daily Source Zone highlighted (2150 - 2314). We need to see a clear H4 Break of the last supply zone and a retest to get out of this 2700 price range area and continue with the overall still bullish trend.
Don't be fooled by these bullish responses right now - we are not ready to go bullish again until we see what I described above. Every other bullish pump right now is a trap, and should be traded accordingly.
Ethereum - PoS dump is not a hindrance! Watching BitcoinSubscribe and get a free trading strategy for Bitcoin and Ethereum every day!
Ethereum looks stronger against the background of bitcoin, as its dominance tells us, it is bought back more aggressively against the background of the transition to PoS.
But I remember very well how in 2019 Bitcoin cash split into two networks CASH and SV, after a short period of time (almost immediately) there was a huge ladies of the market!
Therefore, news and technology are good, but the market goes for liquidity. and so 2 scenarios Bullish and Bearish!
Therefore, technology is not a reason to sell Buterin immature technologies.
Bullish
Ethereum needs to consolidate above the level of 1650-1675 and trade there to go higher, or make a movement with consolidation at the level of 1675. Before 1800, Ether looks SHORT (globally), fixing at 1800 will open us a more global long
Short
Locally, the Ethereum short looks like this, fixing below $1,500 and trading at this level with a weak buyer will lead us to the level of 1425, if we break through it, we fix under it and go to close the ETH CME gap to the $1,300 area.
Powell is coming soon, be careful. Remember Trading is about waiting. Good luck.

Ethereum bullish setup ! Pump incoming when everyone is bearishHi lads. I have been bearish on eth from late march 2022 until early june. And we saw mega bearish movr too.
ETH is in a consolidation area now. things are getting more clear that we will go higher from current levels. 1435 - 1520 levels are best buy opportunity. I expect that eth will rise to 2300 or 2400 levels before any new lower low happens.
So, right now majority of the retail traders think eth and btc will hit new lower low. In 100% of these situations, big market makers and players will go exactly the opposite way of the majority. because they dont want to give you a very clear and easy chance to buy the dip.
Also a lot of people are short on eth now so whales will definitely hunt those positions.
overall, I EXPECT A JUMP FROM HERE TO 2400 LEVELS WITHIN A FEW MONTH. AND THEN WE MIGHT FACE AND TARGET FOR A NEW LOWER LOW, WHERE BTC CPULD REACH 14K AND ETH TO 1K LEVELS.
ALSO A FOLLOW IS VERY APPRECIATED.
GOOD LUCK MY FRIENDS.

We Called The ETH Pump!Our RSVP Extractor and Wave Strength Oscillator called these pumps perfectly! We also had a 3D ETH bullish divergence that we posted about a couple weeks ago which played out to a tee! Now I've broken down a Daily ETH chart to share my thoughts on some big support/resistance points to look out for!
1. We have a Daily trend line (red) that has been resistance since Nov 10, 2021 and coincides with the 2325 level
2. There's also major resistance at the 2125 level which coincides with the Daily 200 EMA (teal line) and the horizontal resistance from May this year (pink line)
3. The RSVP Extractor is starting to get overbought so keep watching that for any sell indications (along with the Wave Strength Oscillator)
Since both indicators don't have any strong sell signals yet, I'm expecting a continued push up until the merge to the 2300ish level. If we do pullback from here, there's some good support at 1930 and 1730 respectively.
Please make sure to only trade with what you can afford to lose. This market is extremely volatile and you never want to be caught on the wrong side.
If you have any questions about my TA or the indicators used, please leave a comment below or send me a DM. All of my links are next to my profile pic :)

Ethereum roadmap was staring at us all this timeWhat is it we value? Innovation. Originality. Novelty. But most importantly timeliness. I fear you may be too late, my confused, unfortunate friend.

ETH is ready to Fly ( NEW ATH SOON)ETH has a strong hourly support and main daily support, it is moving towards ATH resistance zone! we already entered long in 3600-3800 Zone yesterday. Now it is moving up, If it will break ATH! Then we can expect huge upward rally in ETH


ETH BIG OPPORTUNITY, BUY THE DIP.Ethereum is testing the breakout from ATH, sell here is like selling Bitcoin after 20k break months ago.
This is going over $2000 USD very soon, meantime bitcoin creating a accumulation range at ATH.
I bought the dip!
indicator say buy, history has a great win rate.
Enjoy.

ETHEREUM USDTGood morning,
today I have a good hand kkkk, follow the idea of today's market movement, good news coming out every day about the ethereum, today would be the expected day of the new historic top, or it will just be another attempt with maxims close to 1862 ~ 1882. ???
not a financial advice.
BINANCE:ETHUSDT

ETHEREUM ETH/BTCWAITING FOR THE BITCOIN TO STABILIZE IN THE 45 ~ 47k TRACK.
then the swap happened again, will huge massive.
BINANCE:ETHBTC

