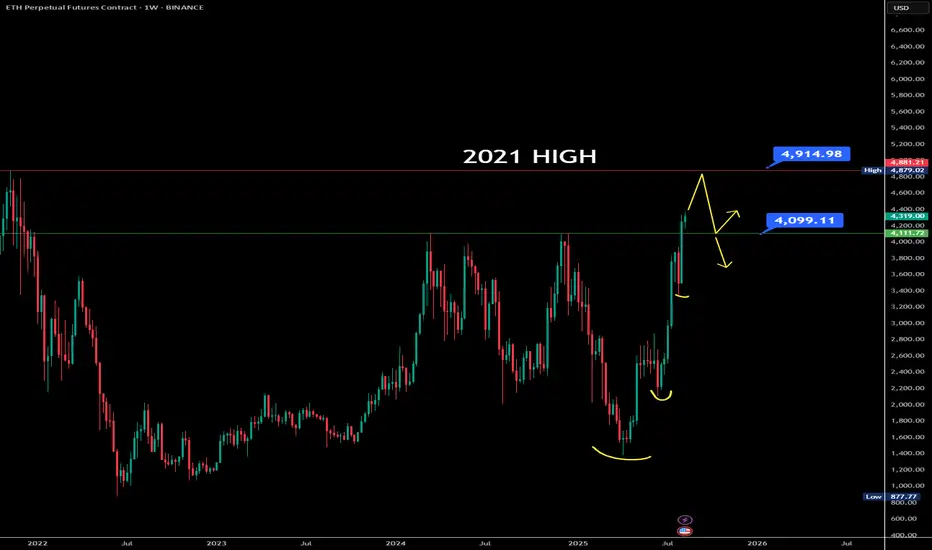
$ETH breakout leading to test 5000$Over the past three months, Ethereum has been consistently forming higher lows, starting from the ~$1,362 level, showing a strong and sustained uptrend. Recently, ETH decisively broke above the $4,100 resistance zone, which had previously rejected price action three times.
With this breakout, I’m not expecting an immediate retest of $4,100. Instead, price may continue its rally toward the 2021 all-time high near $4,900. Only after testing that level could we see a pullback to retest the $4,100 zone or even fill the small gap near $4,050.
On the fundamentals side, ETH ETF inflows remain positive on a daily basis, signaling strong institutional demand. Combined with increased whale accumulation, buying pressure continues to dominate.
Earlier, I considered this area for a potential short, but the price action and on-chain data now clearly indicate this is not a shorting opportunity—momentum remains bullish.
Ethreum
Ethereum Flips MasterCard: Is $5,000 ETH Next?A new era is dawning for Ethereum, the world's second-largest cryptocurrency. In a stunning display of market strength, Ethereum has not only surpassed the market capitalization of financial giant Mastercard but is also setting its sights on the ambitious $5,000 price target. This powerful rally, which saw Ethereum gain an impressive 45% in a single month, is fueled by a potent combination of surging institutional investment, increasing regulatory clarity, and significant buying pressure from large-scale investors, colloquially known as "whales." However, this bullish narrative is not without its counterpoints, as short-term leverage risks and a sense of caution in the options market present potential hurdles on the path to new all-time highs.
A New King in the Asset Rankings: Ethereum Flips Mastercard
In a landmark moment for the cryptocurrency space, Ethereum's market capitalization soared to over $519 billion in August 2025, eclipsing that of the global payments behemoth, Mastercard. This achievement propelled Ethereum to the 22nd spot among the world's largest assets, placing it ahead of household names like Netflix, Exxon Mobil, Costco, and Johnson & Johnson. The surge was the result of a consistent upward trend, with Ethereum's price climbing nearly 7% in a single day to hit $4,300, capping a 21% rise over several weeks.
This "flippening" of a traditional financial institution has ignited fresh debate about the long-term potential of decentralized assets. The 24/7 nature of cryptocurrency markets provides a distinct advantage, allowing for continuous trading and accumulation of buying momentum, even when traditional stock markets are closed. While Bitcoin still holds a commanding lead with a market capitalization of $2.36 trillion, Ethereum's consistent gains since July 2025 have kept the conversation alive about its potential to one day challenge the top spot.
The Road to $5,000: A Rally Fueled by Whales and Regulatory Tailwinds
The drive towards the psychologically significant $5,000 mark is being underpinned by several powerful forces. A staggering 45% monthly gain has brought this target within reach, with analysts pointing to a confluence of bullish factors.
One of the primary drivers is the unprecedented level of accumulation by "whales." In a single week, these large-scale investors accumulated an astounding $946.6 million worth of Ethereum. This aggressive buying is not limited to individual investors. A mysterious institution was reported to have acquired 221,166 ETH, worth nearly $1 billion, in a single week, signaling strong long-term confidence even at elevated prices. This whale activity is significant as it reduces the available supply of ETH on exchanges, creating a supply squeeze that can amplify price movements.
Adding to this momentum is the growing clarity in the regulatory landscape, particularly in the United States. Recent developments, including the White House's new digital asset framework and a resolution in the Ripple-SEC case, have helped to remove key uncertainties that have long plagued the crypto market. This improved regulatory environment is fostering greater trust and encouraging institutional adoption. The introduction of tax-advantaged structures, such as IRS Code 351, which allows for tax-free exchanges of Ethereum for treasury shares, is further incentivizing large-scale purchases by long-term holders.
The Rise of Corporate Ethereum and ETF Inflows
A significant and growing trend is the increasing allocation of corporate treasuries to Ethereum. As of August 2025, corporate Ether holdings have surged to an impressive $13 billion, with the total amount held by companies reaching 3.04 million ETH. This rally in corporate adoption is being led by firms like BitMine Immersion Technologies, SharpLink Gaming, and The Ether Machine.
BitMine Immersion Technologies, in particular, has made headlines by becoming the first company to hold more than $3 billion in ETH, having increased its holdings by a staggering 410.68% in just 30 days to 833,100 ETH. SharpLink Gaming and The Ether Machine have also significantly boosted their ETH treasuries, with the top ten corporate holders now controlling over 2.63 million ETH, representing about 2.63% of the asset's total supply.
This corporate buying spree is mirrored by the substantial inflows into spot Ethereum Exchange-Traded Funds (ETFs). In a single day, ETH ETFs saw inflows of $533.8 million, with cumulative inflows since July 2024 topping $8.9 billion. These sustained ETF inflows, coupled with the growth of corporate reserves, are seen as a powerful combination that could position ETH to outperform and challenge the $5,000 level for the first time.
A Time to Sell? Market Cycles and Exit Strategies
While the current sentiment is overwhelmingly bullish, some analysts are sounding a note of caution, suggesting that the current rally may have an expiration date. Drawing on well-known market cycle cheat sheets, some traders are pointing to the current phase as one of "Optimism" and "Ethereum dominance," which they believe will eventually lead to a "Market Peak/Euphoria" phase.
According to one such analysis by a crypto trader, this peak could be reached by the end of October 2025, at which point the market may experience extreme overvaluation and a subsequent downturn. This perspective suggests that while there may still be room for significant upside, with short-term targets ranging from $5,800 to $6,000, a strategic exit plan is crucial. This view is not universally held, with other technical analyses projecting targets as high as $12,000 based on patterns similar to Bitcoin's 2020 rally.
The Clash of Fundamentals and Short-Term Risks
Despite the strong bullish fundamentals, there are short-term risks that could temper the rally. One of the primary concerns is the high level of leverage in the market. The all-exchange Estimated Leverage Ratio (ELR) has climbed to 0.68, approaching historical highs and signaling excessive speculative activity. While this indicates a high degree of confidence, it also increases the risk of cascading liquidations in the event of a price correction.
The Ethereum options market also reflects a degree of caution. Despite the 41% rally in a month, derivatives data shows that traders have yet to turn decisively bullish. The options delta skew, a measure of the relative demand for bullish versus bearish options, remains in neutral territory. This suggests that while professional traders are not anticipating a significant price drop, they are also not exhibiting the "euphoria" that often accompanies major market tops. This lack of euphoria in the options market could be interpreted in two ways: either as a sign of a healthy, sustainable rally or as an indication that there isn't enough conviction to push the price significantly higher in the immediate future.
Conclusion: A Bullish Trajectory Tempered by Prudence
Ethereum's recent performance has been nothing short of remarkable. The cryptocurrency has not only achieved a significant milestone by surpassing Mastercard in market capitalization but has also laid a strong foundation for a potential run to $5,000 and beyond. The confluence of strong institutional demand, growing corporate adoption, and increasing regulatory clarity paints a decidedly bullish picture for the long term.
However, the path forward is unlikely to be a straight line. The risks associated with high leverage in the short term, coupled with a sense of caution in the options market, serve as important reminders that volatility remains a key characteristic of the crypto space. While the fundamental drivers suggest that Ethereum is well-positioned for continued growth, investors and market participants would be wise to remain vigilant and mindful of the potential for pullbacks. The coming months will be crucial in determining whether Ethereum can sustain its current momentum and solidify its position not just as a leading cryptocurrency, but as a global financial asset of the future.
Ethereum ETH price analysis📉 Three possible scenarios for #Ethereum CRYPTOCAP:ETH :
🟢 Bullish:
Minor correction to $3950–$4000, followed by a breakout to new all-time highs (ATH).
🟡 Neutral:
Drop to $3400, bounce to $3950 — and then the decision point: breakout or breakdown?
🔴 Bearish:
Deeper correction to $2650 — possibly the last great buying opportunity before the next major rally.
👉 Which scenario for OKX:ETHUSDT resonates most with you?
Let us know in the comments!

Ethfi longfalling wedge breakout on ETHFI/USDT with a projected pullback to retest the wedge before moving up toward your target near 1.7040

Others.d sign the falling of AltCoins this is a classic set up of price action analysis. As it shown in Fig, Others.d reach to fresh order block at 7.9%, after that a Choch and BOS and Retest of it happend.
Now Market is ready to Dump Badly.
get ready of it

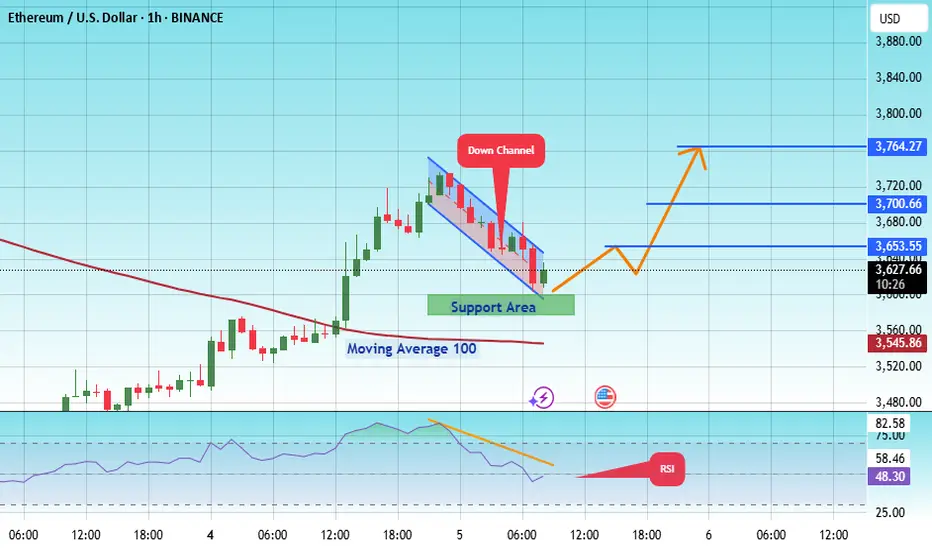
#ETH/USDT : Price is going as expected in previous ideas on eth#ETH
The price is moving within an ascending channel on the 1-hour frame, adhering well to it, and is on track to break it strongly upwards and retest it.
We have support from the lower boundary of the ascending channel, at 3593.
We have a downtrend on the RSI indicator that is about to break and retest, supporting the upside.
There is a major support area in green at 3582, which represents a strong basis for the upside.
Don't forget a simple thing: ease and capital.
When you reach the first target, save some money and then change your stop-loss order to an entry order.
For inquiries, please leave a comment.
We have a trend to hold above the 100 Moving Average.
Entry price: 3626.
First target: 3653.
Second target: 3700.
Third target: 3764.
Don't forget a simple thing: ease and capital.
When you reach your first target, save some money and then change your stop-loss order to an entry order.
For inquiries, please leave a comment.
Thank you.
buy signal for eth I'm completely sure CRYPTOCAP:ETH will hit 9500 $
Same chart with CRYPTOCAP:BTC
I'm just waiting for the confirmation " source break " on eth, and u will see .. easiest 100% investment
#eth #btc #bitcoin #Ethereum #crypto

ETHUSDTEthereum will definitely return from this price range to the target of $4000, the price range is the price retracement ($1428-$1125-$802).

ETH – Approaching Major Supply Zone⚠️ ETH – Approaching Major Supply Zone
Pair: ETH/USD
Timeframe: 3D
Structure: Order Blocks (OB) + Fair Value Gaps (FVG)
Momentum: RSI nearing historical reaction levels
📊 What’s happening?
ETH has rallied strongly into a multi-year supply zone between $4,200 – $4,500, overlapping with prior distribution phases. The zone aligns with a major Order Block (OB) from the last market top, making it a high-risk area for rejection.
🛑 Caution Zone:
OB resistance: $4,200 – $4,500
RSI approaching overbought region on the 3D timeframe
📌 Bearish Signals to Watch:
Bearish candle formations inside OB
RSI bearish divergence
Failure to close above $4,500
Bias: Possible short-term correction before any attempt at ATH retest.
✅ Bullish Confirmation:
Strong volume breakout above $4,500
Retest of OB as support holding
RSI maintaining bullish momentum without sharp divergence
🎯 Upside Targets:
$4,868 (ATH)
$5,200+ (extension target)
Bias: Highly bullish if price closes and sustains above $4,500.

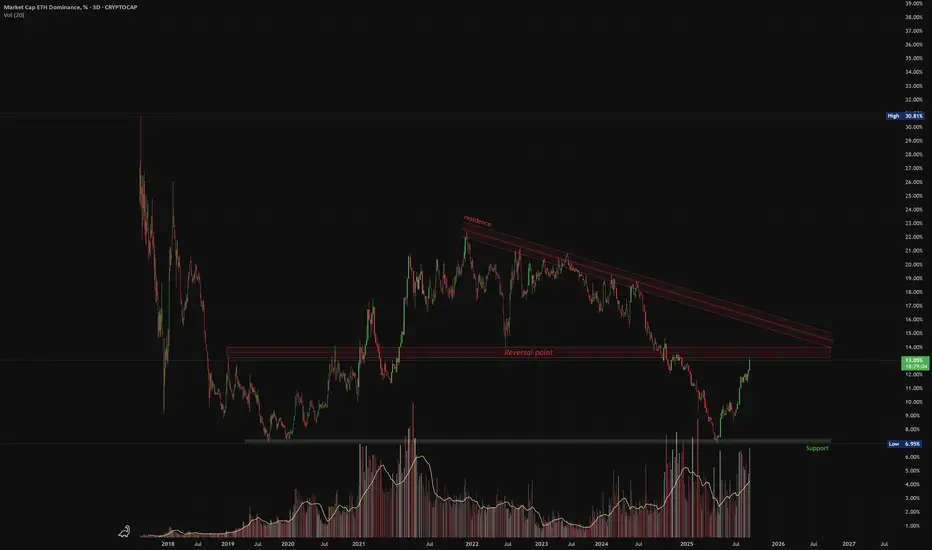
ETH Dominance – Possible Pullback at Key ResistancePair: ETH Market Cap Dominance (%)
Timeframe: 3D
Structure: Descending Trendline + Horizontal Resistance
Volume: Rising on approach to resistance
📉 What’s happening?
ETH dominance has rallied from support and is now approaching a historically strong resistance zone marked by multiple rejection points. Price is also near the long-term descending trendline, which has acted as a ceiling for over a year.
🔻 Caution Zone:
Resistance between 18.5%–19.2%
Historical reversal area (marked as “Reversal Point”)
📌 Pullback Triggers:
Bearish candle formation at resistance
Declining volume on further push up
Failure to close above the descending trendline
Bias: Short-term pullback likely unless ETH dominance breaks and closes above resistance with strong volume.
ETH is ready to Drop Sharply Now it time to Short ETH, a big drop is going to start .
Fasten your seatbelt

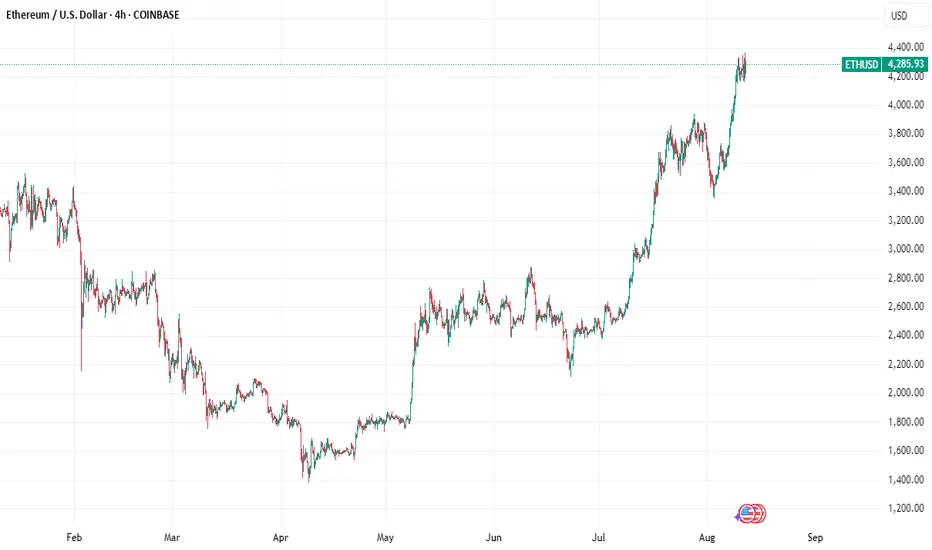
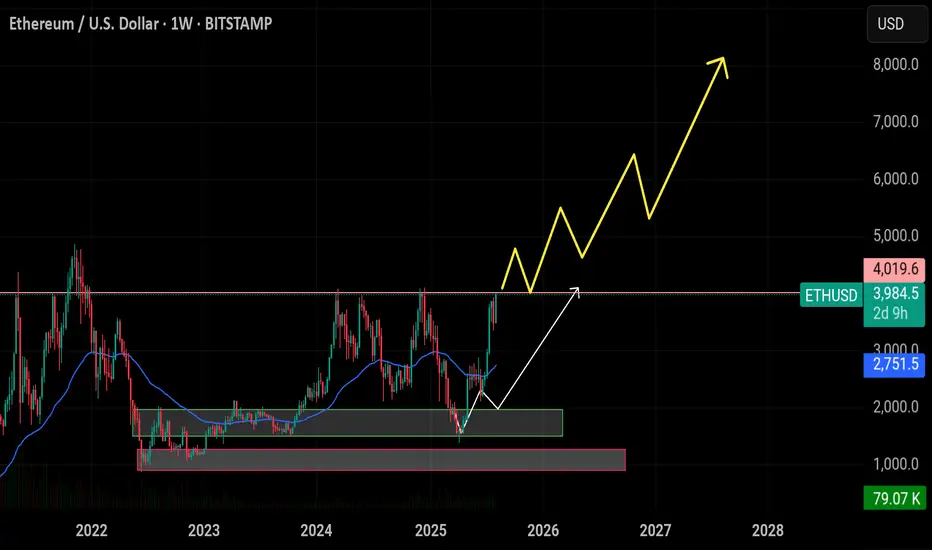
$ETH/USDT Breakout Analysis 1W Chart: Ethereum $ETH/USDT Breakout Analysis 1W Chart:
ETH has successfully reached the $4,000 breakout level, completing our first major target from the accumulation zone ($1,500–$1,900). Price is currently testing the critical $4,000 resistance. If ETH can close a weekly candle above this level and hold, it will confirm a strong continuation structure — potentially targeting $5,000, $7,000, and up to $8,000 in the coming months.
🔸 Support LEVEL: $3,500 is now the key weekly support zone. This level aligns with previous resistance and structure, offering a strong base for bullish continuation. If ETH holds $4,000+ weekly, $3,500 becomes a high-conviction re-entry zone.
🔸 Upside Target: Upon confirmation above $4,000, ETH could rally toward $5,000 short-term, with extended targets at $7,000 and $8,000 if momentum continues.
🔸 Risk Level at $3,500: A weekly close below $4,000 followed by a drop under $3,500 would invalidate the breakout. This could signal a failed breakout and return to range. High risk zone opens below $3,200.
🔸 Watch for Retest ZONE: Look for a healthy retest of the $3,900–$4,000 zone. If ETH pulls back and holds this zone on weekly, it offers a strong entry with targets toward $5,000 and above.
ETH-----Sell around 3905, target 3850 areaAugust 8th ETH Contract Technical Analysis:
Today, the long-term daily chart closed with a small bullish candlestick pattern, with consecutive bullish candlestick patterns and a single bearish candlestick pattern. The price is above the moving average, and the accompanying indicator shows a death cross with shrinking volume. The overall upward trend is very clear, but the current price is deviating from the moving average, so traders should be aware of the risk of a large pullback. There are also news and data stimuli. The short-term hourly chart shows a pattern of oscillating upward movement, with prices continuing to break higher. The more such a trend is, the more we need to pay attention to the support level of the pullback. This is crucial. Many friends want to sell, and that's fine, but you must not be greedy. Only short-term trading is necessary. If you can't do it, don't do it. Currently, the price is under pressure, with consecutive bearish candlestick patterns and the accompanying indicator showing a downward death cross. A pullback is also important for the day.
Today's ETH Short-Term Contract Trading Strategy:
Sell at the current price of 3905, with a stop loss at 3935 and a target of 3850.

ETH ( Ethereum ) lovers looking strong for long term ETH -----Daily counts indicate Excellent bullish wave structure.
Both appear to be optimistic and this stock invalidation number (S L) wave 2 low
target short / long term are already shared as per charts
correction wave leg seems completed
Investing in declines is a smart move for short/ long-term players.
Buy in DIPS recommended
Long-term investors prepare for strong returns over the next two to five years.
one of best counter
Every graphic used to comprehend & LEARN & understand the theory of Elliot waves, Harmonic waves, Gann Theory, and Time theory
Every chart is for educational purposes.
We have no accountability for your profit or loss.

ETH(20250806) market analysis and operationAugust 6th ETH Contract Technical Analysis:
Today, the daily chart showed a small bullish candlestick pattern yesterday, with prices rising continuously. However, the accompanying indicator formed a death cross. Monday's gains were not followed by a significant pullback on Tuesday. Therefore, it is difficult for both upside and downside to continue, and the trend remains range-bound. Until a breakout occurs, maintain a short-term strategy of selling high and buying low. On the hourly chart, yesterday's US session continued the downward trend of the European session, correcting the current bearish candlestick pattern. The accompanying indicator formed a death cross with shrinking volume, suggesting a high probability of a pullback during the day. Focus on the upward pressure around the 3700 high.
Today's ETH Short-Term Contract Trading Strategy:
Buy on pullbacks to the 3590 area, with a stop loss at the 3560 area, and a target of the 3650 area. Sell on pullbacks to the 3670 area, with a stop loss at the 3701 area, and a target of the 3605 area.

ETHUSD Market Structure and TrendMarket Structure and Trend
ETH has risen from around $2900 to around $3800 in July, breaking the important $4000 resistance level that has previously failed to be broken three times in 2024
ETH is trading in a tight price range of $3650–$3704, with the price above the EMA(25) ($3460), confirming the medium-term bullish trend
Indicators and Signals
EMA(7): $3739 — price below → short-term weakness signal; but above EMA(25) and EMA(99) (~$2832) → trend remains bullish
Stochastic RSI (6): ~1.6 — oversold level, signaling a possible rebound
RSI (according to TipRanks): around 76.7 — overbought, partially limits growth
ADX (14-day) on Barchart: around 17–23 — weak trend and consolidation
Support and resistance levels
Support:
$3616 — 3650 zone (lower boundary of the range and EMA(25)),
then $3460 (EMA25) and then $3460–$3300 if broken below
Resistance:
$3739 (EMA7),
above $3800,
key level $4000 — psychological and technical barrier,
further — historical maximum around $4800
Possible scenarios
Bulls
If the price holds above $3650 and stochastic RSI bounces up — growth to $3739 → $3780–$3800 is expected.
Breakthrough and holding above $3800 will open the way to $4000–$4100, and potentially higher, up to $4800+ if the market turns in favor of ETH
Bears
Consolidation below $3616 → possible movement to $3460 and lower to $3300+ with increased selling and weak volume
RSI above 70 may foreshadow a correction in the absence of further momentum.

CHILLGUY 3D DOWN TREND$CHILLGUY Looks like eyeing for Bollinger lower band around 0.039
At long timeframe like 3D and weekly its still in a down trend
stay cautious :)

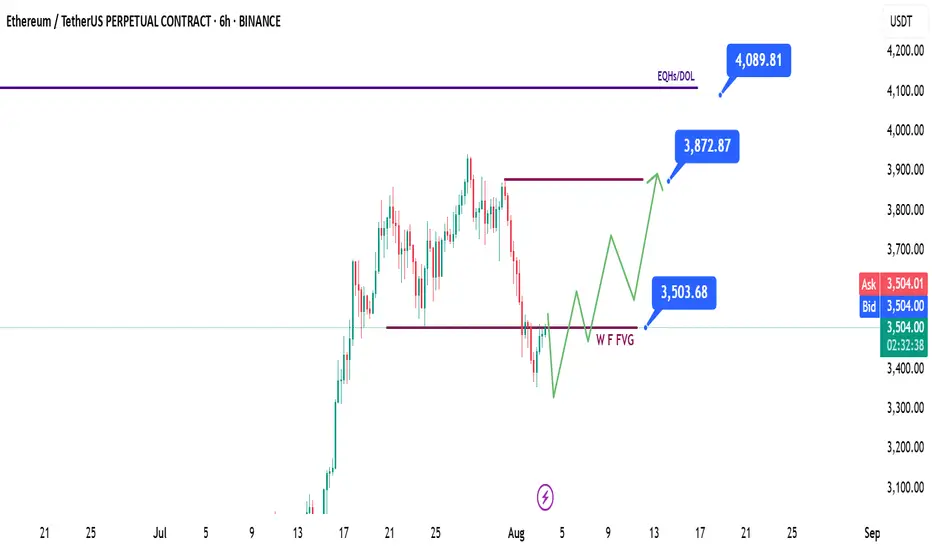
ETH | Ethereum - Weekly Recap & Gameplan - 03/08/25📈 Market Context:
Traders are currently anticipating a potential 0.25% rate cut at the September FOMC meeting, which continues to support the broader bullish outlook.
While the market pulled back following weaker-than-expected Non-Farm Payroll data, overall sentiment remains optimistic.
Greed has cooled off into a more neutral stance. Historically, August often brings some consolidation or pullbacks — but the structural bias for crypto market remains bullish.
🧾 Weekly Recap:
ETH started the retracement movement after building a bullish trend over the past couple of weeks.
It’s mainly being affected by Bitcoin's bearishness, so we’re closely following BTC’s price action.
ETH has tapped into the Weekly Fair Value Gap, which is a key level for me.
We may see a bounce from here.
📌 Technical Outlook & Game Plan:
I expect to see another low on ETH before we go up — as I’m also anticipating one more leg down on Bitcoin.
So I’ll wait for a final bearish expansion and a trap for late sellers before positioning for longs.
After that, I want to see price closing above the purple line at $3500.
🎯 Setup Trigger:
A candle close above the $3500 level will be my signal to look for long setups.
📋 Trade Management:
Stoploss: Below the swing low that breaks above $3500
Take Profit: Targeting $3870, but will trail and lock in aggressively in case of deeper downside expansion.
💬 Like, follow, and comment if this breakdown supports your trading! More setups and market insights coming soon — stay connected!
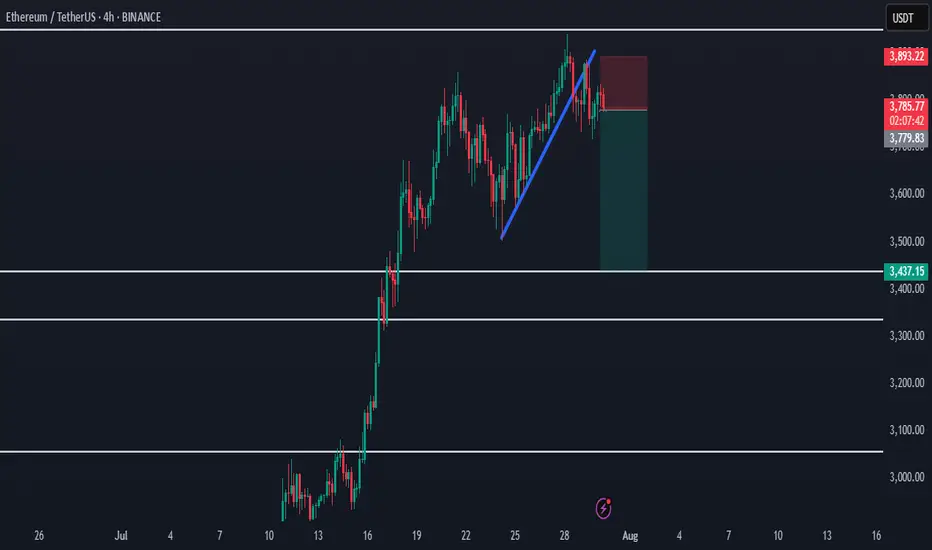
Ethereum Rejected from Supply - Bearish Shift in ProgressHello everybody!
Price has been rejected from a supply area.
The bullish trend has slowed down, and the market structure is slightly shifting bearish.
A polished upward trendline has been broken on the 1H timeframe.
We’re aiming for a target around the first untouched demand zone: 3437.
Manage your risk and trade safe!
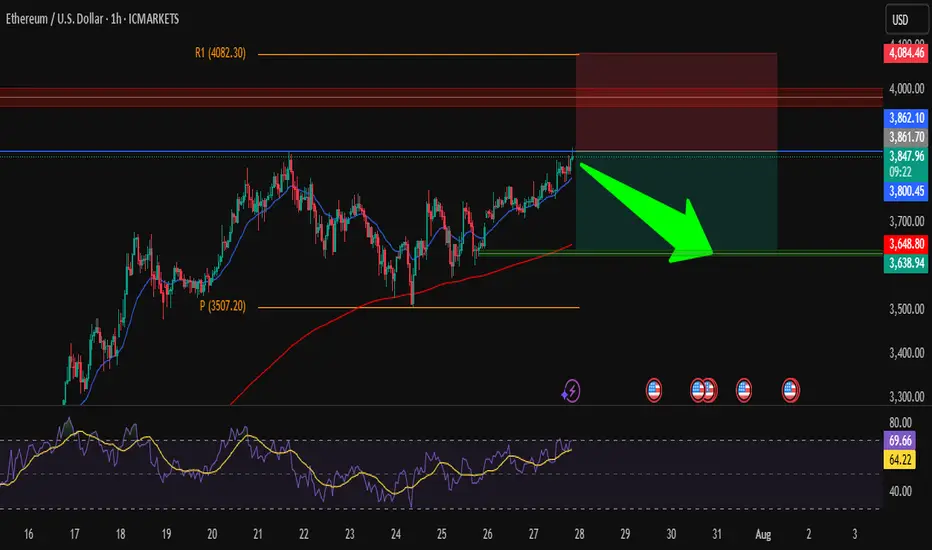
ETH/USD – Short from ResistanceHi traders ! , I opened a short position on ETH/USD as price is hitting a strong resistance zone.
Entry: 3850
SL: 4084.46
TP: 3638.94
📌 Why I took this trade:
Price is testing a strong resistance zone around 3860, RSI is overbought, and we could see a pullback toward the support area around 3640.
Nice risk/reward setup, keeping it simple.
This is just my analysis, not financial advice.
What’s your view — drop or breakout?
Ethereum: Smart Money Reversal After Stop Hunt?In the previous update, we warned that Ethereum might drop lower before any meaningful bounce — especially if it failed to hold the midline of the ascending channel. That scenario played out exactly as anticipated.
🟡 Price action summary:
ETH broke below the midline of the weak ascending channel, hunted the liquidity below recent lows, and tapped into the key bullish order block near $3,490 – $3,520. Price is now reacting to this zone with early signs of a reversal.
📌 Key observation:
Midlines of weak or low-momentum channels often act as liquidity traps in smart money models. Buying at these levels can be extremely risky — especially during corrective or distribution phases.
⸻
📚 Educational Note:
Never enter long positions solely at the midline of a weak ascending channel, especially when there’s a high probability of liquidity sweep below. Smart entries usually occur at order blocks formed after stop hunts.
⸻
🎯 Next steps:
Wait for confirmation (such as internal BOS or FVG closure) before entering longs. The structure suggests a potential move back toward the upper boundary of the channel if this OB holds.
⸻
🔗 Save this analysis and share it with fellow traders.
💬 Thoughts? Drop your view in the comments.

ETHUSDT.PIf you look at the chart, you will notice an uptrend that has somewhat lost its strength and we may not be able to hit higher highs like the next strength in the next move.
Support: 3.660 - 3.590 - 3.160
Resistance: 3.900 - 4.260
Entry: 3.700
SL: 3.500
TP: 4.240
Please control risk management.⚠️

ETH BREAKOUT IMMINENT?Ethereum is currently trading around $3,726, holding just above key support levels, including the 50-day SMA and the psychological $3,700 zone. Despite a minor pullback, ETH continues to show signs of bullish strength and remains in a healthy uptrend.
Momentum indicators like RSI and volume show signs of recovery, and ETH is forming a bullish continuation pattern near resistance. If Ethereum can break above the $3,820–$3,850 zone, we are likely to see a quick push toward higher levels.
Ethereum is showing solid strength after consolidating above $3,700. The breakout attempt toward $3,850 will be critical. If bulls push through this level with volume confirmation, a move toward $3,900 and then $4000 becomes highly probable.
The market structure is constructive, and the presence of ETF-driven institutional demand adds further bullish pressure. While short-term volatility may create minor pullbacks, the medium-term setup favors upward continuation.
