ETHUSD 1H — Short Opportunity After Channel BreakCOINBASE:ETHUSD
Price is trading inside a broad descending structure, and the recent move appears corrective, forming a rising channel. This type of structure often represents distribution before continuation lower.
A sweep into the 3,250–3,320 supply zone aligns with previous imbalance and trendline rejection. If the price rejects this zone with momentum, the bearish continuation setup becomes valid.
Key Scenarios
❌ Bearish Case (Primary Setup) 📉
Ideal Entry: 3,250–3,320 Zone (Supply)
→ 🎯 Target: 2,700–2,650 (Liquidity Sweep + Demand Zone)
→ 🛑 Stop Loss: Above 3,380
Confirmation triggers:
• Break of rising channel
• Bearish engulfing candle
• Wick rejection into the zone
Levels to Watch
Type Price
Short Entry 📍 3,250–3,320
Target 🎯 2,650–2,700
Stoploss ❌ 3,380
Invalid if Broken Trendline + Structure Flip
⚠️ This analysis is for educational purposes only — not investment advice.
Ethreum

ETHUSD Long Setup — Potential Reversal After Liquidity SweepAfter an extended sell-off during the session, ETH formed a sharp liquidity sweep near the $2,720 – $2,730 zone, followed by a strong bullish reaction. Price has broken short-term structure to the upside and is now forming higher lows on the 15-minute timeframe.
📌 Entry: around $2,800
📌 Stop-loss: below the liquidity sweep zone (~$2,725)
📌 Take-profit: targeting $2,960 – $2,970 zone from previous imbalance / inefficiency
➕ Confluences
Rejection from higher-timeframe demand
Aggressive selling exhausted after liquidity grab
Bullish market structure shift (MSS) on M15
Increasing volume on upward candles
⚠️ What invalidates the setup?
A clean break below $2,725 with strong selling pressure would invalidate the reversal bias and open space for continuation to the downside.

ETH : SELL MARKET!!!Hello friends
Well, as you can see, we are in a very strong downtrend and the sellers have full control.
Now, any price increase can be a selling opportunity, until the buyers show strength, we cannot say that the trend has changed...
Of course, we are also at important support and we need to see whether buyers support the price or not. Until then, we will not trade on guesswork and predictions.
This analysis is purely technical and is not a buy or sell recommendation, so please exercise your risk and capital management.
*Trade safely with us*

Bitcoin's massive fall to $50,000. OMGA massive bankruptcy for a strategy company with Bitcoin falling to $50,000, and this event will be the driving force behind the price explosion to $500,000 over the next 10 years, making it the biggest investment opportunity of the century. So, follow the market direction without bias and know that huge companies have gone bankrupt before with the fall of even gold, but gold has always recovered and remained a store of value, and this time it is Bitcoin's turn to test.
Patterns, fundamentals, technicals, and all indicators and oscillators confirm this scenario, so let's remain unbiased.

Ethereum (ETHUSDT): Approaching a Major Turning PointHI!
Trend Structure
Since mid-October 2025, ETH has been trending inside a well-defined descending channel, forming consistent lower highs and lower lows. The break of the previous bullish trendline back in July 2025 confirmed the shift into a corrective phase.
Key Support Zone (S&D)
Price is now around $2,730 (Nov 2025) and heading toward the crucial $2,450–$2,300 S&D zone, a strong support area that held the market firmly between May and July 2025.
Expected Price Behavior
A final liquidity sweep toward $2,300–$2,200 is possible before any sustainable upside move. This aligns with the lower boundary of the descending channel.
Deeper Support (DP)
If this level fails, the next major demand sits at $1,950–$1,800, last touched in March 2025.

ETHEREUM Analysis (12H)A large amount of liquidity has been hunted at the top, which corresponds to the all-time high. After this liquidity was taken, the price entered a bearish structure with strong momentum.
For this bearish structure to reverse or slow down, sufficient liquidity needs to be collected from the lower areas of the chart.
There is a possibility of a temporary rebound from the current levels, but the main reversal should come from the lower zone that we have identified.
We still maintain this outlook on Ethereum in the daily and 12-hour timeframes
Do not enter the position without capital management and stop setting
Comment if you have any questions
thank you

Selena | ETHUSD 1H – Bullish Continuation SetupCOINBASE:ETHUSD
The recent rejection from the upper trendline created short-term corrective movement. Liquidity sweeps below minor support hint at accumulation, and as long as price remains above the invalid zone at 2899, bullish momentum is favored. Holding demand could fuel another expansion toward the next resistance block.
Key Scenarios
✅ Bullish Case 🚀
Hold above Demand Zone (≈ 2990–3020) →
→ 🎯 Target 1: 3110
→ 🎯 Target 2: 3180
→ 🎯 Target 3: 3220 (Top Resistance)
❌ Bearish Breakdown 📉
Break below 2899 invalidation zone
→ Potential retracement toward 2755 – strong support zone
→ Deeper demand sits near 2621 if structure fully collapses.
Current Levels to Watch
Resistance 🔴: 3110 | 3180 | 3220
Support 🟢: 3020 | 2899 | 2755
⚠️ Disclaimer: Educational analysis only. Not financial advice.

BTC Quick Outlook 2026As long as Bitcoin trades below 100K, downside pressure dominates. There’s roughly a 55% chance of dropping to 78–76K and about a 30% chance of a deeper fall to 70–66K. If these drops occur, the typical rebound target is 92–100K, and only a solid daily close above 100K opens the path toward 108–112K and potentially 116–124K. If price climbs without a deeper correction, the realistic ceiling remains 108–112K, with a stronger scenario reaching 116–124K.

Selena | ETHUSD 2H — Bullish Momentum Retest Setup |COINBASE:ETHUSD
After a strong sell-off, ETH formed a base around $2620 and reclaimed structure. The recent breakout and consolidation suggest accumulation before continuation. As long as price holds above $2940–$3000, bullish continuation remains favored toward the next supply zone
Key Scenarios
✅ Bullish Case 🚀
If price holds above $2940–$3000 support:
🎯 Target 1: $3200
🎯 Target 2: $3350–$3450 (major supply zone)
❌ Bearish Case 📉
A clean break below $2940 may invalidate the bullish structure and open deeper retracement.
Current Levels to Watch
Support Zone: $2940–$3000
Rising Channel Support
Liquidity Target: $3350–$3450
⚠️ Disclaimer: This analysis is for educational purposes only. Not financial advice.

ETHUSDT SELL POSITIONEthereum is currently under strong selling pressure, and with the price hovering around $3,000, it could easily drop back below $2,600. However, for a more reliable entry, the 4-hour timeframe gap around $3,250–$3,350 offers a much better zone to look for a sell position.
If price reaches this area with a strong and impulsive move, there is a high probability (over 70%) that this sell setup will play out successfully. But if Ethereum approaches the $3,300 zone with weak momentum, the trade becomes a bit more risky, and the setup may require further confirmation before entering.

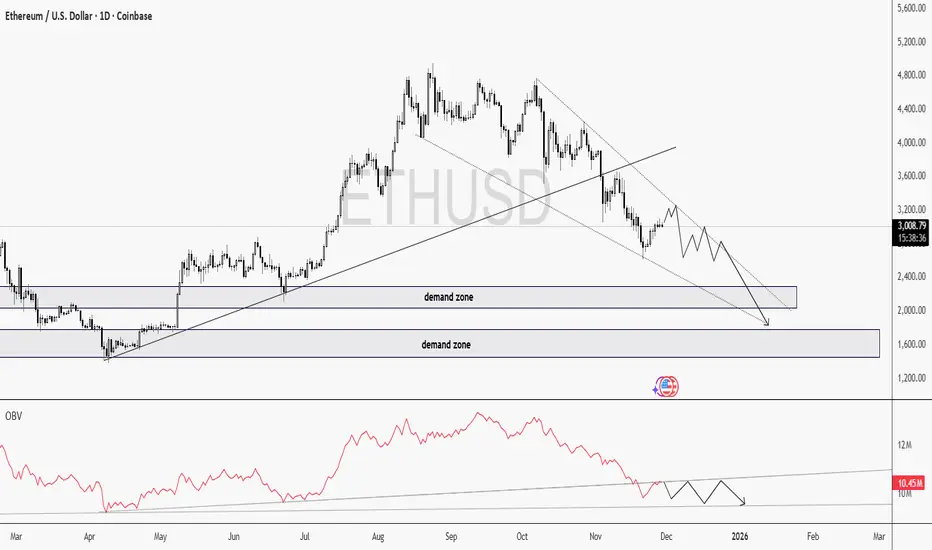
ETH Chart doesn't look prettyI see Ethereum’s chart not looking pretty for long nor hold positions at these prices.
Price Action
ETH continues to make lower highs and lower lows inside a descending wedge.
Price is moving toward two major demand zones, and the momentum is really weak. Just minor price hiccups.
I'm expecting some choppy or even consolidation movements before a possible test of the lower demand blocks.
OBV is such an underrated indicator!
Look at OBV, this is where the things gets interesting..
OBV is breaking its trendline downward, even while price hasn’t fully broken structure yet.
This is a classic sign of volume distribution. Smart money is exiting positions quietly.
When OBV breaks direction before price, it often predicts the next major move.
At the moment, ETHUSD is looking heavily bearish. Given the fact that BTC is also giving early signs of a bearish trend, I don't think buying ETH is a good idea here. I'll wait for a deeper correction.
Good Luck!
BTCUSD | Rejected BTCUSD dropped when reaching my zone I posted in one of my other ideas.
Looking for BTCUSD to make move down from here and make a new low.
Let me know what you think!
Stay safe out there and do your own due diligence, this is not investment advise!

ETH Buy Signal: Heikin Ashi Bullish Reversal at Key SupportSTRATEGY SNAP: HEIKIN ASHI BULLISH SETUP
CHART SETUP:
· Asset: ETH/USDT
· Timeframe: 1 Hour - Optimal for swing entries
· Chart Type: Heikin Ashi - Clean trend identification
· Pattern: Bullish reversal at dynamic support
· Exchange: Binance - Reliable price data
📊 STRATEGY EXECUTION PLAN:
ENTRY: $3,000
· Precise level for position initiation
· Heikin Ashi candles showing bullish momentum shift
· Requires confirmation candle close above $3,000
RISK MANAGEMENT:
· Stop Loss: $2,970 (Below recent swing low)
· Risk Per Trade: ~1.0% from entry
· Position Sizing: Standard 1-2% portfolio risk
PROFIT TARGETS:
· Target 1: $3,020 (+0.67% return)
· Target 2: $3,050 (+1.67% return)
· Risk-Reward Ratio: 1:2.3 (Excellent)
🎓 TECHNICAL RATIONALE:
Why This Setup Works:
1. Heikin Ashi Advantage: Smoothed candles showing clear bullish momentum shift
2. Support Respect: Price holding above key psychological $3,000 level
3. Trend Alignment: Higher timeframe bias remains bullish
4. Volume Confirmation: Watch for increasing volume on breakout
Key Levels to Watch:
· Immediate Resistance: $3,020 (Target 1)
· Next Resistance: $3,050 (Target 2)
· Critical Support: $2,970 (Must hold for bullish case)
⚡ MY STRATEGY CRITERIA MET:
✅ Heikin Ashi bullish momentum confirmation
✅ Clear support level identification
✅ Defined risk management parameters
✅ Logical target projections
✅ Favorable risk-reward ratio
TRADE MANAGEMENT SUGGESTIONS:
· Consider partial profit booking at Target 1
· Move stop to breakeven at $3,010 once Target 1 reached
· Trail stop for remaining position to Target 2
· Monitor overall crypto market sentiment
EDUCATIONAL INSIGHT:
"Heikin Ashi charts are particularly effective for identifying smooth trend transitions and reducing market noise. The current setup shows a clear momentum shift from bearish to bullish consolidation."
---
🔔 FOLLOW for real-time strategy updates and more educational chart analysis!
#Ethereum #ETH #TradingStrategy #HeikinAshi #Crypto #TechnicalAnalysis #Binance #TradingView
⚠️ DISCLAIMER: I am not a financial advisor. This is educational market analysis demonstrating my personal trading strategy. NOT investment advice. Trade at your own risk. Past performance doesn't guarantee future results.

ETHUSD | Short ideaLooking for the next move down on ETHUSD here.
ETHUSD has been trending up for the last few days but I don't think the downtrend is over for now.
Could be right or could be wrong, I would like to hear what you are thinking.
Stay safe out there and do your own due diligence, this is not investment advise!

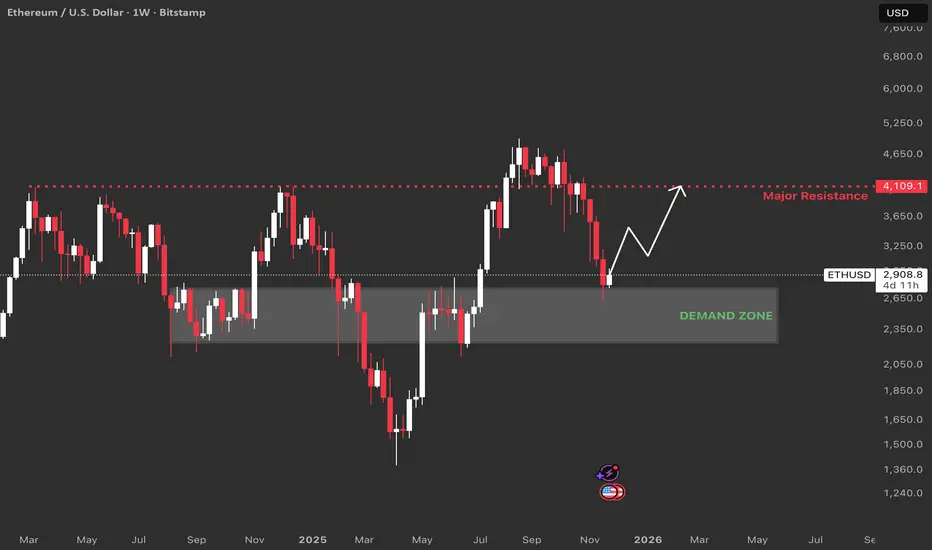
Ethereum Trade Setup: Weekly ChartDemand Zone : This area marks where ETH found buyers over multiple months, rejecting further declines. Historically, when price revisits this zone after a sell-off, it tends to bounce. The recent reaction confirms buyers are active and defending this level.
Major Resistance (4,109 USD) : It shows a prior weekly high and an expected supply or resistance area. This level also aligns with a golden pocket Fibb level, making it a confluence point where sellers could re-enter or bulls take profits.
Invalidation point: Weekly close below demand zone or multiple rejections with lower highs near demand.
$ETH S/R Flip Zones (Support → Resistance & Resistance → SupportS/R Flip Zones (Support → Resistance & Resistance → Support)
Your chart shows ETH trading directly inside a cluster of clean S/R flips, which is why price keeps reacting sharply.
🔹 Main S/R Flip #1 — $2,900 Area
The $2,898 – $2,920 level was previous support, then broke down.
Price is now retesting it from below → acting as resistance.
This is exactly where ETH stalled on the current bounce.
This zone determines whether ETH:
Breaks above → opens the path to $3,055
Rejects → returns to sweep liquidity below $2,850
🔹 Main S/R Flip #2 — $2,780 – $2,820 (Demand Block)
This is the gray demand zone you marked.
It’s the origin of the recent rally, created by displacement.
ETH tapped this area perfectly and pushed upward → confirming bullish S/R flip.
This zone now acts as short-term support.

Everyone Gave Up on ETH – Perfect, Disbelief Phase ActivatedThe sentiment in crypto right now is as bad as—if not worse than—during the COVID crash or the FTX collapse. Anyone who was around back then remembers the “this is the end of crypto” vibes. It always feels apocalyptic in these moments, and this time is no exception.
Yet the fear index is hitting lows we haven’t seen since COVID… while Bitcoin is sitting between 80k and 100k. That combination is almost comical. History shows that when despair peaks like this, what feels like the end is usually just the beginning.
The chart above is a bar-pattern fractal on ETH I’ve been tracking privately for nearly a year. The moment I finally published it, price deviated hard—classic lol
Zooming in, here’s my current road map assuming we’re headed into a proper bull market in 2026:
- We just finished Wave 2
- Wave 3 (the longest and strongest) is starting now
→ Top around May 2026 at ~$11,000
→ Wave 4 retraces ~50% of Wave 3, retesting the previous ATH zone
→ Wave 5 takes us to $18,000–$25,000 sometime in Q4 2026 or early 2027
Invalidation level?
In the last two cycles, the real bear market began when price repeatedly rejected and failed to reclaim the 0.5 Fibonacci level. A clean break and hold above that zone has always kept the bull alive.
I’ve also been watching the Russell 2000 as a macro confirmation .
No breakout yet, but notice the deep pullbacks it always has right before the eventual clean break higher. We’re following the exact same script.
Conclusion
Technicals are still noisy and not fully confirmatory, but sentiment is screaming. Capitulation is extreme—90%+ of people have thrown in the towel. My inbox and comment sections are filled with “you’re insane” and “what are you smoking” messages. That level of universal bearishness, combined with the price action we’re seeing, is one of the strongest contrarian buy signals you can get.
When everyone is this convinced it’s over, going against the herd is usually the right play.

#ETHUSD 2,700 Strong Support !!We can say that 2,700 has acted as a stable short-term support level. On the positive side:
- ]RSI is at 60 and above its moving average.
- Expectations for a Fed rate cut have strengthened.
- SuperTrend has flipped to a buy signal.
I think the 2,940 support level, which worked previously in July, may hold again and help drive the price higher. After that, a breakout from the descending channel could offer around a 24% upside in the short term.

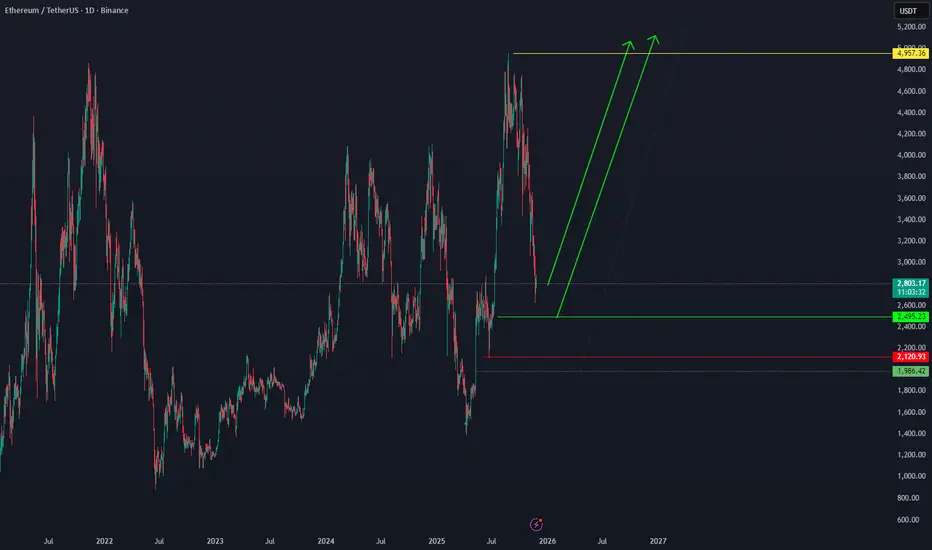
ETH is ready to reach its ATH.Ethereum can start its bullish move from the current price, as well as from 2495 — and in a more pessimistic scenario, from 1983.42 — targeting 4957 and potentially higher. BINANCE:ETHUSDT
ETH - UPDATECRYPTOCAP:ETH - Update:
Very neutral area & bearish bias.
TP3 almost hit yesterday on my view. ✅🎯
Key support: 2620 - 2650$ - 2560 - 2480 - 2460 - 2380
Big resistances; 2900 - 2880 - 2815 - 3220
Under the main downtrend, Deeper correction possible 📉
Bottom could be around 2400$ - 2480 (weekly levels).

ETH selling climax!ETH is approaching its final stages of selling. I will watch how price behaves in the marked fib levels.

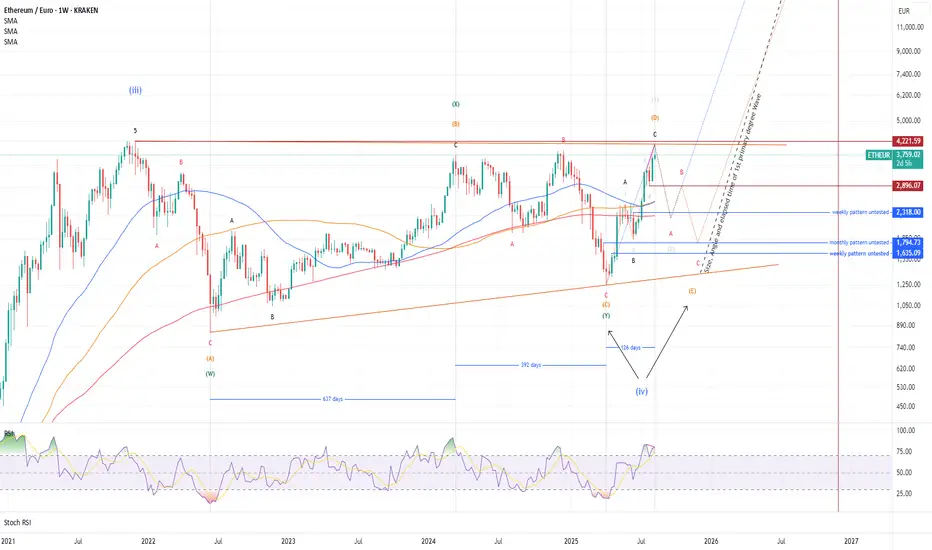
ETH - This will take time Part IIIEthereum has reached its predicted price target, indicating a likely retracement. RSI (7) divergence is present across all major time frames (monthly, weekly, and daily), reinforcing this outlook.
Two potential retracement scenarios are possible:
the blue line represents a shallow retracement, while the red line suggests a deeper pullback, potentially to €2.300. In a more bearish scenario, prices could decline further to the €1.800–€1.400 range.
A key question is whether the whole 4 year-correction reflects an Elliott Wave ABCDE triangle pattern or a WXY wave.
If the correction was a WXY wave, the first minor wave of the fifth wave (primary degree) may have begun at €1.255 on April 7, 2025, with the anticipated retracement representing the second minor wave.
Regardless of the wave structure, caution is advised. The next major cycle is expected to begin between October and December 2025 or January and February 2026, as outlined in my previous analysis, "ETH - This will take time Part II"
For now, it’s prudent to step back and monitor market developments.
Re-entry Long idea on ETHUSDBased on :
-quantitative analysis
-Volume analysis
-Option flow analysis
