Re-entry Long idea on ETHUSDBased on :
-quantitative analysis
-Volume analysis
-Option flow analysis
Ethreum

ETHUSD: Outlook for the Upcoming DaysMonthly View:
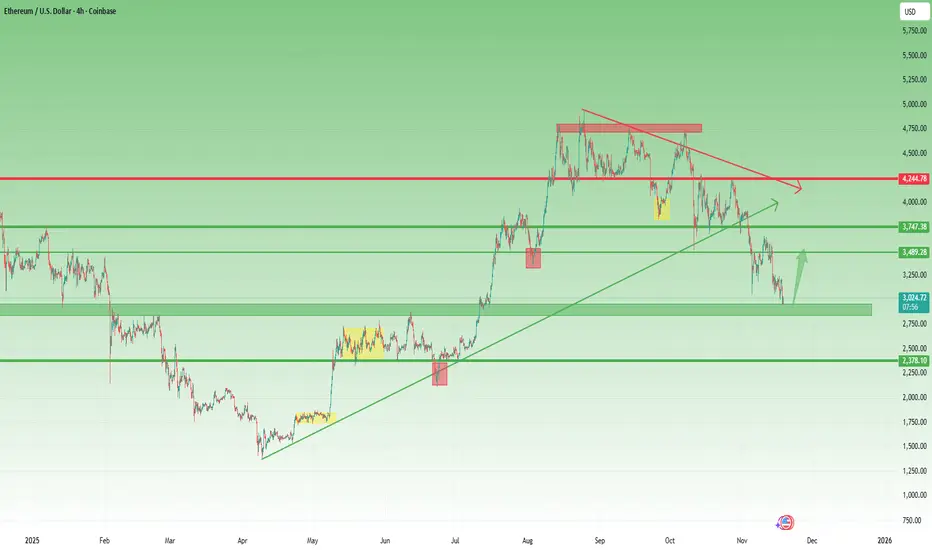
The monthly timeframe remains bullish overall, but ETH has pulled back to gather strength. This kind of move is typical when the market is gearing up to break a higher high. The broader structure hasn’t shifted—this is simply a deeper retracement inside a bullish narrative.
Weekly View:
The weekly chart is showing a similar story. Price has been dropping consistently without giving even a single proper reversal. If ETH truly wanted to fall aggressively, it would normally make a move up first, trigger traders’ stop-losses near previous highs, and then dump. But this time, it didn’t do that.
This unusual behavior hints that the market may be preparing something different from what most traders expect.
Daily View:
The daily timeframe is where things get really interesting. ETH spent more than half the recent sessions moving sideways, collecting liquidity on both sides. After that, it dipped and formed a lower high—but that lower high hasn’t been broken yet.
According to my analysis, ETH is currently sitting in the Discount Zone, an area where buyers often start becoming active.
4-Hour View:
On the 4H chart, I already had a clean short setup earlier, but now I’m watching for signs of a potential reversal. That reversal idea is not guaranteed, though—it becomes invalid if ETH fails to break the series of lower highs.
There’s also another scenario: ETH might refuse to break the lower highs and begin forming higher lows at the same time. If that happens, we’ll see a period of sideways consolidation. When the breakout finally comes—whichever direction it chooses—the move is likely to be powerful.
Final Thoughts:
Based on my analysis, ETH is showing mixed but promising signals across the higher and lower timeframes. The monthly structure is still bullish, and this pullback looks more like preparation for a stronger push rather than a trend reversal. Weekly price action hasn’t shown any meaningful bounce yet, which is unusual—and that alone hints that the market might be setting up something unexpected.
On the daily chart, ETH has swept liquidity after moving sideways for quite a while, and now it’s resting in the Discount Zone, where smart money usually becomes active. The 4H timeframe already gave clean short opportunities earlier, but now the market is approaching a point where a reversal could begin—unless lower highs remain untouched.
If ETH starts forming higher lows without breaking lower highs, the market will likely slip into a compression phase. When price finally breaks out of that squeeze, the move—up or down—can be very strong.
Again, this is just my personal viewpoint. Please do your own analysis before investing. Your profits and losses are entirely your responsibility—I’m only sharing what the charts are suggesting to me right now. Stay alert to the reaction levels ahead; that’s where the next major direction will reveal itself.
----------------------------------------------------------------------------------------------
Thanks for checking out this analysis! If you enjoyed it, hit that follow button so you don’t miss future updates. And if this breakdown helped you out, drop a like 👍 and share your thoughts in the comments 💬—I always appreciate the feedback!

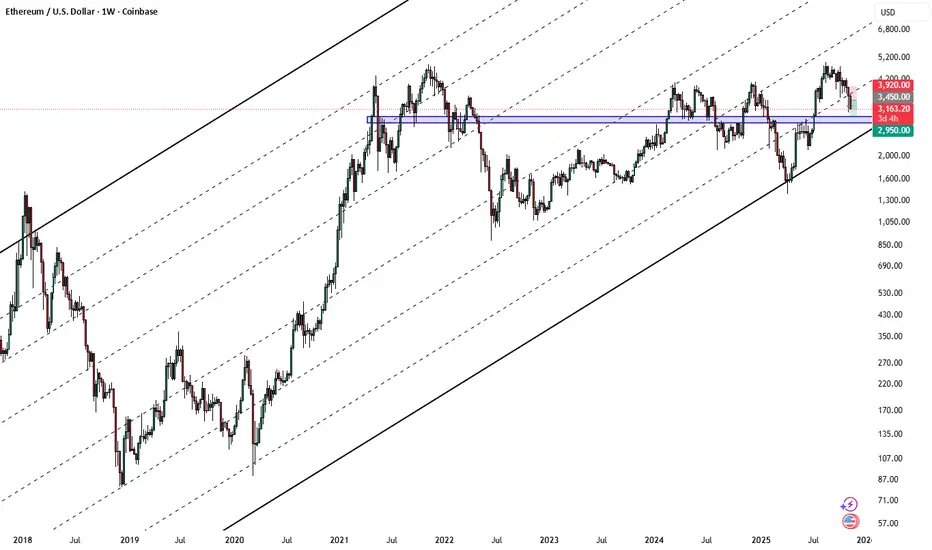
Why my ETH Holding has grownIn my last ETH update when the price was at $1700 and it looked as if the world was crashing, I mentioned I thought ETH was going to set a new ATH and so far it did but not at the price area I was expecting. I also did mention that I expected a return to around $3000 which is close to where it currently is.
All that said, I have had more time to look at the ETH chart and I think I may have been less bullish than I should have and as a result I grew my ETH holding since then. A few things I would like to point out.
One of which I mentioned in my last update. Looking at the ETH chart, it looks too similar to the gold chart with the ABC shakeout that gold went into before the massive rally.
Imagine holding GLD from Aug 2023 and selling in Oct 2023 because you could no longer handle the pain at this point below?
Now imagine those that held during this time, the fear and uncertainty they would have gone through. Personally, I think that is what the bookmakers are doing to ETH holders. If you believe the narrative that every asset will be tokenized and it ETH is the most trusted, then it makes sense to shake as many people out as possible before the GLD like rally.
Secondly, (although its a toss up) the action ETH is displaying now is similar to that of 2018 to 2020 and that we are in Sep-Oct of 2020 as you can see from the main chart and below as well.
Finally, the one bearish scenario is that we are doing the gold option but that we fail like this stock (PSNL) once we go and set a new ATM from here.
I had noticed the-same gold pattern and traded it but luckily I sold just before the failed breakout (so far) and you can clearly see the ABC pattern exactly like GLD before the breakout.
This is not a financial advice and I am not asking you to buy ETH. Just my opinion.
Please like, share and leave a comment.

#ETH/USDT : Rebound Setup from ascending channel Support#ETH
The price is moving within an ascending channel on the 1-hour timeframe and is adhering to it well. It is poised to break out strongly and retest the channel.
We have a downtrend line on the RSI indicator that is about to break and retest, which supports the upward move.
There is a key support zone in green at the 2930 price level, representing a strong support point.
We have a trend to stabilize above the 100-period moving average.
Entry price: 3064
First target: 3100
Second target: 3168
Third target: 3260
Don't forget a simple money management rule:
Place your stop-loss order below the green support zone.
Once you reach the first target, save some money and then change your stop-loss order to an entry order.
For any questions, please leave a comment.
Thank you.

$ETH Macro planI made this CRYPTOCAP:ETH cheatsheet. I'm looking to bid 2900-2700 area. As you can see we lost the level on weekly timeframe. And retesting it this week. A close below means we will likely go to my marked area.

ETH Hits 3K Target – Rebound Likely, Correction Not Over Though1. What Happened Since the Last Update
In my previous ETH analysis, I warned that if Ethereum loses the 3700 support zone, the probability of a drop toward 3000 becomes very high.
That scenario played out perfectly — the 3700 level failed, and price has now reached the 3K zone in recent days.
2. The Key Question Now
Is this the end of the correction, or just the first leg?
From my perspective, the overall correction is probably not finished yet. However, the 3000 area is a major support level, both technically and psychologically, so a bullish rebound from here is very likely.
3. Technical Outlook
Even inside a larger corrective structure, ETH can easily rally $230–$350, or even more, from these levels before deciding the next direction.
Key levels to monitor:
-Support: 3000 → then 2900 (preferred buy zone)
- Upside target: 3300
- Invalidation: A clean daily close below 2800 would weaken the bullish rebound scenario
4. Trading Plan
For the short term, I will look to buy preferably below 2900, targeting 3300 on the bounce.
This is not a long-term trend reversal call — it is a tactical long setup inside a broader correction.
5. Conclusion
ETH has reached the downside target discussed weeks ago. A rebound is likely from here, but the larger correction may not be over yet.
Short-term, buying dips around 2900 makes sense for a bounce toward 3300
ETHUSD – Bearish Channel Respect, Flag Breakdown SetupHi
The chart illustrates a clean, structured bearish trend where price continues to respect a broad descending channel. Each major reaction level and pattern aligns well with the larger downtrend, indicating that sellers are still in control.
Price recently tapped a key flip area near the upper boundary of the channel, a crucial zone where previous support has turned into resistance. The rejection from this area confirmed a strong supply and initiated a sharp decline, marked on the chart as the flagpole.
Following the impulse drop, the market entered a consolidation range, forming a classic bear flag structure. Price corrected roughly one-third of the flagpole; a typical retracement depth before continuation in a downtrend.
The drawn projection suggests a bearish continuation from the consolidation box, with the price expected to break lower. If momentum follows the channel’s trajectory, ETH could descend toward the first S&D zone, which aligns with the lower boundary of the macro channel. The marked target around 2848 sits near a liquidity and demand cluster, making it a logical tap point before any significant reversal or larger breakout attempt.
Disclaimer: As part of ThinkMarkets’ Influencer Program, I am sponsored to share and publish their charts in my analysis.

Inverse HnSImagine if CRYPTOCAP:ETH inverse Head and Shoulder plays out.
This would be a good 2026 for CRYPTOCAP:ETH

$ETH following my macro planCRYPTOCAP:ETH is following my macro plan. I shorted it on the retest with a stoploss slightly above the highest wick of previous week. This was a simple 13% so far. This is why I like high time frame trading it shows you more than just noise on short timeframe charts.
$TAO Long 🟩 Entry Zone: 330$ - 320$
🎯 Targets:
1️⃣ 345$
2️⃣ 360$
3️⃣ 380$
4️⃣ 400$+
🔻 Stop-Loss: Below 305$

Ethereum Eyes $5K on Rate Cuts Hopes & U.S. Shutdown ResolutionEthereum (ETH/USD) continues to show resilience as macroeconomic conditions begin to favor risk assets. With the U.S. Federal Reserve expected to cut interest rates by 25–50 basis points in December, investors are gradually rotating back into crypto, anticipating improved liquidity and higher capital inflows. Lower interest rates typically weaken the dollar and boost speculative assets like ETH and BTC, making this a potential catalyst for Ethereum’s next bullish leg.
Additionally, progress toward resolving the U.S. government shutdown, which has lingered for weeks, is helping stabilize investor sentiment. Once uncertainty around fiscal operations fades, institutional activity is expected to pick up across both traditional and digital markets — further supporting Ethereum’s recovery momentum.
On-chain fundamentals remain strong. Ethereum’s staking deposits continue to rise, now exceeding 33 million ETH locked in validator contracts. This sustained demand reduces circulating supply and underpins long-term price stability. Meanwhile, the Ethereum network maintains its dominance in decentralized finance (DeFi), non-fungible tokens (NFTs), and Layer-2 scaling activity, positioning it as the backbone of Web3 infrastructure even amid increasing competition.
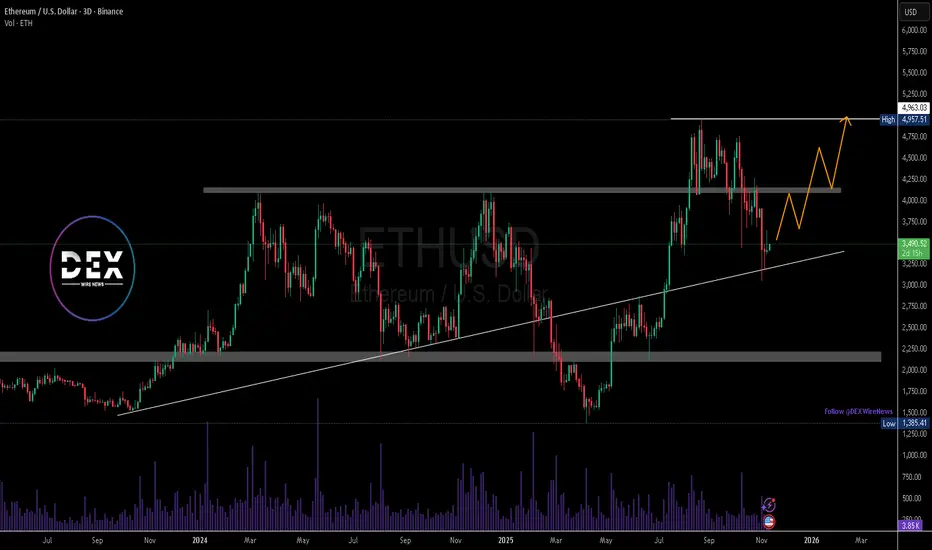
Technically, ETH/USD has bounced from the $3,200 support zone, aligning with a long-term ascending trendline. The chart shows potential for a sustained push toward the $4,150 resistance before retesting and targeting the $5,000 high. A clear daily close above this level would confirm a continuation of the larger bullish structure and could open the door to new all-time highs in 2026 if macro tailwinds persist.
Overall, Ethereum’s fundamentals and technicals are converging at a favorable point, and with rate cuts on the horizon and fiscal fears fading, ETH may be preparing for a powerful rally into Q1 2026.
#ETH/USDT Ethereum analysis#ETH
The price is moving within an ascending channel on the 1-hour timeframe and is adhering to it well. It is poised to break out strongly and retest the channel.
We have a downtrend line on the RSI indicator that is about to break and retest, which supports the upward move.
There is a key support zone in green at the 3350 price level, representing a strong support point.
We have a trend of consolidation above the 100-period moving average.
Entry price: 3397
First target: 3445
Second target: 3502
Third target: 3570
Don't forget a simple money management rule:
Place your stop-loss order below the green support zone.
Once the first target is reached, save some money and then change your stop-loss order to an entry order.
For any questions, please leave a comment.
Thank you.

IS CRYPTOCURRENCY BACK AT IT?Most cryptocurrency are at the range/point of reversal back to the top. With much anticipation and investment made we will be looking at a new ATH. This is followed by a tap into the monthly IRL especially for markets like BTC,ETH and others in line with a strike of reversal. We will hope to see further confirmations as there has been a 4hr market shift and a sweep above last Friday high gearing it down to a smart money support zone for an opportunity to buy, invest and HODL.
FOLLOW FOR MORE TIPS

ETH/USD Bearish trend analysis Read The captionSMC Trading point update
Technical analysis of (ETH/USD) on the 4-hour timeframe — aclassic retracement and continuation setup. Here's the breakdown:
---
1. Market Structure
ETH is currently in a clear downtrend — forming lower highs and lower lows.
The overall direction remains bearish, confirmed by price trading below the 50 EMA and 200 EMA.
Both EMAs are also sloping downward, reinforcing bearish momentum.
---
2. Correction Phase
After a sharp drop, ETH formed a falling wedge (a short-term corrective pattern).
It has broken out upward from that wedge — typically signaling a temporary retracement (pullback before continuation).
---
3. Key Zone (Supply / Rejection Area)
The blue box marks the supply zone or Fibonacci retracement area (0.62–0.79).
This zone also overlaps with the EMA 50 and EMA 200, creating strong confluence resistance.
The red arrow points to where a potential bearish reaction is expected — around $3,550–$3,700.
---
4. Expected Scenario
ETH may continue slightly higher to retest the Fibonacci 0.705–0.79 region.
Then a reversal (sell setup) is expected, leading to another leg down following the prevailing trend.
The target point for this bearish move is around $2,997, aligning with a previous liquidity and support zone.
---
5. Summary
Trend: Bearish
Bias: Short-term retracement → continuation lower
Key Resistance (Sell Zone): $3,550 – $3,700
Target: $2,997
Invalidation: Break and close above $3,863 (200 EMA + previous high)
Mr SMC Trading point
---
Trading Idea Summary:
“ETH remains in a downtrend. After a wedge breakout, a retracement toward the 3.55K–3.7K supply zone is likely before the next bearish continuation toward 3K. Sellers should look for confirmation signals near the resistance area.”
---
please support boost 🚀 this analysis

#ETH/USDT Does this scenario cross your mind? What if…#ETH
The price is moving in a descending channel on the 1-hour timeframe and is expected to break out and continue upwards.
We have a trend to stabilize above the 100-period moving average again.
We have a downtrend on the RSI indicator, which supports an upward move if it breaks above it.
We have a key support zone in green that pushed the price higher at 3186.
Entry price: 3230
First target: 3286
Second target: 3350
Third target: 3421
For risk management, don't forget your stop-loss and money management.
The stop-loss should be below the green support zone.
Upon reaching the first target, take some profits and then change your stop-loss order to an entry order.
For any questions, please comment.
Thank you.

ZKUSDT - A long upward journey is about to beginWe literally caught the bottom in the previous analysis — no doubt about it.
The chart looks extremely bullish and is showing massive upward momentum.
There’s a huge falling wedge pattern that has broken out and been successfully retested on the daily timeframe, with a potential target of 5x from here.
Best Regards:
Ceciliones🎯

ETH-----Sell around 3475, target 3408 areaETH Contract Technical Analysis (November 6th):
On the daily chart, yesterday's close was a small positive candle, with a pattern of consecutive negative candles followed by a single positive candle. The price is below the moving average, and the accompanying indicators are in a death cross, indicating a clear downtrend. Yesterday's rebound was a correction after a significant drop, with the price correcting back to the moving average and facing secondary downward pressure – a common and predictable pattern. On the hourly chart, the rebound after the decline lacks strength and continuity, making it unlikely to establish a short-term trend. Therefore, intraday trading is expected to be range-bound, with the European session likely to see further downward pressure.
Today's ETH Short-Term Contract Trading Strategy:
Sell at 3475, stop-loss at 3510, target 3408.

Ethereum Analysis – November 03, 2025Welcome to DIBA PRISM Daily Analysis 💫
Ethereum is currently in a bullish phase 📈 — compared to its previous market cycles and Bitcoin’s recent performance, ETH still shows room for further upside 🚀
Right now, Ethereum is in a corrective phase, and if it forms a higher low relative to the previous one, we can start looking for potential entry points 🎯
At the moment, price has reached a key zone, so it’s best to wait and observe Ethereum’s reaction before making any move 👀
Patience and timing will be the keys to catching the next big move ⚡
Disclaimer:
This content is for informational purposes only and does not constitute financial or investment advice. © DIBAPRISM
Larry D.Kohn

#ETH/USDT Ethereum at a Crossroads: Accumulation vs. Profit-Tak#ETH
The price is moving within an ascending channel on the 1-hour timeframe and is adhering to it well. It is poised to break out strongly and retest the channel.
We have a downtrend line on the RSI indicator that is about to break and retest, which supports the upward move.
There is a key support zone in green at the 3663 price, representing a strong support point.
We have a trend of consolidation above the 100-period moving average.
Entry price: 3720
First target: 3750.45
Second target: 3815.15
Third target: 3885.60
Don't forget a simple money management rule:
Place your stop-loss order below the green support zone.
Once the first target is reached, save some money and then change your stop-loss order to an entry order.
For any questions, please leave a comment.
Thank you.

GBPCAD on the Rise.GBPCAD should be rising this week and potentially getting up to the RESISTANCE zone or close to it this month.

ETH-----Sell around 3890, target 3830 areaETH Contract Technical Analysis (November 3rd):
On the daily chart, yesterday's close was a small positive candle. While the candlestick pattern shows consecutive positive days, the momentum and continuation are weak, and the price is below the moving averages. The accompanying indicators are showing a death cross, indicating a clear downward trend. Therefore, the trading strategy remains sell. On the hourly chart, the resistance level is around 3920. The current price has rebounded to near the 4-hour moving average resistance level. Given the clear downward trend, further upward movement is unlikely. Therefore, the focus for today and the European session should be on a break below support levels.
Today's ETH Short-Term Contract Trading Strategy:
Sell at 3890, stop loss at 3930, target 3830.

$ETH UPDATE Nothing has changed for Ethereum price still holdiCRYPTOCAP:ETH UPDATE
Nothing has changed for Ethereum price still holding below the crucial $4K zone. As long as ETH stays under this level, the remaining downside targets are likely to be hit soon. Stay patient the chart is still playing out exactly as expected.

ETHUSDT: Short-Term Pullback Toward Trendline Before PotentialHi guys!
On the current 1h chart, Ethereum shows a clear structure of recovery following a liquidity sweep marked as “Hunting happened.” This move indicates that liquidity below the previous lows has already been collected, creating a potential base for a short-term bullish correction.
Price is currently consolidating above a minor support zone (highlighted in pink), showing a possible accumulation phase. The projected path suggests a potential bullish move toward the major supply zone around $4,080–$4,180, which aligns with the descending trendline acting as dynamic resistance.
However, given the overall bearish market structure and the dominance of the descending trendline, the area around $4,100 could serve as a strong reaction zone. A rejection from this level would likely confirm continuation of the broader downtrend, with a possible retracement toward the $3,700–$3,750 area.
