ETH-----Sell around 1825, target 1750 areaTechnical analysis of ETH contract on April 4: Today, the daily level of the large cycle closed with a small positive line yesterday, and the K-line pattern was a single positive line with continuous negative lines. The price is still below the moving average and is obviously suppressed. The fast and slow lines of the attached indicator continue to close negative today, so the pattern will cross downward. Therefore, the general trend remains unchanged and continues to be bearish. Trading remains short-term and risk control is done well; the short-term price decline yesterday broke the previous low of 1750, but did not continue. The current price fluctuates within the range and there is not much movement. From the perspective of various technical indicators, the four-hour chart is a continuous negative line, and the intraday price is suppressed, so the trend is still bearish, and the previous correction high is near 1850.
Today's ETH short-term contract trading strategy: sell at the 1825 area, stop loss at the 1855 area, and target the 1750 area;
Ethshort

ETH/USDT:UPDATEHello dear friends
Given the price drop we had, a head and shoulders pattern has formed within the specified support range, indicating the entry of buyers.
Now, given the good support of buyers for the price, we can buy in steps with capital and risk management and move towards the specified targets.
*Trade safely with us*

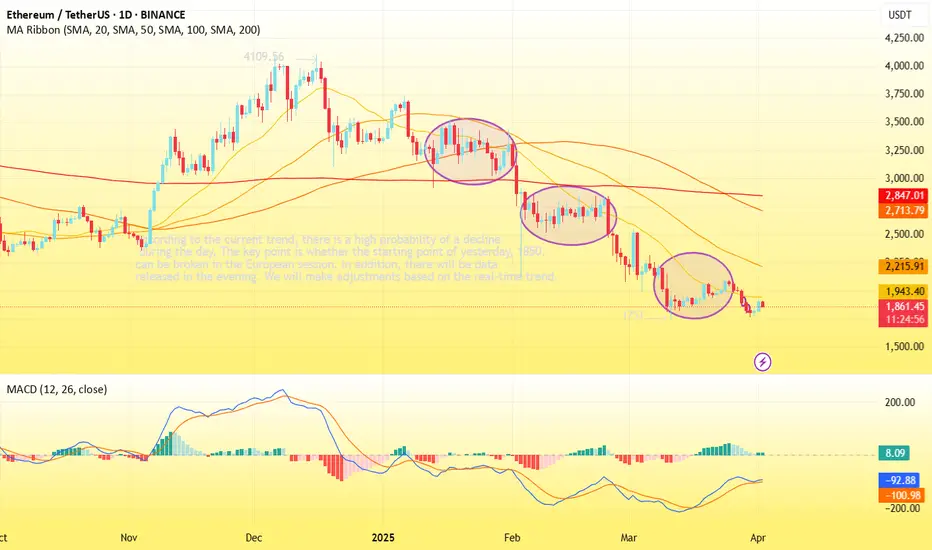
Ethereum Price Analysis: Is a Drop to $1,550 Imminent This Week?As of April 3, 2025, Ethereum (ETH) is trading at approximately $1,838 (based on recent market data), reflecting a precarious position in the crypto market. After a volatile start to the year, ETH has shed over 44% year-to-date and is now testing critical support levels. This analysis explores the potential for an 11% drop to the $1,550 range within the next few days (by the end of this week, April 6), driven by technical breakdowns, bearish on-chain signals, and broader market pressures.
Technical Analysis: Bearish Signals Mounting
On the daily chart, ETH has been struggling to maintain momentum above the $1,800 psychological level. After a brief bounce from its yearly low of $1,760 on March 11, the price has failed to reclaim the $2,000 mark—a key resistance zone that previously acted as support in late 2024. Here’s a breakdown of the technical setup:
Key Support Breach: The $1,800–$1,877 range has been a critical support zone, aligning with the 61.8% Fibonacci retracement level from the December 2024 high of $4,106 to the March 2025 low of $1,759. A close below $1,770 this week would confirm a breakdown, opening the door to the next major support at $1,550–$1,600, a level last tested in October 2023.
Bearish Pattern Confirmation: The 2-hour chart shows ETH completing a corrective structure (likely an A-B-C wave) after its March 19 peak at $2,070. If wave C mirrors wave A in length—a common Elliott Wave scenario—the target aligns near $1,550, coinciding with the 1.61 external Fibonacci retracement of the recent bounce.
Moving Averages: ETH is trading below both its 50-day SMA ($2,321) and 200-day SMA ($3,010), signaling a sustained bearish trend. The 50-day SMA, now sloping downward, acts as dynamic resistance, capping any relief rallies. A failure to reclaim this level soon reinforces the downside risk.
RSI Oversold but Weak : The 14-day Relative Strength Index (RSI) sits near 30, indicating oversold conditions. However, in strong downtrends, RSI can remain oversold for extended periods, as seen during ETH’s 2022 bear market. Momentum remains weak, with no bullish divergence to suggest an imminent reversal.
Target Projection : A drop from $1,838 to $1,550 represents an 11% decline, achievable within 2–3 days if selling pressure accelerates. The $1,550 level aligns with historical support and the long-term 78.6% Fibonacci retracement, making it a plausible target.
On-Chain Data: Selling Pressure Intensifies
On-chain metrics paint a grim picture, supporting the bearish technical outlook:
Exchange Reserves Rising: Ethereum’s exchange reserve has ticked up from 18.3 million ETH, reversing a multi-month decline. This suggests long-term holders or institutions are moving assets from cold storage to exchanges, potentially preparing to sell.
Whale Activity: Recent data shows significant whale sell-offs, with large transactions (over 100 ETH) spiking in the past 48 hours. This aligns with posts on X noting whale distribution near current levels, adding downward pressure.
DeFi Weakness: Ethereum’s dominance in decentralized finance (DeFi) is waning, with total value locked (TVL) dropping as competing Layer-1 chains gain traction. Reduced network activity undermines ETH’s utility-driven demand, a key pillar of its value proposition.
Staking Dynamics: While staking activity increased post-Shapella upgrade, the anticipated selling pressure from unstaked ETH continues to linger, especially as macroeconomic uncertainty prompts profit-taking.
Market Sentiment: Fear Dominates
The broader crypto market is reeling from macroeconomic headwinds. The U.S. Core PCE Index rose to 2.8% in February, exceeding the Federal Reserve’s 2% target, signaling persistent inflation. Higher interest rates for longer dampen risk-on assets like cryptocurrencies. Posts on X reflect growing pessimism, with some traders eyeing sub-$1,000 levels if $1,760 fails—a sentiment echoed by Ethereum’s 7% drop this week alone.
Bitcoin (BTC), trading near $82,000, has also faltered, dragging altcoins lower. ETH’s correlation with BTC remains high (around 0.9), and a failure to hold $80,000 for BTC could amplify ETH’s decline. Additionally, the lack of immediate catalysts—such as ETF approvals or major network upgrades—leaves ETH vulnerable to further capitulation.
Price Scenarios and Key Levels
Bearish Case (Base Scenario): A daily close below $1,770 triggers a swift move to $1,550–$1,600 by April 6. Volume spikes and panic selling could push it lower, though $1,550 offers strong historical support.
Bullish Rejection: A reclaim of $2,070 (the March 19 high) invalidates the bearish setup, potentially sparking a relief rally to $2,250. This seems unlikely without a significant BTC breakout or positive news.
Invalidation: A close above $2,120 this week would negate the short-term bearish thesis, though resistance at the 50-day SMA ($2,321) caps upside potential.
Trading Strategy
Entry: Short ETH below $1,770 with confirmation of increased volume.
Target: $1,550 (11% drop), with a stretch goal of $1,500 if momentum persists.
Stop Loss: $1,911 (intraday high from April 2), limiting risk to 4–5%.
Risk/Reward: Approximately 2.5:1, assuming a $1,550 target.
Conclusion
Ethereum’s technical setup, coupled with bearish on-chain signals and a fearful market, suggests an 11% drop to $1,550 is plausible by the end of this week (April 6, 2025). The $1,770 level is the line in the sand—watch it closely. While oversold conditions hint at a potential bounce, the lack of buying conviction and macro pressures tilt the odds toward further downside. Traders should monitor BTC’s price action and exchange inflows for confirmation. Stay nimble, and let the charts guide your next move.

ETH-----Sell around 1900, target 1820 areaTechnical analysis of ETH contract on April 2: Today, the large-cycle daily level closed with a small positive line yesterday, and the K-line pattern was a single positive line with continuous negatives. The price was at a low level, and the attached indicator was a golden cross with a shrinking volume, but it can be seen that the fast and slow lines are still below the zero axis, which is an obvious price suppression, and the current pullback trend is only a correction performance, which is difficult to continue and difficult to break. This is the signal, so the downward trend remains unchanged; the correction trend of the four-hour chart for two consecutive trading days is also completed. At present, the K-line pattern is continuous negative, and the price is under pressure and retreats. Whether the European session can break down is very critical. The short-cycle hourly chart of the previous day's US session hit a high in the early morning and retreated under pressure in the morning. The current K-line pattern is a continuous negative and the attached indicator is dead cross running. It is still bearish during the day. The starting point is near the 1850 area. The European session depends on the breakout of this position.
Therefore, today's ETH short-term contract trading strategy: sell at the pullback 1900 area, stop loss at the 1930 area, and target the 1820 area;
ETHUSD SELLSETHUSD is bearish. Price is consistency making LHs & LLs. 1539.00 area will be the next support hit.

ETH-----More around 1865 target 1800 areaTechnical analysis of ETH contract on March 30: Today, the large-cycle daily level closed with a small negative line yesterday, the K-line pattern continued to fall, the price was below the moving average, and the attached indicator was running with a golden cross and shrinking volume. The big trend was still very obvious, but I would like to remind you that the current price deviates from the moving average, and if there is a rebound trend in the future, it is also a correction trend. Don't be misled; the short-cycle hourly chart showed that the European market fell and the US market continued to break the low yesterday, and the morning support rebounded and corrected. The current K-line pattern continued to rise, and the attached indicator was running with a golden cross, so it still needs to be corrected within the day, and the high point of the US market correction yesterday was in the 1865 area.
Today's ETH short-term contract trading strategy: sell at the rebound 1865 area, stop loss in the 1895 area, and target the 1800 area;


ETH(20250328) market analysis and operationMarch 28 Ethereum (ETH) contract technical analysis: Today, the large-cycle daily level closed with a small negative line yesterday, the K-line pattern continued to fall, the price was below the moving average, and the attached indicator was running in a golden cross with a shrinking volume. The general trend is still very obvious. According to the current trend, the trend of the second big drop I mentioned earlier may come early, and next week is the focus, because the time for correction in exchange for space is basically consumed at present; the short-cycle hourly chart fell under pressure the day before, and the European session continued but did not break down, so the US session was still volatile. The correction high point was under pressure for the second time this morning. The current K-line pattern is continuous and the attached indicator is running in a dead cross, so there is a high probability that it will fall during the day. Whether the European session can break the low is the key.
Today's ETH short-term contract trading strategy: sell directly at the current price of 2005 area, stop loss in the 2035 area, and target the 1940 area;

ETH-----Sell near 2010, target 1920 areaTechnical analysis of ETH contract on March 27: Today, the large-cycle daily level closed with a small negative line yesterday, the K-line pattern was a continuous positive single negative, the price was still at a low level, the attached indicator was a golden cross with a shrinking volume, and the general trend was still obviously downward. The current pullback trend is to prepare for the next big drop; the technical trend of the four-hour chart has touched the high point of 2110 twice in a month, which is quite obvious. The current K-line pattern is a continuous negative, and the attached indicator is a dead cross, so there is a high probability that there will be a continued retracement trend; the short-cycle hourly chart fell in the European session yesterday and the US session continued to break the low, and the high point of the correction was near the 2025 area. Similarly, today we need to see a continued decline, and the pullback cannot break the high point of the correction.
Today's ETH short-term contract trading strategy: sell at the current price in the 2010 area, stop loss in the 2040 area, and target the 1920 area;

ETH/USDT : BUY LIMITHello friends
Given the price growth, now that the price is correcting, you can buy in steps and be careful to ensure that capital management is followed.
*Trade safely with us*

ETH Chart - SECRET in the INVERTETH is losing ground quickly after a nasty bearish pattern formed in the weekly.
The bearish M-pattern we're currently observing in the macro timeframe:
We know this is a bearish patter, not only because we've seen it many times before but also because it is the opposite of the W-Bottom. (we can actually confirm this by flipping the chart):
In this case, the bullish confirmation would have been a support retest of the neckline:
And so, if we flip it again back to the original view - the opposite can be true. As we get rejected on the resistance line, an even lower price is likely:
____________________
BINANCE:ETHUSDT

The ETHUSD market is bullishETHUSD has currently successfully broken through the resistance level of 2,100 and has re-entered a new range.
The ETHUSD market is bullish. The current price is 2,075, and the intraday fluctuation range is between 2,044 and 2,080. There are signs that ETHUSD has initially formed a bottom. Judging from the 4-hour candlestick chart, the price is attempting to break through upwards, with the key resistance level at 2,160.
Looking ahead to 2025, the expected price range of ETHUSD is between 2,904 and 4,887. This week, ETHUSD has shown a strong and positive performance. In the following period, the key focus should be on whether ETHUSD can break through the key resistance level of 2,160, which will play a decisive role in its short-term and medium-term trends.
💎💎💎 ETHUSD 💎💎💎
🎁 Buy@2040 - 2050
🎁 TP 2070 2080 2090
The market has been extremely volatile lately. If you can't figure out the market's direction, you'll only be a cash dispenser for others. If you also want to succeed,Follow the link below to get my daily strategy updates

Ethereum (ETH/USDT) 1D Chart Update ETH is still trading inside a descending channel, showing signs of a possible reversal. The price is bouncing off support levels around $1,750-$1,830, with a possible retest of higher resistance levels. The 50-day moving average (red line) is acting as a dynamic resistance above the price.
Bullish scenario: ETH needs to sustain above $1,830 to confirm a short-term correction. If ETH breaks the $2,200-$2,400 resistance zone, a rally toward $2,800-$3,000 could follow.
Bearish scenario: Rejection at the resistance could push ETH back towards $1,830 and possibly $1,750. A loss of $1,750 could trigger a further decline towards $1,600.
Resistance: $2,200, $2,400, $2,800
Support: $1,830, $1,750, $1,600
If you found this analysis helpful, hit the Like button and share your thoughts or questions in the comments below. Your feedback matters!
Thanks for your support!
DYOR. NFA

ETH/USDT BUYHello friends
Given the price support, we can buy at two levels that we have specified for you.
The price targets have also been specified...
Please observe capital management.
*Trade safely with us*

How "Max Pain" Can Become Your Ally in ETH TradingImagine standing on the edge of a cliff, peering down at a raging river below. That’s the feeling traders experience as the options expiration date approaches. At this moment, all bets are off, and the market is primed for sharp movements. Have you ever wondered how to turn this uncertainty into an advantage?
Let’s break it down. The ETH market is buzzing with tension: open interest in options is soaring, and the ratio of in-the-money to out-of-the-money puts stands at 48% to 52%. This means nearly half of all puts have intrinsic value. Professional market participants, like skilled magicians, hedge their positions, transforming them into delta-neutral setups.
But how do they do this? Right, by buying futures! This is the hidden growth driver we’ve been witnessing over the past few days. While I won’t dive into other factors like news, it’s crucial to understand that this dynamic could be the key to success.
Now, let’s talk about “Max Pain.” The Max Pain level for this options series landed on the March 2nd trigger point, where we saw a powerful bullish candle. But are the bulls stuck there? I’m pretty sure they are. Now, we’re left to watch whether the market can break free from this grip.
Personally, I see an opportunity to open a short position. But let’s see if the “law of gravity” will hold true for Max Pain this time.
Stay tuned If you want to stay updated on forex and crypto trading nuances!

ETHUSD New trendETHUSD has currently successfully broken through the resistance level of 2,100 and has re-entered a new range.
Hold for the long term
💎💎💎 ETHUSD 💎💎💎
🎁 Buy@2050 - 2080
🎁 TP 2200 2300 2400 2500
The market has been extremely volatile lately. If you can't figure out the market's direction, you'll only be a cash dispenser for others. If you also want to succeed,Follow the link below to get my daily strategy updates

ETH(20250324) market analysis and operationTechnical analysis of ETH on March 24: Today, the large-cycle daily line level closed with a small positive line yesterday, and the K-line pattern showed a continuous rise, but the price is still at a low level. The fast and slow lines of the attached gold cross indicator are below the zero axis, so I am still bearish on the big trend, but there is a large demand for correction in time. When the time consumption space is completed, it may usher in the second largest downward trend. This is an inevitable trend law; the short-cycle hourly chart intraday price support rebound, the European session is under pressure after breaking through the high point and began to retreat. The K-line pattern is continuous, and the attached gold cross indicator is shrinking, so we should go short once in the evening.
Today's ETH short-term contract trading strategy: sell at the current price of 2085 area, stop loss at 2115 area, and target 2025 area;

ETH/USDT 1DAY CHART UPDATE !!ETH is still trading inside a descending channel, with the price close to key support.
Support Zone Holding: The $1,750–$1,830 area has provided a strong support base.
Ichimoku Cloud Resistance: The red Ichimoku Cloud above is acting as a crucial
resistance barrier.
Bullish Scenario:
If ETH breaks out of the descending channel, the first major resistance to watch is $2,400–$2,600 (cloud resistance).
A confirmed breakout could lead to a move towards $4,000+.
Bearish Continuation :
If ETH fails to break out, it could retest the $1,750–$1,830 support area.
A breakdown below $1,750 could open the door to lower levels around $1,600.
If you found this analysis helpful, hit the Like button and share your thoughts or questions in the comments below. Your feedback matters!
Thanks for your support!
DYOR. NFA

Chart Analysis Price Action:
The chart shows ETHUSD trading at 2,041.01, with a recent decline of -3.36 (-0.41%).
The high (HI) for the session was 2,044.00, and the low (L) was 1,664.36.
The price is currently near the session’s high, which suggests some resistance around the 2,044 level.
Trend:
The chart spans from 2009 to 2025, indicating a long-term uptrend for ETHUSD.
However, the recent price action (2024-2025) shows consolidation or a potential pullback, as the price is struggling to break above 2,044.
Key Levels:
Support: The low of 1,664.36 is a strong support level.
Resistance: The high of 2,044.00 is acting as a resistance level. If the price breaks above this, it could target higher levels.
Your short position at 2,037 is just below the resistance, which is a logical entry point for a short trade.
Momentum:
The price is currently in a slight downtrend, as indicated by the -0.41% decline.
The fact that the price is struggling to break above 2,044 suggests bearish momentum in the short term.

CRV/USDTHello friends
Due to the heavy price drop, buyers have been supporting the price well on the indicated support, which has caused a good price growth.
Now in the indicated support areas, you can buy in steps with capital management.
If you want to be with us in the Alt Season, send us a message.
*Trade safely with us*

Ethereum wooing toward 2022 lowsEthereum's momentum has been underwhelming to say the least. WIth network upgrades and future developments not showing a whole lot of pizzaz, Ethereum looks as it is heading toward 2022 lows near the $1,200 level. Is it a buy from there?

ETH/USDT Weekly Chart Analysis. The Ethereum (ETH/USDT) weekly chart suggests a potential bullish reversal from a key support area. Here are the details of the analysis:
Support area: Around $1,750 – $1,830, where the price recently rebounded.
Resistance levels:
First target: $4,015
Key resistance: $4,663, which marks a key breakout level.
ETH has bounced off historical support levels, indicating potential accumulation.
If the price sustains above $1,800, the next target is $4,015, followed by $4,663 if the momentum continues.
A break below $1,747 – $1,700 could lead to further declines, with the next strong support near $1,053.
Look for a confirmation of a breakout above $2,000 to confirm a strong uptrend.
Keep an eye on volume and indicators (RSI, MACD) for further confirmation of momentum.
Risk management is important in volatile market conditions.
If you found this analysis helpful, hit the Like button and share your thoughts or questions in the comments below. Your feedback matters!
Thanks for your support!
DYOR. NFA

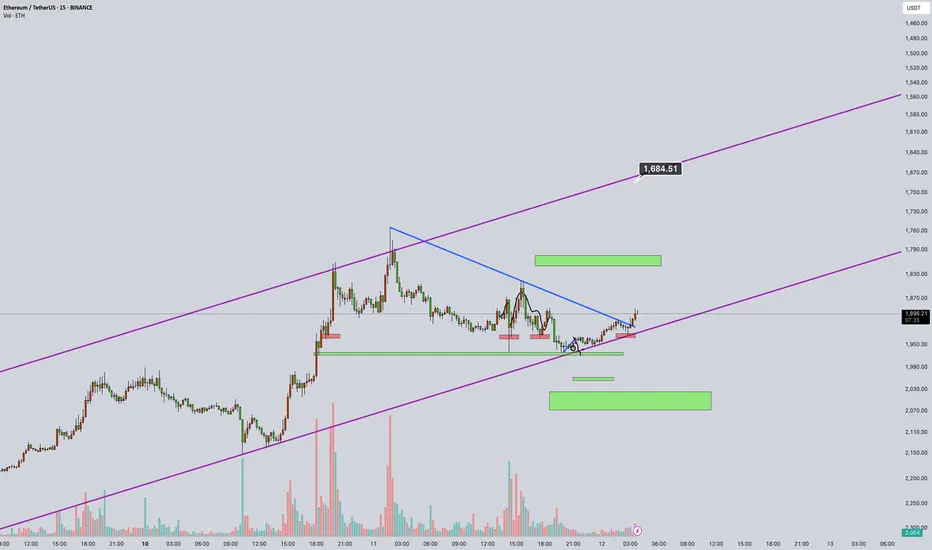
ETHEREUM ( SHORT TERM )Hello crypto community!
In this analysis, I’ve examined the Ethereum (ETH/USDT) 15M chart by inverting it.
It’s 12 March 2025, exactly 5 years since 12 March 2020, when Bitcoin crashed 55% in a single day, marking the “Black Thursday” that shook the market.
Now, the ETH chart shows the purple trendline as resistance (inverted to 1,684 USD) and green zones as support (inverted to 1,500-1,600 USD).
The pattern suggests a potential downturn; a break below the blue line could trigger a sharp pullback. Volume has risen by ~20% in the last hour, supporting this move.
Potential Scenario:
If resistance at 1,684 holds, the price may test support at 1,500-1,600, with a possible drop to 1,400. While not as severe as the 12 March 2020 crash, this week calls for caution. As a spot trader, I’m planning positions around the 1,600-1,500 range.
What do you think? Will ETH drop, or will the bull run continue? Share your thoughts below! 📉📈