ETHUSD SELL NOW 3990🔻 ETHUSD Short Setup – Entry: 3990
Ethereum is facing resistance near 3990, presenting a clean intraday short opportunity. Key bearish signals:
- 🔸 Price rejection at prior supply zone
- 🔸 Bearish divergence on RSI (1H)
- 🔸 Lower high structure forming below 4030
- 🔸 Volume fading on recent push
📉 Trade Plan:
- Entry: 3990
- Stop Loss: 4030
- Take Profit: 3910
Risk/reward ratio: 1:2 – ideal for disciplined scalpers and short-term swing traders. Watch BTC correlation and macro headlines for volatility spikes.
Ethshort

Eth USD SELL Trade Today🔻 ETHUSD Short Setup – Entry: 3965
Ethereum is showing signs of exhaustion near the 3965 resistance zone, setting up for a potential intraday pullback. Key bearish signals include:
- 🔸 Double top formation around 3965
- 🔸 Bearish divergence on RSI (1H/4H)
- 🔸 Volume drop on recent push
- 🔸 Rejection from upper Bollinger Band
📉 Trade Plan:
- Entry: 3965
- Stop Loss: 4005 (above resistance)
- Take Profit Zones: 3900 / 3840 / 3785

ETH/USDT -> Clear Head & Shoulders → bearish biasHello guys!
Pattern: obvious Head & Shoulders on the 4-hour. The neckline was taken out by a large bearish candle, which is a good confirmation of the breakdown.
Retest: price is testing the broken neckline/supply zone (blue box). The current action is a classic retest → if it gets rejected here again, probability favors more downside.
Target: the measured move projects into the red box; roughly ~$3,850 (range $3.7k–$3.9k depending on where you measure the neckline/head). This level also lines up with the last major resistance zone, so it’s a natural magnet.
Momentum: RSI showed divergence around the head and has dropped into oversold territory with a small relief bounce.
Invalidation: a clean, sustained reclaim and close back above the blue supply zone (above ~4.32–4.40k with conviction) would invalidate the immediate H&S bearish thesis and open the door for a deeper retrace.
-----------------------
A simple trade idea:
Short on a failed retest of the blue box (4.20–4.32k) after a bearish price candle.
Stop: just above the supply zone / last swing high.
Targets: scale profits into 3.9k then 3.8k (final target ~3.7–3.9k). Trail if price action turns constructive.
Manage risk: keep position sizing sensible.

Ethereum Price Hits 6-Week Low, But Here Lies An OpportunityAt press time, Ethereum is trading at $3,938, attempting to establish $3,910 as a support floor. This decline marks a crucial break below the $4,000 level, highlighting short-term weakness.
Given current signals, ETH may remain rangebound under $4,074 resistance until stronger bullish cues emerge. Market sentiment suggests consolidation rather than sharp recovery, keeping investors cautious.
However, if Ethereum flips $4,074 into support, a push toward $4,222 could follow. This move would require investor participation and sustained inflows to counter bearish momentum, ultimately invalidating the short-term negative outlook.

Ethereum (ETH/USDT) Weekly Chart UpdateEthereum (ETH/USDT) Weekly Chart Update
ETH is currently trading around $4026, down approximately 9.5% this week.
A long-term triangle breakout has occurred, and the price is now retesting this breakout zone.
Support levels: $3800 and $3500 (with the moving average).
Resistance levels: $ 4,500–$ 4,800 (short-term); if the momentum continues, the next major target would be $ 5,500–$ 6,000.
The overall trend remains bullish as long as ETH stays above $3500–$3600.
⚡ Summary:
ETH is currently experiencing a mid-term correction, but the long-term outlook remains bullish. Staying above support could pave the way for a move towards $5000+ in the coming months.
#crypto #ETH #BTC

Warning - Bitcoin bullish trend is over
Over the past 15 years, the cryptocurrency market has repeatedly witnessed exponential price surges in Bitcoin followed by altcoins—movements that sparked excitement and drew massive amounts of liquidity into the space.
However, the cycle that began in 2024 and will end in about 20 days has failed to meet the expectations of market participants. This time, altcoins were no longer able to attract capital as they once did, and more than 70% of enthusiasts have permanently turned away from the space. A significant part of this downturn stems from the actions and policies of major exchanges such as Binance, FTX, and others.
Altcoins have not only failed to gain value compared to Bitcoin’s 2023 prices but have also suffered sharp declines, with their downward trend still ongoing. Even Ethereum was unable to surpass its historic peak from 2021.
The market is now entering a dangerous slope for Bitcoin price depreciation, where predictions suggest that altcoins like **Dogecoin** could fall to $0.05, **Ethereum** to $1,100, **Solana** to $80, and **Toncoin** to $0.60.
This can be regarded as the worst experience in crypto history—not only for investors who will lose substantial portions of their capital but also for exchanges themselves, which, despite short‑term gains, will ultimately rank among the long‑term losers. Following this, the rate of new user acquisition in crypto will likely drop to one‑tenth of previous years, leaving the industry widely viewed as a **major scam** in the eyes of the public.

ETH Short Trade Trend: Bearish
Divergence: None
Continuation Pattern: Bearish Flag
Harmonics : AB=CD
Bias: Bearish
Scenario: Sell Stop entry at B point Breakout
*Trade Plan*
Stop Loss: 4220
Entry Level: 4040
TP1: 3860

$BTC short trade hit target !we go down more?Tp hit for BTC short i will close 70% of trade here ... if we loss this level we might see more downside ! what you think for new week ? we go down side more for crypto market?

Ethereum at Weekly Supply Zone – Possible Drop AheadHello everybody,
Price is currently at the weekly supply zone.
It has broken an upward trendline and pulled back to retest it.
A decline from this area is expected.
The most likely target is the nearest demand zone, around 3800.
Manage your risk and trade safe!

ETH/USDT SHORTBSL taken now its time for SSL to be taken, targeting POC of volume profile, could turn into a swing short if market continues drop this coming week.

ETH UPDATEHello friends
Well, you can see that due to the bearish market cycle, the downward steps have gradually become smaller and we have hit a higher ceiling at the specified support, which is a sign of a weak trend or price flooring. If this specified price floor is maintained, the price can move to the specified targets.
*Trade safely with us*

ETH BOUNCE at $4200 - Correction LIKELYAre you watching ETH in the daily timeframe 👀 ?
ETH is trading on a major support zone, and after a failed breakout here the price could likely be heading back towards the lower support area in the short term.
For the past 157 days, ETH has pretty much been trading UP only. We see this if we look at the price action from a daily timeframe over the past few months.
The price is likely to head lower towards the 4200 region where a bounce is possible - this will be a healthy cooldown for the short term.
________________________
BINANCE:ETHUSDT

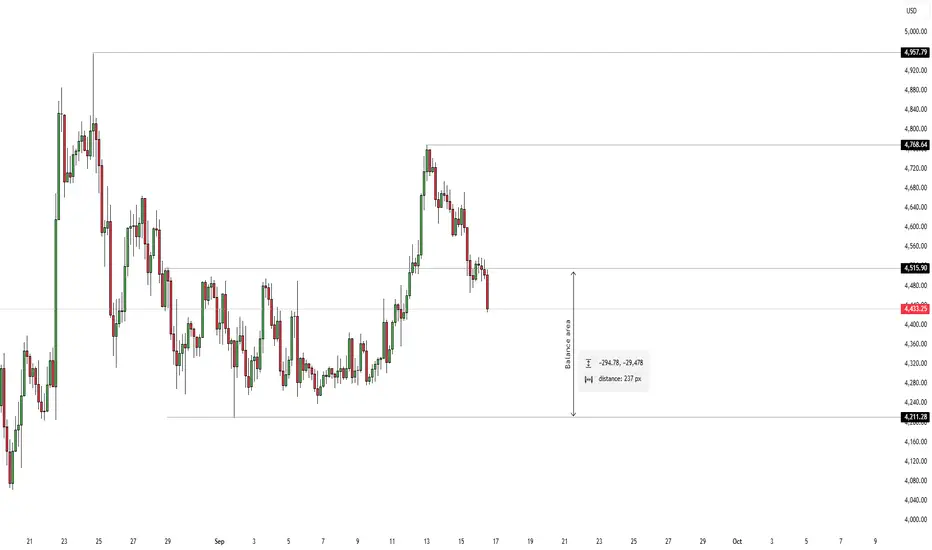
ETHUSD 4H HOURLY PROJECTION AND IDEA.The second in command in the crypto market is Eth, just broke a structure back into a previous Balance Area, which may mean price could be static for sometime and the Pair takes its lead and direction from its Head BTC, which is also on a downward move, but the overall direction of the market is Bullish, and currently price is within a previous range i expect price to stay within this range (Balance) lets see what price would do next.
HARD SHORTMy former analysis successfully landed to target zone. And now market wants a pull back.
1-Above there is low liqudation
2-Next week we will probably see a rate cut. thats why I am a little nervous abot open short
3-Till that day I think whales will chase cheap asset that is where my courage come from
4-Market wants to see a pull back
be careful about short you may just want to open long at the below
Always manage your own risks this is not a investment advise I am not responsible neither your loss nor profit.

ETHUSDT.PHello friends
Given the good growth we had, the price has made a 14% correction. If the specified support is maintained, the price can see the specified targets. If the support is broken, the price can fall by another step. We have identified important support points for you.
*Trade safely with us*

#ETH/USDT Testing Wedge Breakout Amid Key Support#ETH
The price is moving within a descending channel on the 1-hour frame, adhering well to it, and is heading for a strong breakout and retest.
We have a bearish trend on the RSI indicator that is about to be broken and retested, which supports the upward move.
There is a major support area in green at 4480, which represents a strong support point.
For inquiries, please leave a comment.
We are in a consolidation trend above the 100 Moving Average.
Entry price: 4524
First target: 4585
Second target: 4645
Third target: 4715
Don't forget a simple matter: capital management.
When you reach the first target, save some money and then change your stop-loss order to an entry order.
For inquiries, please leave a comment.
Thank you.

ETH *UPDATE*Hello friends
Given the channel breakdown and the entry of buyers, it now seems that the price is in a pullback. In this case, the price pivots of the channel, which are now becoming supported, are expected to be good support and cause the price to grow and move with it to the specified targets.
*Trade safely with us*

#ETH/USDT –> Falling Wedge Breakout Within Ascending Channel#ETH
The price is moving within a descending channel on the 1-hour frame and is expected to break and continue upward.
We have a trend to stabilize above the 100 moving average once again.
We have a downtrend on the RSI indicator that supports the upward move with a breakout.
We have a support area at the lower boundary of the channel at 4500, acting as strong support from which the price can rebound.
We have a major support area in green that pushed the price upward at 4485.
Entry price: 4525
First target: 4545
Second target: 4573
Third target: 4604
To manage risk, don't forget stop loss and capital management.
When you reach the first target, save some profits and then change your stop order to an entry order.
For inquiries, please comment.
Thank you.
Ethereum Road Ahead of September 17thGood morning. As I wrote in my previous post, this is my first time here. If you like it, please subscribe and support the post.
Weekends are a good time for market makers, when the market is very weak. Before pushing the price up, they need to collect liquidity by hitting long stop-losses, so that no one stands in the way of growth after a possible rate cut.
All the major short positions above have already been closed. Now it’s time to move down. The extreme downside target is $4,200. Market makers don’t necessarily have to push it all the way there—they may stop earlier. It all depends on whether long traders panic and start closing their positions, or keep holding on until the “bitter end.”
The market should always be analyzed in real time, not by “fortune-telling on daisies.” Please don’t forget to subscribe and support my post. That will determine whether it makes sense for me to keep writing further.
Wishing you a great weekend and all the best!

ETH USD SELL NOW 4510ETHUSD SELL @ 4510
ETHUSD – Bearish Setup at 4510 | Reversal Play
Ethereum has reached a key resistance zone near 4510, where price action shows signs of exhaustion and rejection. Momentum indicators are flashing bearish divergence, and volume is fading—setting up a clean short opportunity.
📌 Trade Parameters
- Entry: 4510
- Stop Loss: 4550 (above resistance wick)
- Take Profit: 4400 (near support zone)
- Risk/Reward Ratio: ~2.75:1
📊 Technical Confluence
- Bearish divergence on RSI
- MACD histogram fading after bullish impulse
- Rejection from upper trendline
- Volume drop on bullish candles
- Lower high structure forming on 1H chart
💬 Trade Narrative
ETHUSD has rallied into a resistance zone but failed to break above 4510 with strength. This setup targets a retracement toward 4400, with tight risk above 4550. If price breaks below 4475, expect acceleration toward the target. Setup remains valid unless bulls reclaim 4550+ with volume.
This trade favors short-term tactical execution, especially with BTC showing signs of consolidation and broader crypto sentiment cooling off.
📣 Trader’s Note:
Watch for confirmation on lower timeframes (15M/1H). If price breaks below 4475 with momentum, consider trailing stop or scaling in.

ETH: Step by StepOn September 6, I opened a short on the 1-hour chart from $4294 — the decision was based on the indicator’s readings. The move down to $4227 allowed me to close the first target. About $70 difference per coin. Part of the profit was realized, part was left to the market — and that’s part of the plan.
The key here is not guessing but consistency. The indicator outlined the key levels, highlighted the control zone, and I followed the scenario step by step. This approach removes chaotic decisions and reduces emotional pressure.
When you see the structure of the move in advance, holding a position becomes easier. The plan turns the market from chaos into a map, where it’s clear when to take profit and when to stay calm. It helps to remain in the trade longer and make decisions without rushing.
The market will always remain unpredictable. But when actions are built on a system, results are shaped not by luck, but by discipline and the ability to move step by step.

#ETH/USDT towards upper levels#ETH
The price is moving within a descending channel on the 1-hour frame, adhering well to it, and is heading for a strong breakout and retest.
We have a bearish trend on the RSI indicator that is about to be broken and retested, which supports the upward breakout.
There is a major support area in green at 4260, which represents a strong support point.
For inquiries, please leave a comment.
We are in a consolidation trend above the 100 Moving Average.
Entry price: 4300
First target: 4333
Second target: 4378
Third target: 4427
Don't forget a simple matter: capital management.
When you reach the first target, save some money and then change your stop-loss order to an entry order.
For inquiries, please leave a comment.
Thank you.

ETHFI ; Has purchase confirmation been given?Hello friends
Given the decline we had, the price has been in a good support and then managed to break through its resistance and now in the pullback we need to see the reaction of the buyers. If the Fibonacci support is maintained, the price can move to the specified Fibonacci steps, which has been specified.
Don't forget capital and risk management.
*Trade safely with us*
