ETH - Bearish correction awaited! remember my view on #ETH 📉
Nothing looks bullish here, under 4510$, especially 4600$
Very neutral area yet. (short term).
Again, it looks more like a bearish retest HTF, and there is a huge gap to be fill if price isn"t able to hold above 4250.
Medium term setup:
likely a correction to hit the 4050 - 4000$ support. 📉
A deeper correction toward 3800$ levels would also be a good spot & key demand zone for a next bull rally.
Money rotation into some #alts ?
Ethshort

ETHUSDTI think moved trend by break 4485$ resistance and 4250$ support in BINANCE:ETHUSDT .
Support: 4250 - 3900 - 3510
Resistance: 4485 - 4720 - 5000
Please control risk management.

1:2 RR SELL Trade on Ethereum NOW📉 Ethereum (ETH/USD) – 1:2 RR Sell Trade Setup
You're executing a sharp short trade on Ethereum with a clean 1:2 risk-to-reward ratio. Here's a crisp TradingView idea description:
🔻 Trade Snapshot
- Bias: Bearish momentum
- Entry: Near recent resistance or breakdown level
- Stop Loss: Above key structure or wick rejection
- Target: 2x the risk, aligned with next support zone or Fibonacci level
- Confirmation: Bearish engulfing, RSI divergence, or MACD crossover
💬 "ETH showing signs of exhaustion—perfect setup for a disciplined 1:2 RR short. Tight stop, clear target, and momentum on our side."

Accumulate for uptrend ! ETH September 01💎 ETH WEEKLY PLAN UPDATE (09/01 )
Medium-term ETH Plan & Trend Outlook
ETH has completed the test of the resistance zone at 4,800 (4k8 resistance DONE) and is currently in a corrective move.
The price is still holding above the 4,200 – 4,215 support zone, which coincides with EMA89, showing that this is an important medium-term demand area.
As long as ETH stays above 4,200, the main trend remains bullish, with the next target aiming toward 6,000 (Fib 2.618 resistance + strong supply zone).
Key Support Zones:
• 4,200 – 4,215 → short-term demand, main support pillar.
• 3,600 – 3,620 → medium-term support (EMA200 + previous breakout).
• 3,200 – 3,216 → deeper support if 4,200 breaks.
• 2,500 – 2,520 → long-term support, major base zone.
Key Resistance Zones:
• 4,800 – 4,825 → short-term resistance, recently tested.
• 6,000 – 6,050 → medium-term bullish target, strong supply zone.
Trend Outlook:
ETH is currently undergoing a healthy correction after a 5-wave rally.
• The positive scenario: price holds above 4,200, then rebounds to retest 4,800, and if it breaks, the uptrend could extend to 6,000.
• The negative scenario: if 4,200 breaks, the market could retrace to deeper support levels at 3,600 or 3,200 before forming the next bullish wave.

ETHUSD SWING SELL LOADING1. Top123 Pattern Confirmation
The Top123 pattern is a reversal pattern:
Point 1: First high after a strong uptrend (recent swing high near $4,960–$5,000).
Point 2: Pullback low (around $4,370–$4,400 zone).
Point 3: Lower high rejection (below $4,700 resistance zone).
👉 Since price failed to create a new higher high and instead formed a lower high, the bullish momentum is weakening and signaling potential trend reversal.
2. Bearish Momentum Signs
Recent daily candles show strong selling pressure with long wicks and consecutive red candles.
Price rejected supply zone ($4,650–$4,700) → confirming seller dominance.
Break of support level around $4,400 increases the probability of a larger downside move.
3. Supply & Demand Structure
Price is currently retesting broken support as resistance (classic bearish structure).
Short entry zone aligns with the supply zone, which increases the probability of rejection.
Target zone is marked around $3,600–$3,550, which is the next strong demand/support level.
✅ Summary:
This ETH/USD daily setup is a potential short because:
Top123 pattern indicates trend reversal from bullish → bearish.
Bearish momentum visible with lower highs and supply zone rejection.
Price structure aligns with short entry near resistance and target at next demand zone.
Strong risk-to-reward ratio makes the trade favorable.

Eth - Support and resistance & take profit targetsSupport and resistance & take profit targets.
May the trends be with you.

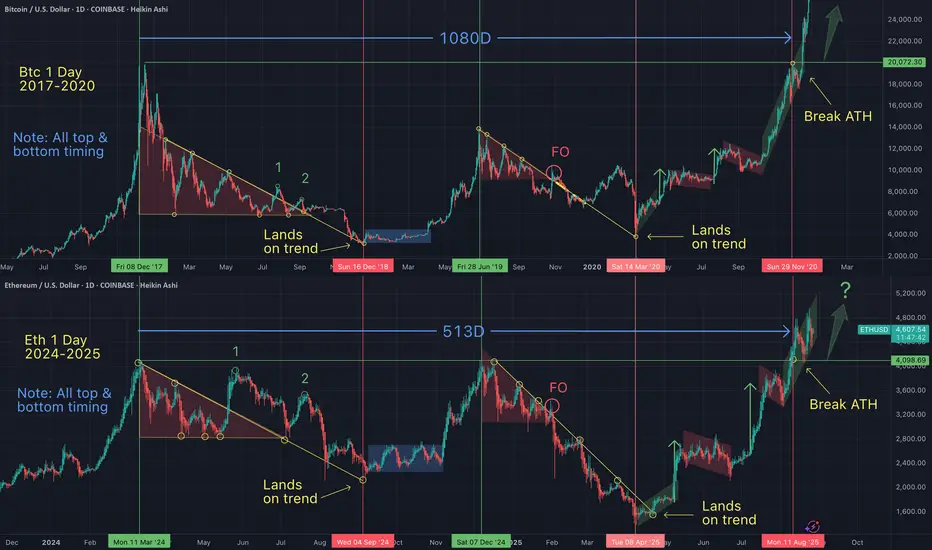
Eth - These chart patterns are repeating over & over If we learn to identify common patterns we will note that they are occuring over and over...on every asset (that has a chart)...on every timeframe. When in doubt, zoom out.
I can help you see the matrix.
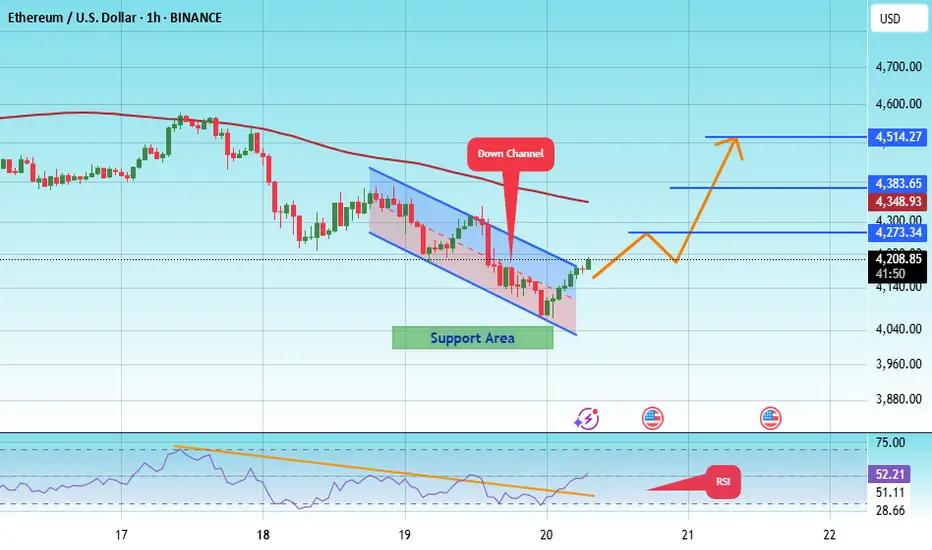
#ETH/USDT#ETH
The price is moving within a descending channel on the 1-hour frame and is expected to break and continue upward.
We have a trend to stabilize above the 100 moving average once again.
We have a downtrend on the RSI indicator that supports the upward move with a breakout.
We have a support area at the lower boundary of the channel at 4300, acting as strong support from which the price can rebound.
We have a major support area in green that pushed the price upward at 4330.
Entry price: 4544.
First target: 4646.
Second target: 4830.
Third target: 4995.
To manage risk, don't forget stop loss and capital management.
When you reach the first target, save some profits and then change your stop order to an entry order.
For inquiries, please comment.
Thank you.

ETHUSD🔎 Chart Setup
ETH/USD 1H → Bearish flag = continuation pattern AB=CD
ETH Dominance (D) → Also breaking flag = confirms weakness in ETH vs other alts/majors
📊 Trade Plan
⚠️ Manage risk strictly (crypto volatility is brutal):
Entry: On breakdown retest of the flag support line 🟥
Stop Loss (SL): Just above flag resistance
rofit (TP):
🎯 TP1 (1:1 RR) → Secure partial profits (50% book)
🎯 TP2 (1:2 RR) → Let rest run, trail SL
💡 Risk Management
Max 1%–2% account risk per trade ⚖️
Always use hard stop, don’t widen 🚫
Partial booking keeps you safe + confident 🛡️

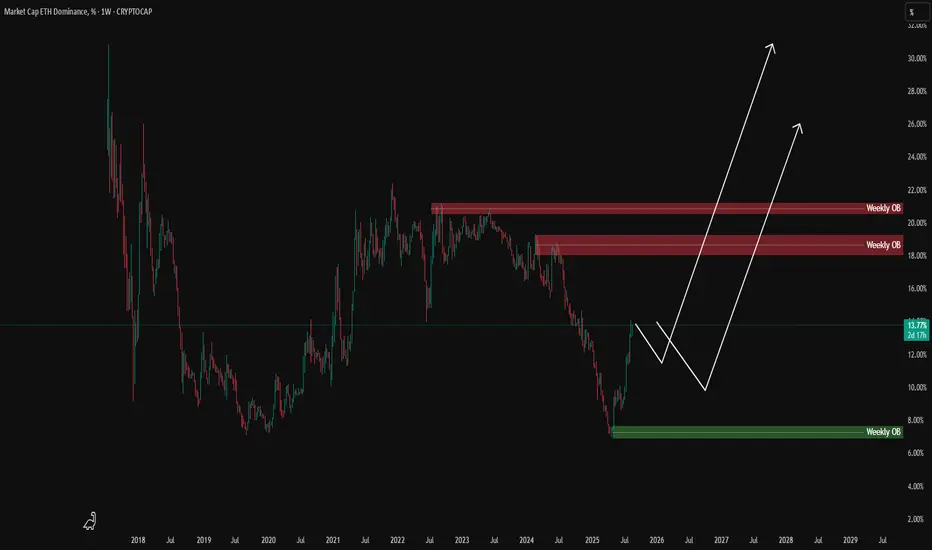
Alt season time (PART 1)Hello friends
Well, the question that has come up a lot for you these days is the alt season or its beginning.
Well, you see the Ethereum dominance chart that the candle closed well on the weekly time frame, but on the daily time frame, if the price holds the 14.20 area and the 14.85 resistance is broken well and validly, we will go for the higher numbers that we have specified, and in this case we will see good growth of altcoins.
If the price falls and the support at 14.20 is broken, we will see a drop in the price of Ethereum as well as altcoins, so these next few days are very important.
*Trade safely with us*

Did Eth just bottom? My Eth take profit targets.Did Eth just bottom. My guess is that was a local bottom. But I wouldn't be surpresed if Eth gets a lower low. I hope I wrong, but if we do get another lower low, that would be an ideal entry point for me.
May the trends be with you!

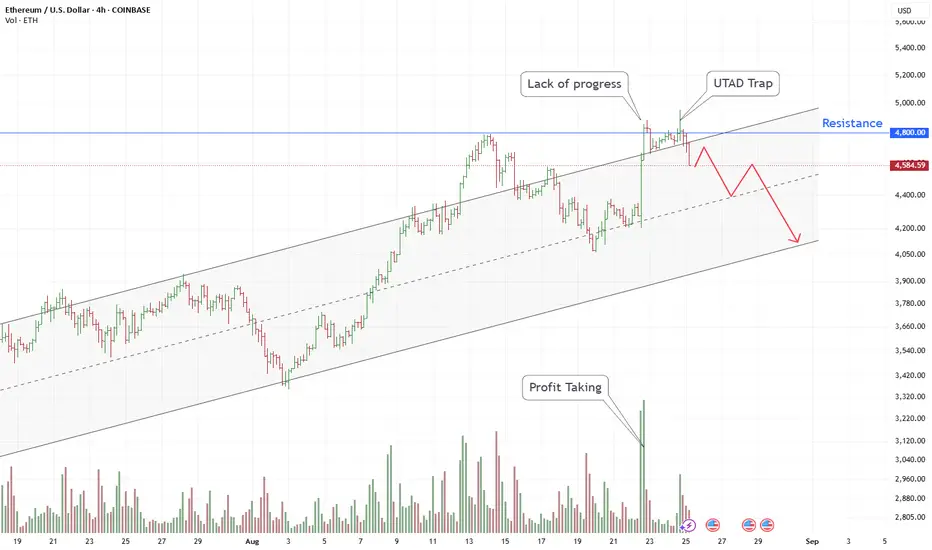
ETH/USD Chart Analysis: Signs of Weakness at the $4800 LevelDespite an uptrend since early August that has formed a stable channel, the ETH/USD price has been showing clear signs of weakness in recent days.
The chart shows that the price is struggling to advance above the key resistance level of $4800. This "Lack of progress," combined with a volume spike marked as "Profit Taking," suggests that large players ("smart money") may be selling their assets.
The recent false breakout above $4800 can be interpreted as a "UTAD Trap" (Upthrust After Distribution). Such maneuvers are often used to capture liquidity before initiating a downward phase.
Based on this, the current situation suggests the beginning of a downward correction. A likely target for this move is first the channel's midline around $4,400, after which the price may head towards its lower boundary in the $4,100-$4,200 region.
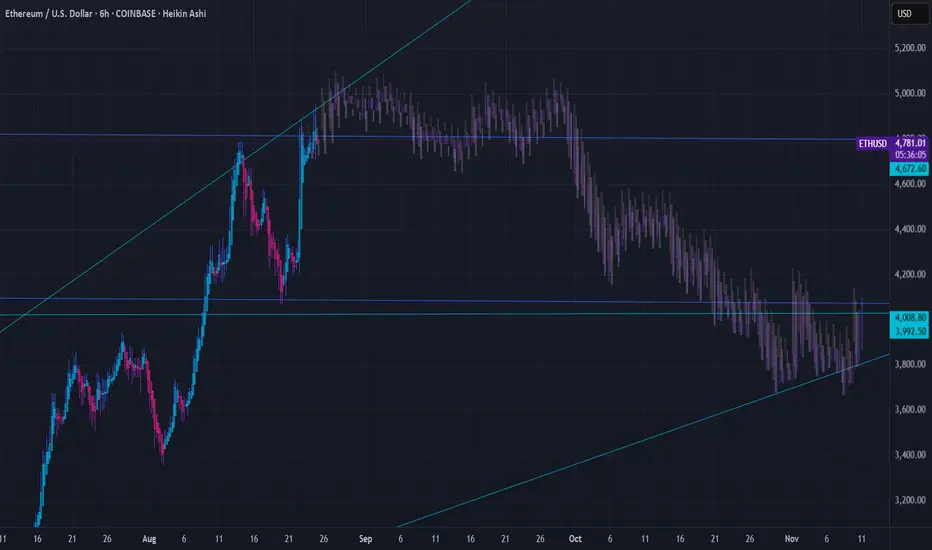
▒𖢻▒ ETHEREUM FORECAST | 6HR ▒𖢻▒COINBASE:ETHUSD
Here's my Forecast for Ethereum on the 6-hour chart. After an incredible run, ETH is now consolidating in a tight range, and the chart is giving us some very clear levels to watch.
Here's my breakdown of the current situation:
The Bullish Case (Consolidation):
ETH is currently holding strong above the key support level at $4,677. As long as we remain above this line, this sideways action looks like healthy consolidation before the next leg up.
The overall structure is still a clear uptrend, defined by the ascending trendline providing support from below.
The Bearish Case (Potential Pullback):
The price is currently below the recent High near $4,950. A failure to break this level could signal exhaustion and lead to a pullback.
The first major support to watch on any significant dip is the 0.382 Fibonacci retracement level around $4,300. This would be a logical area for buyers to step back in.
Key Levels to Watch:
Resistance: The recent high around $4,950. A clean break and hold above this level signals the next major move higher.
Immediate Support: $4,677. This is the line in the sand for the current consolidation range.
Major Support: The 0.618 Fib level and structural support at $4,000. This is the critical level that bulls absolutely must defend to maintain the larger bullish trend.
My Outlook:
For now, I'm leaning bearish on the 6HR, bullish in the immediate short-term but remaining cautious. I'm watching for a decisive break of $4,950 as confirmation for new highs. If the immediate support at $4,677 fails, I'll be looking for a potential dip-buying opportunity at $4,300.
DISCLAIMER
I AM NOT A FINACIAL ADVISOR, NOR AM I YOURS. THIS IS NOT FINANCIAL ADVICE. MEARLY DOODLINGS ON A MATHMATICALLY DRIVEN GRAPHICAL INTERFACE, TRACKING AN INVISIBLE 256BIT MILITARY-GRADE ENCRYPTED ASSET. . . FOR ENTERTAINMENT/AMUSEMENT PUROSES ONLY. ENJOY!
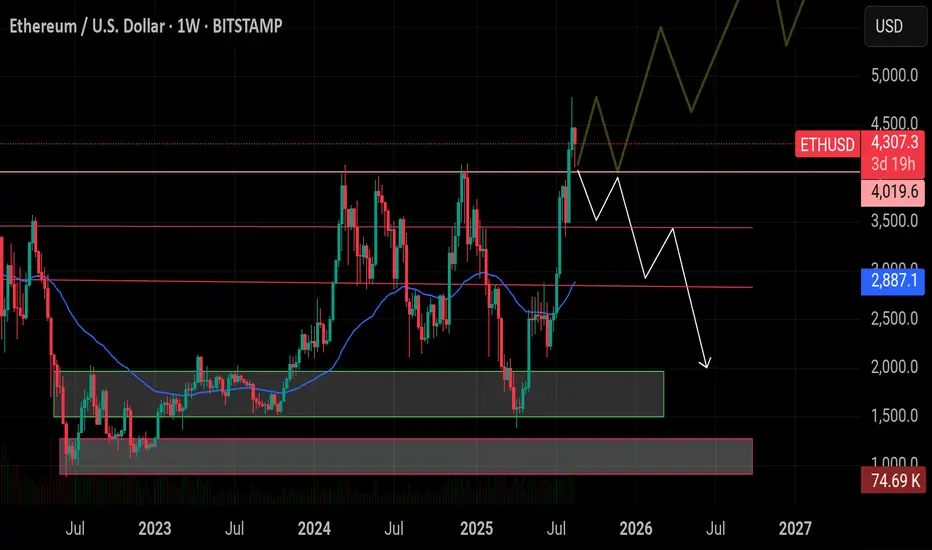
Period of ETH outperformance vs BTC is almost overWe got a clean five wave up structure that topped with a bang in April 25
This is from when ETH has been outperforming BTC nicely.
We can see a very clean corrective three wave decline labelled as A down, B up, C down
The ratio BTC vs ETH is approaching my Target 2.
What that chart tells us is that most likely the period of ETF outperformance against BTC is almost over.
That does not necessarily means that BTC should start a big rally. It is possible that both, BTC and ETH would decline. But that chart suggests that BTC would hold better in that case.

#ETH/USDT Breaks Below Recent Triangle Structure !#ETH
The price is moving within an ascending channel on the 1-hour frame, adhering well to it, and is on track to break it strongly upwards and retest it.
We have support from the lower boundary of the ascending channel, at 4040.
We have a downtrend on the RSI indicator that is about to break and retest, supporting the upside.
There is a major support area in green at 4000, which represents a strong basis for the upside.
Don't forget a simple thing: ease and capital.
When you reach the first target, save some money and then change your stop-loss order to an entry order.
For inquiries, please leave a comment.
We have a trend to hold above the 100 Moving Average.
Entry price: 4203.
First target: 4273.
Second target: 4383.
Third target: 4514.
Don't forget a simple thing: ease and capital.
When you reach the first target, save some money and then change your stop-loss order to an entry order.
For inquiries, please leave a comment.
Thank you.
Altseason Checklist! To spot the beginning of an Altseason, there are several key charts you need to track on TradingView. These indicators show whether capital is really leaving Bitcoin and flowing into altcoins.
1. Altseason Starts with ETH
Almost every time, the first signs come from Ethereum (ETH). When ETH gains strength, the rest of the altcoins usually follow.
2. BTC Dominance (BTC.D) ⬇️
Condition: forming Lower Low / Lower High
Interpretation: money is rotating out of BTC and looking for better opportunities in altcoins.
3. ETH Dominance (ETH.D) ⬆️
ETH’s share of the market is increasing.
This shows Ethereum is taking leadership over the flow of capital.
4. ETH/BTC Pair (ETHBTC) ⬆️
Key: breakout to the upside with weekly confirmation
This ratio reveals whether ETH is truly outperforming BTC.
When ETHBTC breaks up ⇒ strong trigger for ETH leadership.
5. TOTAL2ES ⬆️
Represents market cap of all altcoins excluding BTC.
Growth here means real money is flowing into alts, not just cycling into stables.
6. TOTAL3ES ⬆️ (with delay)
Represents market cap of all altcoins excluding BTC and ETH.
When this chart starts rising ⇒ after ETH, the rest of the alts join in.
This is usually the final confirmation of Altseason.
7. USDT Dominance (USDT.D) ⬇️ or ↔️
Should move down or at least stay flat.
If it rises too much ⇒ capital is not entering alts, it’s parking in stablecoins ⇒ Altseason trap.
⚠️ Key Note – Watch Out for the Trap
The biggest trap is when BTC.D is dropping and ETH.D is rising, but USDT.D is also climbing.
That doesn’t mean Altseason – it means money is leaving BTC but hiding in stablecoins instead of flowing into alts.
📌 Summary:
Starts with ETH
Confirm with BTC.D ⬇️, ETH.D ⬆️, ETHBTC ⬆️
Money entering alts ⇒ TOTAL2ES ⬆️
Expansion to full alt market ⇒ TOTAL3ES ⬆️
Watch USDT.D to avoid the trap.
$ETH Bearish Outlook: #Ethereum has retested around the $4,059 CRYPTOCAP:ETH Bearish Outlook:
#Ethereum has retested around the $4,059 is a key support. Losing it could trigger a dump toward $3,500. If ETH fails to reclaim this level and gets rejected below, price could dump toward $3,500. Holding $3,500 may allow a recovery back above $4K, but a breakdown under $3,500 opens the way for deeper downside toward $2,960.
#ETH@CryptoSkullSignal
ETHEREUM - MAKE OR BREAK TIMECRYPTOCAP:ETH Is right at the downtrend line and if it decides to reject then we will most likely be heading down towards $3.8-$4k area.
Weekly WCB formed and the Daily (Top Right) is figuring out what it wants to do.

ibit Bitcoin ETF LONG now is a good time to invest. If you go on Google and type in far side Bitcoin and click the link that goes to the farside uk Bitcoin site. You'll see the daily money flows into or out of all of the different Bitcoin ETFs. If you do the same thing but type ethereum instead you'll see all of the different inflows and outflows of money into the ethereum ETF.
This is important because with the Bitcoin ETFs you'll see that there's been hundreds of million dollars in inflows in the past week. Yet both the 19th and the 20th had outflows of money. 1 and 1/2 weeks ago the same thing happened there were two days without flows of money and then it continued with major inflows of money.
In my opinion I believe this is because the large corporations and investors put too much money in to the ETFs in order to manipulate it so that it will gain a higher value.
They also talk to each other and plan these events so that they can profit from them. So let's take five fake companies that we just call 1 2 3 and 4 and 5. These five companies will all talk to each other on the phone and tell each other well we want to put in 200 million over the course of the week well we want to put in 300 million over the course of the week.
Over the course of one week
Company 1 wants to put in 200 million
Company 2 wants to put in 300 million
Company 3 wants to put in 400 million
Company 4 wants to put in 250 million
Company 5 wants to put in 300 million
Total 1.45 billion, they want that money to stay in Bitcoin at their investment.
Like I said they all plan this to manipulate Bitcoin in my opinion.
This is what happens:
Company 2 puts in 600 million
Company 2 puts in 700 million
Company 3 puts in 800 million
Company 4 puts in 450 million
Company 5 puts in 600 million
Total real investment 3.15 billion
Why do they do it?
This is only an example but over the course of one week these companies wanted to put in 1.45 billion but they ended up putting in 3.15 billion.
3.15 billion
1.45 billion -
-------
1.70 billion + surplus
So they put in 1.70 billion dollars over the amount that they were supposed to in order to get a rally going where Bitcoin goes up in value by a lot.
They are also in contact with the stock market listed Bitcoin mining companies so that the Bitcoin mining companies do not sell the Bitcoin. Instead they Bogart the Bitcoin (keep it) so that they can sell at a higher price when the companies get back in touch with them to say it's time to sell.
All of silicon valley is involved as well I believe in my opinion. All the tech companies and private investors with a lot of money and who knows maybe Mr SpaceX and Mr Amazon are also involved.
It's like a cabal. (Private political group) But for cryptocurrency.
So when this rally happens of course other people buy into the ETF like your average Joe. Hoping to profit.
What happens?
The ETF goes higher in value which means Bitcoin goes a lot higher in value. Maybe it will go up to 125,000 this time? Or maybe it will go up to 130,000 this time before going down?
What's the point?
The point is they are going to be selling that 1.7 billion dollar surplus because they only had 1.45 billion that they were going to put in.
That 1.7 billion dollar surplus that got the rally going and when it's time to sell could possibly be worth 7% to 8.5% more. Plus they're all putting in their own money into it because it's like insider trading. When you're putting your money into a stock as an institutional investor of course you're going to put your own money into it too so these people are putting 50 million dollars by themselves, 500 million by themselves. Who knows?
So surplus of 1.7 billion + 7% is now worth 1.819 billion or a gain of 119,000,000 million dollars. So they sell and they make $119 million for their company. Plus how much do they make for themselves and all of their cohorts that they are in contact with?
Insider trading at its finest.
This happens with all companies. Take for instance an airline. Companies know that maybe airlines will go up in the summer. Or they know that it will go up in the travel season for the holidays Thanksgiving and Christmas. So all the different companies they get in touch with each other and they say hey we're going to buy $5 billion of airline one and then the other company tells them okay we're going to buy 2 billion of airline one. Of course again they're all putting in their own money as well.
The Bitcoin rally is not over. We may see as high as 138,000 this rally. Before the bear market hits.
Some say we could see 420,000. I'm not sure about that I wonder if that's for the next rally in 2028 after the halving?
Will you take a leap of faith and do the right thing for humanity and leave a comment under this post with what your opinion is?

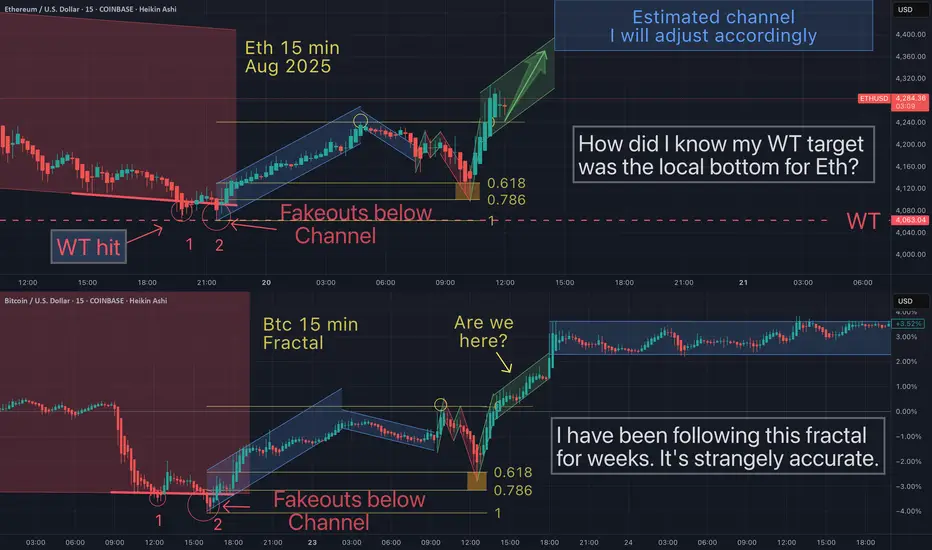
Eth has been following this exact Btc fractalIn the world of graphing (charting) and linear equations, the concept of "fractals" would be mathematically improbable. But in charting, fractals work - until they dont. Fractals usually stop working as an exact map when you LEAST expect (or want) then to.
Pepe looks ready to blast off [long]Pepe is equip to blast off into the metasphere. Just look at the squeeze moment indicator on the two week. Would you look at that. Just look at it. Look at it. Just look at it. Would you look at that.
Even on the weekly time frame PepeUSDT looks ready for a large green D.
I like to use that pmar to get a feel for what it's really going to do. It looks like it has A LOT of room to move
The daily time frame doesn't look so hot. The squeeze is in the green already. However Every other time frame less than one day so 14 hours 12 hours 10 hours etcetera etcetera they're all pointing to the fact that we're going into the green.
GOOD NEWS! Have you found a paid indicator that works wonderfully? Let me know and I will recreate it for you by it and I'll invite you to have access to. I won't give it out freely To everyone. It will just be myself and you that has it. so send me with the indicator and I'll code it up for you! Send me a DM with to the paid version like their website which tells about it and I will recreate it for you.
MORE GOOD NEWS!
I'm going to be calling hot solana meme coins very soon so MAKE SURE TO FOLLOW ME! The fact is there's a secret... I won't be just blatantly writing a message like this with an analysis I will only be changing my profile picture to the coin's name. so you'll have to visit my profile often. I will leave the date in my bio and I will write "updated 08/18/25 6:16PM" As an example so you know exactly when the signal was called. so make sure to follow me!
Make sure to like this post. That way it will help me to gain more followers and it will help all of us. do your part to help me and I will help you immensely.
Sincerely,
rocket

ETHUSDTBINANCE:ETHUSDT is overall trend in the 4-hour timeframe is bullish, with strong buying momentum. The price is currently at the 4200 USD resistance, and if this level breaks, the next target will be around 4500 USD.
Supports:3950 USD, 3730 USD, 3350 USD
Resistances: 4200 USD, 4500 USD
⚠️Always apply proper risk management.

ETHUSD: Above $4,300 – On the Way to New Heights!Market sentiment and triggers
The bullish momentum is strengthening: ETH has risen by 17% in a week and has broken through the $4,300-4,400 levels. Growing interest from institutional investors and ETFs is creating a solid fundamental basis.
Initiatives and regulatory drivers: Stablecoin legislation and SEC policy ("Project Crypto") make Ethereum attractive, with the prospect of a new high above $4,865.
Corporate purchases are in the works: companies like Bitmine Immersion and Sharplink Gaming are actively increasing their positions in ETH, which is further supporting demand.
Technical models and signals
A "bullish flag" is forming: the pattern looks like a pause before a new wave of growth. A breakout to the upside is the target for the monthly high near $4,900+.
Key support levels: $3,700 remains a solid foundation. A drop below $3,500-3,300 will be a risk for the current wave. Forecast spread: from $2,750 to $4,550 in August.
DailyForex forecast: momentum is aimed at $4,000 with key support/breakout zones at $3,400 (base) and $4,000 (upside barrier).
Long-term target possible up to $8,000: if ETH consolidates above $4,000 and the momentum continues, the $6,000 level and even $8,000 may soon come into view.
