ETH Is Quietly Setting Up a Massive Reversal — Don’t Miss This!ETH 4H & Daily Outlook Update
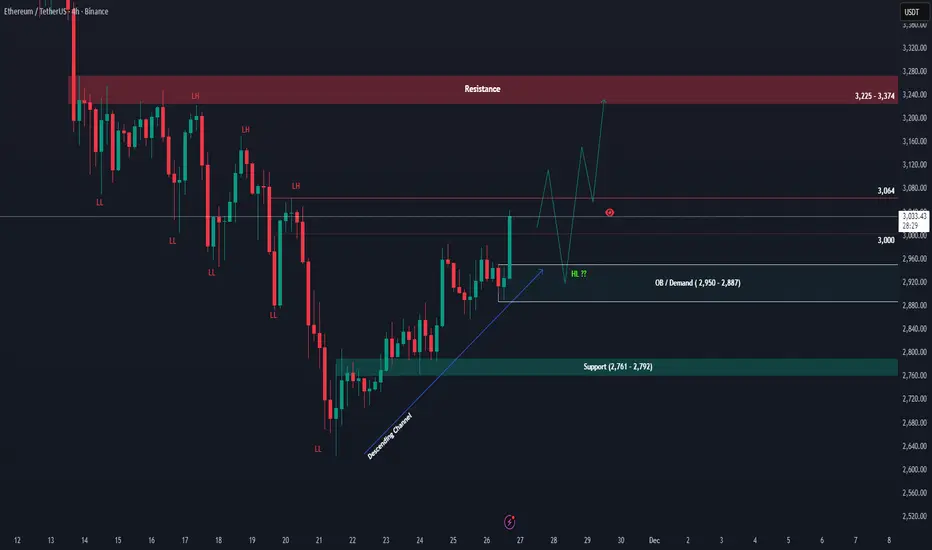
ETH continues to follow the broader plan we've been watching over the last few days. After tapping the monthly demand zone, price reacted strongly and rebounded from the daily order block, confirming that the higher-timeframe accumulation area is still holding well. This zone remains the key foundation for ETH’s medium-term structure.
On the 4H timeframe, the trend is still technically bearish, with a series of lower highs visible. Price is now testing the supply zone and sitting right around the previous lower low at 3,064. If ETH can break and hold above this level, it would be the first meaningful sign of a trend shift, opening the door for a move toward the major resistance band at 3,225 – 3,374.
If buyers can push higher, a pullback into support or even a revisit of the 2,950 – 2,887 order block is still likely, forming a higher low before continuation. As long as this OB area remains intact, ETH maintains a strong chance to extend upward and retest the resistance zone. But if this OB breaks, the structure weakens and price could slide back toward the deeper support at 2,761 – 2,792.
Overall, ETH returning to the monthly OB was a healthy reset. As long as this region is protected, the higher-timeframe accumulation narrative remains valid.
Ethsignals
Ethereum crypto strong demand at $2,880 playing outEthereum tapped a major demand zone at $2,880, and the reaction is clear: buyers stepped in, just like they usually do when a clean, fresh imbalance takes control. The last time ETH reacted to a similar structure on the bigger timeframes, we saw extended bullish legs unfolding week after week.
Right now, the question is simple:
Will this demand level hold long enough to push ETH toward $4,120 and beyond?
Based on the current imbalance structure, the answer leans strongly toward yes.

ETH, againYesterday I thought about extending the SL lower, I wasn´t liking 100% the sideway movement it was making... so obsviously it went to hell today, just now. I´m making a new attempt, 15% up or 2% down.

ETH Long RiskySpotted a potential long opportunity on ETH after a clean pullback into a demand area.
Price is currently retracing after a strong bullish leg, showing signs of slowing momentum on the way down.
🔹 Entry: 3049
🔹 Stop-Loss: 2974.72
🔹 Take-Profit: 3326.79, giving roughly a 1:4 R/R
🔹 Risk: ~2.4%
🔹 Reward: ~9.1%
Why I like this setup:
Clear bullish structure on the higher timeframes
Liquidity grab below previous lows
Price pulling back into a strong demand zone
Good risk-to-reward for a continuation play
Waiting for confirmation before full entry — a change of character (CHoCH) or bullish rejection wick would strengthen the setup.
Let’s see how it plays out. 🚀

EthereumETHUSD
- Falling Wedge as an corrective pattern in Long Time Frame
- Demand Zone
- Order Block
- Completed " 123 " Impulsive Waves
- Fibonacci Level - 38.20% / 50.00%

#ETH/USDT (1h) (spot)#ETH
The price is moving in a descending channel on the 1-hour timeframe. It has reached the lower boundary and is heading towards breaking above it, with a retest of the upper boundary expected.
We have a downtrend on the RSI indicator, which has reached near the lower boundary, and an upward rebound is expected.
There is a key support zone in green at the 2960 price level. The price has bounced from this zone multiple times and is expected to bounce again.
We have a trend towards stability above the 100-period moving average, as we are moving close to it, which supports the upward move.
Entry price: 3000
First target: 3033
Second target: 3080
Third target: 3140
Don't forget a simple principle: money management.
Place your stop-loss below the support zone in green.
For any questions, please leave a comment.
Thank you.

I'm Dreaming of a White (Bullish) ETHmas!!!!OK, so December is here and ETH has been playing out perfectly. These sharp moves up and down have been all part of the market moving the way the market moves! As we've said before....forget about the talks of Tariffs, Shutdowns, Microstrategy delistings, etc. This market is moving according to solid market structure that we follow and teach. Please see our last Postings on ETH throughout November to see how we've projected these moves almost to a T.
Where are we now?:
At the last post, ETH had made an H4 Break of Structure (BOS) Up, signaling that we were finally seeing either an end, or at least a significant slow down to this bleeding. As expected, this H4 BOS up was going to drive the price back down once more to the H4 BOS Source (~2650 - 2750) for a strong buy. The market fell exactly to this range, and we saw an immediate bullish response back up. This bull push has led us back up to the top of the H4 Supply Zone for a retest.
What to look for next?:
Now that we are back to this H4 Supply Zone, many may be expecting another hard slap from the Bears, BUT, the market has already tipped its hand by giving us that initial BOS Up. We returned to the Source of that break for strength, so there is VERY LITTLE chance that this H4 Zone will hold the price anymore. In fact, the next target is the H1 Supply Source (3155 - 3220), which is an internal structure zone that still will not stop the price. The market is headed for the H4 Supply Source (3450 - 3560) for the 1st Real and Significant test of whether the Bull Run has resumed. A Strong test of this area is the determining factor. If we get a break above and retest of this zone, there is literally nothing to stop ETH from returning to the Daily Support - Now Turned Resistance Zone of 4,000 - 4,100.
So, Will there be a White Christmas for ETH?:
The H4 is pretty much driving the action right now, so any trades should be focused on that time frame until we hit the higher Daily Zone mentioned above. Expect the price of ETH to keep climbing through December, at least up to these zones. It could take a few days or even weeks to make this progress up, but the market has already signaled that it is coming.
Shorter trades opportunities should be abundant on the 15 min as the market makes its way up. Look for 15 Min Demand Zones and wait for the pullbacks to those zones to join the trend.

ETHUSD 1H — Short Opportunity After Channel BreakCOINBASE:ETHUSD
Price is trading inside a broad descending structure, and the recent move appears corrective, forming a rising channel. This type of structure often represents distribution before continuation lower.
A sweep into the 3,250–3,320 supply zone aligns with previous imbalance and trendline rejection. If the price rejects this zone with momentum, the bearish continuation setup becomes valid.
Key Scenarios
❌ Bearish Case (Primary Setup) 📉
Ideal Entry: 3,250–3,320 Zone (Supply)
→ 🎯 Target: 2,700–2,650 (Liquidity Sweep + Demand Zone)
→ 🛑 Stop Loss: Above 3,380
Confirmation triggers:
• Break of rising channel
• Bearish engulfing candle
• Wick rejection into the zone
Levels to Watch
Type Price
Short Entry 📍 3,250–3,320
Target 🎯 2,650–2,700
Stoploss ❌ 3,380
Invalid if Broken Trendline + Structure Flip
⚠️ This analysis is for educational purposes only — not investment advice.

ETH : SELL MARKET!!!Hello friends
Well, as you can see, we are in a very strong downtrend and the sellers have full control.
Now, any price increase can be a selling opportunity, until the buyers show strength, we cannot say that the trend has changed...
Of course, we are also at important support and we need to see whether buyers support the price or not. Until then, we will not trade on guesswork and predictions.
This analysis is purely technical and is not a buy or sell recommendation, so please exercise your risk and capital management.
*Trade safely with us*

ETHEREUM HIGH PROBABILITY LONG SETUP SOON!!!🚨 ETHER HIGH PROBABILITY BUY SETUP 🚨
* Here We Can See Clearly The Next Potential Moves For ETHUSD Coming Hours/Days.
* Keep Your Eyes Close On Your Trading Positions.
* Happy PIP Hunting Traders.
FXKILLA.

3 Altcoins To Watch In The First Week Of December 2025Ethereum is a key altcoin to monitor this week as it approaches the Fusaka upgrade, scheduled to go live on December 3. This marks its second major upgrade of the year following Pectra and aims to strengthen the network’s long-term scalability.
Fusaka is designed to help Ethereum support high transaction throughput from layer-2 chains by implementing 12 Ethereum Improvement Proposals. The upgrade could lift ETH from its $2,814 support level toward $3,000. Reclaiming that level is essential for a push toward $3,131 and a broader recovery.
If bearish momentum continues and Ethereum reacts negatively to the ongoing Death Cross indicated by its EMAs, ETH may lose support. A fall below $2,814 could send the price toward $2,681, invalidating the bullish thesis and signaling deeper downside risk.
Ethereum (ETHUSDT): Approaching a Major Turning PointHI!
Trend Structure
Since mid-October 2025, ETH has been trending inside a well-defined descending channel, forming consistent lower highs and lower lows. The break of the previous bullish trendline back in July 2025 confirmed the shift into a corrective phase.
Key Support Zone (S&D)
Price is now around $2,730 (Nov 2025) and heading toward the crucial $2,450–$2,300 S&D zone, a strong support area that held the market firmly between May and July 2025.
Expected Price Behavior
A final liquidity sweep toward $2,300–$2,200 is possible before any sustainable upside move. This aligns with the lower boundary of the descending channel.
Deeper Support (DP)
If this level fails, the next major demand sits at $1,950–$1,800, last touched in March 2025.

ETHEREUM Analysis (12H)A large amount of liquidity has been hunted at the top, which corresponds to the all-time high. After this liquidity was taken, the price entered a bearish structure with strong momentum.
For this bearish structure to reverse or slow down, sufficient liquidity needs to be collected from the lower areas of the chart.
There is a possibility of a temporary rebound from the current levels, but the main reversal should come from the lower zone that we have identified.
We still maintain this outlook on Ethereum in the daily and 12-hour timeframes
Do not enter the position without capital management and stop setting
Comment if you have any questions
thank you

Selena | ETHUSD 1H – Bullish Continuation SetupCOINBASE:ETHUSD
The recent rejection from the upper trendline created short-term corrective movement. Liquidity sweeps below minor support hint at accumulation, and as long as price remains above the invalid zone at 2899, bullish momentum is favored. Holding demand could fuel another expansion toward the next resistance block.
Key Scenarios
✅ Bullish Case 🚀
Hold above Demand Zone (≈ 2990–3020) →
→ 🎯 Target 1: 3110
→ 🎯 Target 2: 3180
→ 🎯 Target 3: 3220 (Top Resistance)
❌ Bearish Breakdown 📉
Break below 2899 invalidation zone
→ Potential retracement toward 2755 – strong support zone
→ Deeper demand sits near 2621 if structure fully collapses.
Current Levels to Watch
Resistance 🔴: 3110 | 3180 | 3220
Support 🟢: 3020 | 2899 | 2755
⚠️ Disclaimer: Educational analysis only. Not financial advice.

ETH vs BTC- Sometimes when we look at markets, we get confused by all the noise, Trump and governments news, ETFs, FED, bans, SEC, FUD, FOMO, fake stories, and more.
- As a trader, you must always step back from news, view the trend from a distance, and filter out that noise.
--------------------------------------------------------------------------------------------------------
Trading Parts (Monthly TF) :
--------------------------------------------------------------------------------------------------------
- Look at the trend and indicators, that’s what you should focus on first. ETH reached its all-time high in November 2021, and then retested that same ATH level in August 2025.
- Now look at the RSI and MACD levels at that time... In 2021, the RSI was overbought and the MACD crossed downward.
- Alright, now compare with where we are today. The RSI is only halfway to the top (even though ETH has already reached $5K again), and the MACD just crossed upward a few months earlier.
--------------------------------------------------------------------------------------------------------
In my opinion, we’re not topped yet and ETH still low. They will always try to scare you out so they can buy your bags cheaper.
Keep your attention on the opportunities others can’t see.
Happy Tr4Ding !

Selena | ETHUSD 2H — Bullish Momentum Retest Setup |COINBASE:ETHUSD
After a strong sell-off, ETH formed a base around $2620 and reclaimed structure. The recent breakout and consolidation suggest accumulation before continuation. As long as price holds above $2940–$3000, bullish continuation remains favored toward the next supply zone
Key Scenarios
✅ Bullish Case 🚀
If price holds above $2940–$3000 support:
🎯 Target 1: $3200
🎯 Target 2: $3350–$3450 (major supply zone)
❌ Bearish Case 📉
A clean break below $2940 may invalidate the bullish structure and open deeper retracement.
Current Levels to Watch
Support Zone: $2940–$3000
Rising Channel Support
Liquidity Target: $3350–$3450
⚠️ Disclaimer: This analysis is for educational purposes only. Not financial advice.

ETH Reversal??? Is it Finally Here???So, ETH has been pushing up quite a bit now these last couple of days, but is this a real pump back up, or is it a TRAP? I'll let you decide. Here's what I see....
As posted previously, we have seen an H1 BOS out of the HUGE Weekly Demand Zone. In fact, it came out of the Daily Source of that Weekly Zone, so this push back up is definitely expected. We have fallen so much and fell down to near the bottom of the Weekly Demand Zone.
So, this H1 BOS will nearly always lead to a pullback to the H1 Source of that break, or to the H4 Supply Zone. This is playing out perfectly. We have just pulled back to this H4 supply Zone.
So....This is the area to look for any confirmation that the overall sell will continue. This H4 Supply Zone is full of sellers waiting to dump ETH, and it needs to be tested.
What to look for here:
Inside of this H4 Supply Zone, we need to see a 15 Min BOS down to signal that this whole move was a huge fakeout to trap buyers. IF we see that, look for another fake-out return to the source of that break for the Fall of Falls.
What if it doesn't Stop:
We are ALWAYS Reading the market, not predicting it. So, if this move up is to continue, we must see a clear break of that H4 Supply Zone. An H4 Candle needs to close above that zone and give us a retest, with a bullish rejection. IF that happens, ETH can keep pushing up to the next target - the H1 Supply Source (3170 - 3200).
This is just clear, technical trading, folks, and if you've been following, the market has done almost exactly what it has TOLD us it would do.

ETH/USD – Potential Bullish Reversal from Extreme POI.Analysis:
The chart suggests Ethereum is currently trading inside a strong Extreme Point of Interest (POI) after a series of Breaks of Structure (BOSS) to the downside. Price has entered a demand zone that may trigger a bullish reversal.
Key observations:
Downtrend Structure: Multiple BOSS confirmations show sustained bearish momentum leading into the Extreme POI.
Extreme POI (Demand Zone): Price is consolidating inside a deep demand area marked in red, indicating potential accumulation by buyers.
POI Reaction Expected: If price maintains support here, a bullish reversal is likely.
Fair Value Gaps (FVG):
Two major FVGs above act as logical bullish targets for price inefficiency fill.
Projected Price Path:
The drawn projection suggests:
Short-term bounce from POI
Breakout structure upward
Continuation toward higher FVG fills around $2,962, $3,130, and possibly $3,192 – $3,220.
Bias:
▶ Bullish, as long as price remains above the Extreme POI.
A breakdown below would invalidate the setup and continue the downtrend.
This is a strong smart-money style setup with a clean narrative:
Demand → Break of structure → FVG fill → Higher targets.

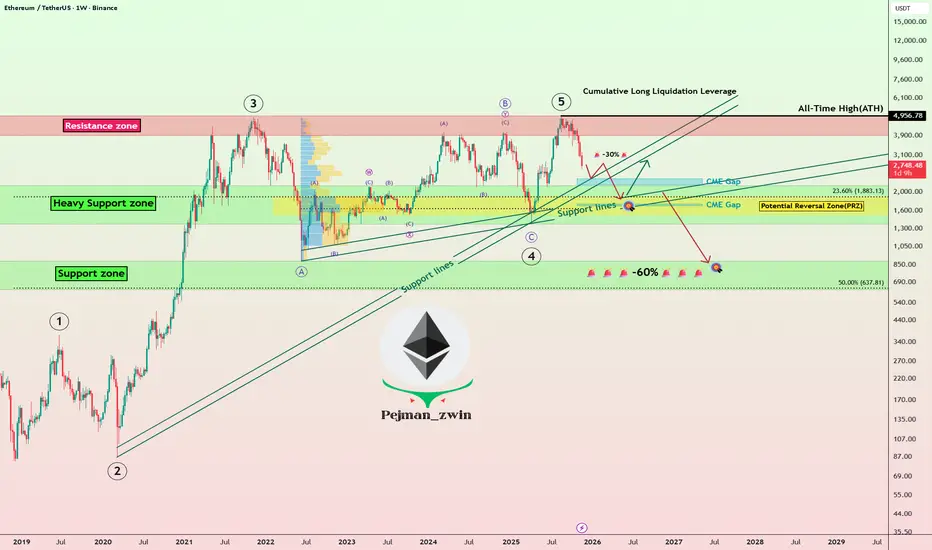
Ethereum Roadmap: Will ETH Bounce or Begin a Deeper Correction!?Today, I’d like to dive into an analysis of Ethereum ( BINANCE:ETHUSDT ). Given that over 80% of tokens in the crypto market are built on the Ethereum blockchain, Ethereum’s performance can serve as a roadmap for other tokens on the network.
So, stay tuned!
In recent times, Ethereum hasn’t been able to keep pace with Bitcoin’s growth and struggled to set a new All-Time High(ATH=$4,956). After Bitcoin’s decline, Ethereum also started to drop and is currently moving near the Heavy Support zone($2,160-$1,370), Support lines, Cumulative Long Liquidation Leverage($1,745-$1,629), and Potential Reversal Zone(PRZ) .
From an Elliott Wave perspective, it seems that Ethereum has completed its main five-wave impulsive. This suggests that we might now be entering a corrective phase. The extent of this correction will depend on multiple factors, and technical analysis alone won’t predict the exact magnitude of Ethereum’s decline in the coming days or weeks. Nonetheless, I’ll keep you updated step-by-step.
Looking at the USDT.D%( CRYPTOCAP:USDT.D ), it’s currently on an upward trend. This rising dominance can lead to further declines in Ethereum, reinforcing the bearish outlook.
Another important index is the US 10-Year Government Bond Yield ( TVC:US10 ). If the US 10-Year Government Bond Yield continues its upward movement, it can put additional pressure on risk assets like Bitcoin( BINANCE:BTCUSDT ) and Ethereum, leading to further declines.
Now, the question is: where might we see Ethereum resume its upward trajectory?
It’s likely that Ethereum will continue its downward movement(-30%), potentially filling the CME Gap($2,344-$2,186), CME Gap($1,745-$1,629) near the $2,000(Round Number). Once it stabilizes around that zone, we could look for signs of a recovery.
However, if Ethereum breaks below its Heavy Support zone($2,160-$1,370), we might face even more significant declines, potentially exceeding -60%.
Where do you think Ethereum will start to rise again? Or are more red days ahead?
💡 Please respect each other's opinions and express agreement or disagreement politely.
📌Ethereum Analyze (ETHUSDT), Weekly time frame.
🛑 Always set a Stop Loss(SL) for every position you open.
✅ This is just my idea; I’d love to see your thoughts too!
🔥 If you find it helpful, please BOOST this post and share it with your friends.
ETH idea 12.11.2025On this market, I see the potential of the two closest scenarios, on the one hand, a short at the level of 3900-4000, where I would like to see the sfp above the previous high, and then a long one, which I would like when it falls below the wall at the price of 3180

ETH Weekly FVG Filled – Final Shoulder Before 21K?On the ETH/USDT weekly chart, price has just tapped and respected the Fair Value Gap (FVG) demand zone around the 2.6–2.8K area, filling it almost perfectly.
This zone lines up with key Fibonacci retracements of the previous impulse and could be forming the right shoulder of a large inverse Head & Shoulders pattern:
Left shoulder: ~3.6–3.7K
Head: ~1.3–1.4K
Potential right shoulder: current 2.6–2.8K region (FVG fill)
Neckline: ~4.9–5.0K
If bulls defend this weekly FVG and ETH manages a sustained move back above 3K, the next logical step would be a test of the 5K neckline.
A clean weekly breakout and close above the neckline would confirm the pattern and open the door for a much larger measured move – which points toward the 20–21K region in the long term.
Invalidation / risk:
A weekly close back below the FVG and mid-range (~2.4–2.5K) would weaken the right-shoulder idea.
A deeper breakdown below 2K would put the entire structure at risk.
Watching how price reacts inside this FVG zone over the next few weeks. Is this just another bounce, or the birth of the final shoulder before a parabolic phase? 🤔
Not financial advice – just a chart idea, do your own research and manage your risk.

ETH - UPDATECRYPTOCAP:ETH - Update:
Very neutral area & bearish bias.
TP3 almost hit yesterday on my view. ✅🎯
Key support: 2620 - 2650$ - 2560 - 2480 - 2460 - 2380
Big resistances; 2900 - 2880 - 2815 - 3220
Under the main downtrend, Deeper correction possible 📉
Bottom could be around 2400$ - 2480 (weekly levels).

ETH selling climax!ETH is approaching its final stages of selling. I will watch how price behaves in the marked fib levels.
