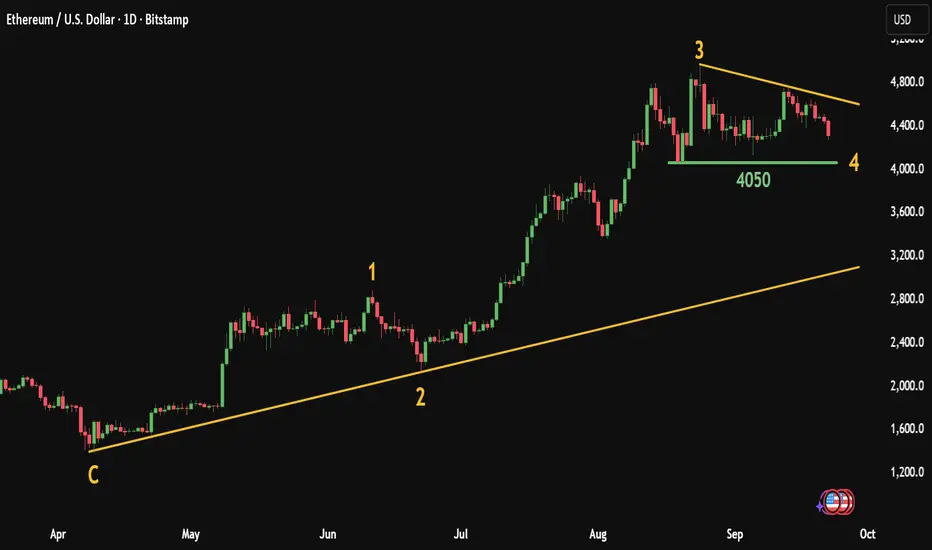
ETH Elliott Wave Analysis: Key Support at $4,050, Targets $5,200The attached chart clearly illustrates that Ethereum’s current price action is following a classic Elliott Wave structure, with three major impulsive waves completed and the market currently consolidating within the fourth corrective wave.
Ⅰ. Completed Waves
Wave C (the bottom): Marked the starting point of the new bullish cycle, around the $1,700 – $1,800 levels.
Wave 1: The initial impulsive rally, reaching $2,900 – $3,000.
Wave 2: A sideways/ corrective decline, which respected the previous bottom and maintained the overall bullish structure.
Wave 3: The strongest and most extended impulsive wave, pushing price aggressively to $4,800 – $4,900, showing the typical momentum associated with third waves.
Ⅱ. Current Phase – Wave 4
Price is consolidating within a descending contracting triangle, which is typical of a fourth-wave correction.
The key support lies at $4,050, acting as the main level to preserve the bullish Elliott structure.
Wave 4 is usually more complex and sideways than Wave 2, which fits well with the current market behavior.
Ⅲ. Outlook – Wave 5
As long as $4,050 holds without a daily close below it, the most likely scenario is the start of the fifth impulsive wave upward.
This wave is expected to break above the Wave 3 peak at $4,800 and extend into new highs.
Potential upside targets: $5,200 – $5,500, with room for higher levels if institutional momentum drives further expansion.
Conclusion:
Ethereum is unfolding within a clear Elliott Wave bullish cycle. The ongoing Wave 4 correction is consolidating around the $4,050 support level, which is the key pivot to watch. Holding this zone increases the probability of a Wave 5 rally, potentially driving ETH to fresh all-time highs in the coming weeks.
Ethsignals
ETH UPDATEHello friends
Well, you can see that due to the bearish market cycle, the downward steps have gradually become smaller and we have hit a higher ceiling at the specified support, which is a sign of a weak trend or price flooring. If this specified price floor is maintained, the price can move to the specified targets.
*Trade safely with us*

$8 Billion ETH Maturing May Push Ethereum Price to New HeightsEthereum is currently trading at $4,495, just below the $4,500 support line. If the decline extends, ETH may slip toward $4,307, but deeper losses appear less likely given the strong investor positioning.
The maturing supply and bullish long-term outlook indicate that Ethereum could soon reverse course. With fewer coins entering circulation, the altcoin has structural support for renewed upward momentum despite short-term volatility.
If Ethereum reclaims $4,500 as support, the path to $4,775 opens. A move past this level would invalidate the bearish thesis, reinforcing confidence that ETH could continue its climb toward new highs

THIS IS WHAT I DID TODAY WITH ETH Opened a long position in ETH at 4,468 with a 2% stop around 4,378 and a 4% take profit target near 4,648, yielding a 2:1 risk-reward ratio. Entry is based on a bullish divergence pattern at the lower boundary of the range, further supported by a retracement to the 38.2% Fibonacci level of the last bullish impulse.
PD:Monitoring tomorrow’s news.

The Fed Meeting and Its Further Play in EthereumCRYPTOCAP:ETH has returned to the trendline. Even if there another short-term drop, thats just part of the futures game - it can't happen without it.
Ahead of the Fed meeting, the market will likely move upward, so that no one can buy cheap after a positive decision on lowering the key rate.
Looking at the recent candles, enough longs have been closed to allow growth without abuse.
Funding across all exchanges has stabilized.
CRYPTOCAP:ETH outflows are starting to exceed inflows.
There nothing to look for down below - everything points to growth.
If it’s not too much trouble, support the post. Wishing you all the best!

Ethereum $ETH daily demand playing out well. Breakout happenedEthereum CRYPTOCAP:ETH daily demand at $4,336 is playing out well. Breakout happened as expected and mentioned in the last update. Long positions should be managed on this major cruptocurrency.

ETHUSDT.PHello friends
Given the good growth we had, the price has made a 14% correction. If the specified support is maintained, the price can see the specified targets. If the support is broken, the price can fall by another step. We have identified important support points for you.
*Trade safely with us*

ETH *UPDATE*Hello friends
Given the channel breakdown and the entry of buyers, it now seems that the price is in a pullback. In this case, the price pivots of the channel, which are now becoming supported, are expected to be good support and cause the price to grow and move with it to the specified targets.
*Trade safely with us*

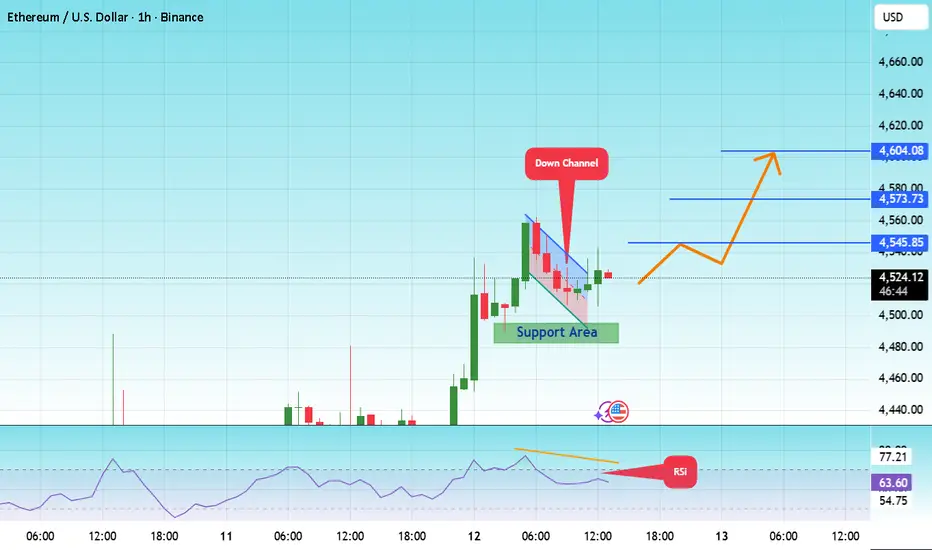
#ETH/USDT –> Falling Wedge Breakout Within Ascending Channel#ETH
The price is moving within a descending channel on the 1-hour frame and is expected to break and continue upward.
We have a trend to stabilize above the 100 moving average once again.
We have a downtrend on the RSI indicator that supports the upward move with a breakout.
We have a support area at the lower boundary of the channel at 4500, acting as strong support from which the price can rebound.
We have a major support area in green that pushed the price upward at 4485.
Entry price: 4525
First target: 4545
Second target: 4573
Third target: 4604
To manage risk, don't forget stop loss and capital management.
When you reach the first target, save some profits and then change your stop order to an entry order.
For inquiries, please comment.
Thank you.
Ethereum Road Ahead of September 17thGood morning. As I wrote in my previous post, this is my first time here. If you like it, please subscribe and support the post.
Weekends are a good time for market makers, when the market is very weak. Before pushing the price up, they need to collect liquidity by hitting long stop-losses, so that no one stands in the way of growth after a possible rate cut.
All the major short positions above have already been closed. Now it’s time to move down. The extreme downside target is $4,200. Market makers don’t necessarily have to push it all the way there—they may stop earlier. It all depends on whether long traders panic and start closing their positions, or keep holding on until the “bitter end.”
The market should always be analyzed in real time, not by “fortune-telling on daisies.” Please don’t forget to subscribe and support my post. That will determine whether it makes sense for me to keep writing further.
Wishing you a great weekend and all the best!

ETH/USDT 15m – Breakout Above $4,600/- Whats Next For #ETH ?🚀 ETH just broke out of the $4,600 zone, holding strong above the EMA200.
Fresh Fair Value Gaps (FVG) and demand zones are supporting momentum, with bulls now eyeing $4,700–$4,800 next.
🔎 Market Structure
EMA200 trend remains bullish on 15m.
Breakout from the $4,520–$4,560 consolidation.
Liquidity above $4,600 cleared → momentum intact.
📍 Key Levels
Support 1: $4,535 (intraday demand / FVG retest)
Support 2: $4,480–$4,520 (previous base)
Deep Bullish FVG: $4,360–$4,400
Resistance 1: $4,700–$4,720
Resistance 2: $4,800–$4,850
📈 Trade Plan (FVG Strategy)
Entry Zone: $4,606 – $4,620
Stop Loss: $4,585
Targets:
TP1: $4,700
TP2: $4,760
TP3: $4,800+
✅ Outlook
As long as $4,535 holds, dips into FVG/demand zones remain buy opportunities.
A clean break above $4,700 could accelerate momentum to $4,800–$4,850.
⚠️ Breakdown below $4,535 would weaken structure and open downside to $4,480 / $4,360.
💡 Not financial advice. Educational purposes only. Manage risk carefully.
📢 What’s Your Take?
Do you think ETH can hold $4,535 support and push toward $4,800?
Drop your thoughts below & hit follow for daily crypto setups 🚀
🔖 Hashtags
#ETHUSDT #ETH #Ethereum #Crypto #Altcoins #15m #Scalping #DayTrading #SwingTrading #EMA200 #FVG #PriceAction #TechnicalAnalysis

ETH USD SELL NOW 4510ETHUSD SELL @ 4510
ETHUSD – Bearish Setup at 4510 | Reversal Play
Ethereum has reached a key resistance zone near 4510, where price action shows signs of exhaustion and rejection. Momentum indicators are flashing bearish divergence, and volume is fading—setting up a clean short opportunity.
📌 Trade Parameters
- Entry: 4510
- Stop Loss: 4550 (above resistance wick)
- Take Profit: 4400 (near support zone)
- Risk/Reward Ratio: ~2.75:1
📊 Technical Confluence
- Bearish divergence on RSI
- MACD histogram fading after bullish impulse
- Rejection from upper trendline
- Volume drop on bullish candles
- Lower high structure forming on 1H chart
💬 Trade Narrative
ETHUSD has rallied into a resistance zone but failed to break above 4510 with strength. This setup targets a retracement toward 4400, with tight risk above 4550. If price breaks below 4475, expect acceleration toward the target. Setup remains valid unless bulls reclaim 4550+ with volume.
This trade favors short-term tactical execution, especially with BTC showing signs of consolidation and broader crypto sentiment cooling off.
📣 Trader’s Note:
Watch for confirmation on lower timeframes (15M/1H). If price breaks below 4475 with momentum, consider trailing stop or scaling in.

Ethereum ETH Trade Setup: Resistance, Liquidity, and BoS Idea🟣 Ethereum (ETH) Update (further to my previous idea) 🟣
ETH is currently bullish 🟢📈 and pressing into a key resistance level ⚖️ where we see multiple relative equal highs 📍📍 forming consecutively. This is a major level 🔑.
Here’s what I’m watching:
1: The current pullback may give us a bullish BoS for an entry.
2: If price trades above this resistance 🚀, it will likely trigger buy stops 🎯, providing the liquidity 💧 needed for a potential pullback 🔽.
3: If price then breaks through decisively 💥, I’ll be looking for a retest + hold 🔄, followed by a bullish break of market structure (BOS) 🔓 as confirmation to get long 🟢.
⚠️ This is educational only, not financial advice. 📚

Ethereum ETH at Key Resistance: Equal Highs and Liquidity Play🟣 Ethereum (ETH) Update 🟣
ETH is currently bullish 🟢📈 and pressing into a key resistance level ⚖️ where we see multiple relative equal highs 📍📍 forming consecutively. This is a major level 🔑.
Here’s what I’m watching:
If price trades above this resistance 🚀, it will likely trigger buy stops 🎯, providing the liquidity 💧 needed for a potential pullback 🔽.
If price then breaks through decisively 💥, I’ll be looking for a retest + hold 🔄, followed by a bullish break of market structure (BOS) 🔓 as confirmation to get long 🟢.
⚠️ This is educational only, not financial advice. 📚

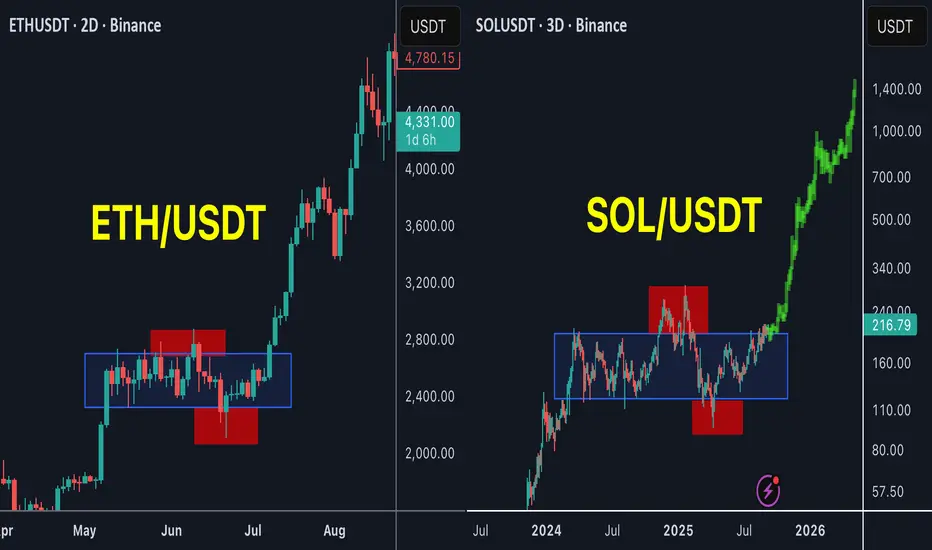
SOL is the next ETH !SOL / USDT
SOL is forming the same pattern as ETH before the huge breakout in past few weeks
Accumulation with 2 major stoploss hunt for bulls and bears and now is trying to breakout the accumulation zone
History show high success rate of this pattern
Will SOL be the next ETH ?
Best of wishes
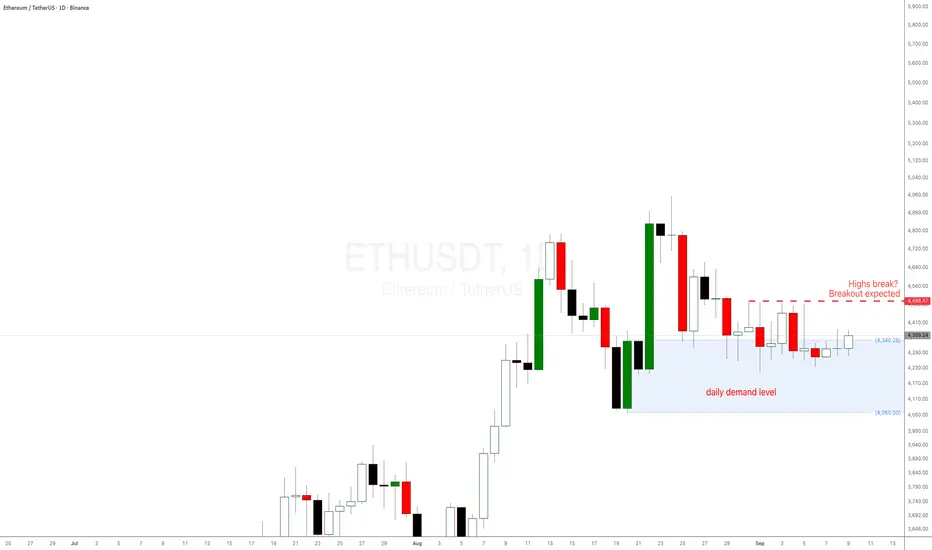
Ethereum ETH 2025 analysis and prediction daily demand levelEthereum ETH 2025 analysis and prediction as a reaction to the daily demand level at $4336. If the daily high in red is broken, a breakout is expected. ETH has been doing nothing for days, price action is not behaving as it usually does at these imbalances.
This is happening with Bitcoin BTC weekly demand level in control and playing out well. Refer to my BTC analysis in another trading idea.
#ETH/USDT towards upper levels#ETH
The price is moving within a descending channel on the 1-hour frame, adhering well to it, and is heading for a strong breakout and retest.
We have a bearish trend on the RSI indicator that is about to be broken and retested, which supports the upward breakout.
There is a major support area in green at 4260, which represents a strong support point.
For inquiries, please leave a comment.
We are in a consolidation trend above the 100 Moving Average.
Entry price: 4300
First target: 4333
Second target: 4378
Third target: 4427
Don't forget a simple matter: capital management.
When you reach the first target, save some money and then change your stop-loss order to an entry order.
For inquiries, please leave a comment.
Thank you.

Ethereum Holds Ascending Support – Eyes on 4,881 and Beyond🔥📈 Ethereum Holds Ascending Support – Eyes on 4,881 and Beyond 🚀💡
In my last video update, I walked you through Bitcoin and Ethereum’s structures 🎥 — and Ethereum continues to impress. Despite the September chop, ETH is holding its ascending trendline beautifully and consolidating above key supports.
🔹 Current Support Zone: 4,286 – trendline support. As long as ETH defends this level, the bullish case remains intact.
🔹 Upside Targets:
• 4,551 – first resistance to clear
• 4,881 – key Fibonacci extension
• 5,508 – higher target if momentum continues
• 6,443 – long-term bullish objective
📉 Bearish Risk: A break below 4,286 exposes downside levels at 4,005 , and deeper supports at 3,789 – 3,629 .
What I like here is how Ethereum is consolidating in a healthy structure after its breakout from “clashing resistances” earlier this summer. The trendline is holding, the fib levels are aligning, and the market has room to expand higher.
As I said in the Live video just now ( ): Bitcoin is in its ascending channel but facing RESISTANCE RIGHT NOW, and Ethereum is showing strength on its own path. Both are tradable — but ETH might just be leading the way this September.
Market can go sideways more, but Ethereum i see support(long over/short under that key level at 4286!)
One Love,
The FXPROFESSOR 💙
Remember to live with Love and respect for yourself and for others.🌟🤝📈

what I will do with eth“On ETH, waiting for a range breakout and reversal at 4330 to target 4423. This implies a 2% move, with a stop at 4290 (≈1%), giving a 2:1 risk-reward ratio.”

ETHEREUM HIGH PROBABILITY SETUP SOON!!!🚨 ETHUSD HIGH PROBABILITY BUY SETUP 🚨
* Here We Can See Clearly The Next Potential Moves For ETH Coming Hours/Days.
* Keep Your Eyes Close On Your Trading Positions.
* Happy PIP Hunting Traders.
FXKILLA.

#ETH/USDT towards upper levels#ETH
The price is moving within a descending channel on the 30-minute frame, adhering well to it, and is heading for a strong breakout and retest.
We have a bearish trend on the RSI indicator that is about to be broken and retested, which supports the upward move.
There is a major support area in green at 4255, which represents a strong support point.
For inquiries, please leave a comment.
We are in a consolidation trend above the 100 Moving Average.
Entry price: 4295
First target: 4326
Second target: 4367
Third target: 4417.83
Don't forget a simple matter: capital management.
When you reach the first target, save some money and then change your stop-loss order to an entry order.
For inquiries, please leave a comment.
Thank you.

ETHUSD BUY 4350ETHUSD Long Setup – Eyeing Momentum Above 4350
📌 Entry: 4350
🛡️ Stop Loss: (Set based on your risk tolerance, e.g., below recent support)
🎯 Target: (Optional – define based on resistance zones or fib levels)
Ethereum is showing signs of strength after consolidating near a key support level. A clean break above 4350 signals bullish intent, supported by improving volume and short-term trend alignment. This setup favors momentum traders looking to capitalize on a potential leg up toward the next resistance zone.
Watch for confirmation on lower timeframes and monitor BTC correlation for added confluence. Ideal for intraday or swing entries depending on volatility.
#ETHUSD #CryptoTrading #Ethereum #BreakoutSetup #BullishBias #MomentumTrade #TradingViewIdeas
Want me to tailor this for meme-style engagement or algo-friendly tagging? I can remix it in seconds.

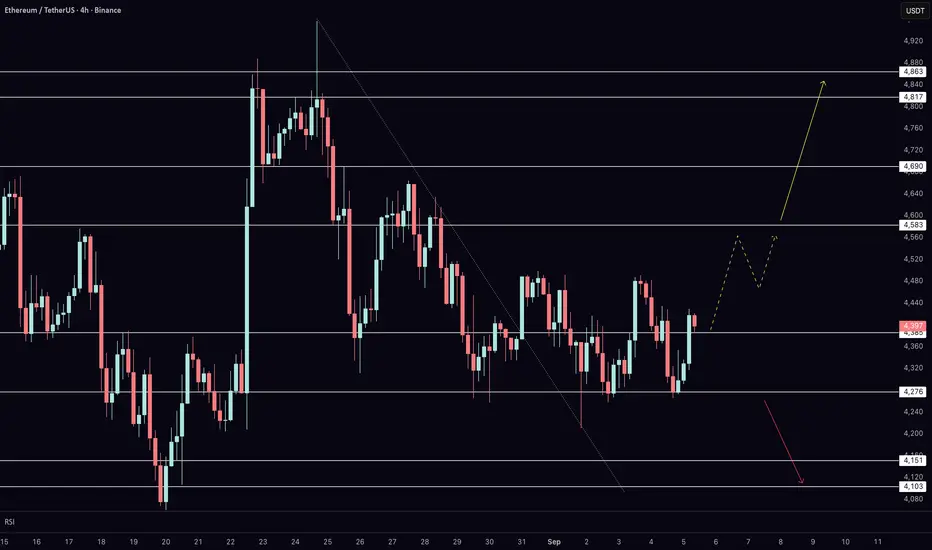
Key Levels to Watch on Ethereum Today After NFP & Bitcoin RallyEthereum is trading right at key resistance on the 4-hour chart, and today’s price action could set the tone for the next major move. After defending support at $4,276, ETH has bounced back into the $4,383 level, where buyers and sellers are now battling for control. In this video, I break down the short-term roadmap, explain the critical support and resistance levels, and outline the scenarios that could unfold depending on today’s reaction.
With the U.S. NFP release adding volatility across markets and Bitcoin showing fresh bullish momentum, Ethereum is at a decisive moment. A confirmed breakout above resistance would open the path toward $4,582, $4,689, and $4,862, while failure to hold support shifts focus back to $4,148 and $4,103. Watch closely — the coming sessions are likely to provide clarity on whether ETH is ready to extend higher.