#ETH/USDT : Rebound Setup from ascending channel Support#ETH
The price is moving in a descending channel on the 1-hour timeframe. It has reached the lower boundary and is heading towards breaking above it, with a retest of the upper boundary expected.
We have a downtrend on the RSI indicator, which has reached near the lower boundary, and an upward rebound is expected.
There is a key support zone in green at 2930. The price has bounced from this zone multiple times and is expected to bounce again.
We have a trend towards consolidation above the 100-period moving average, as we are moving close to it, which supports the upward move.
Entry price: 2971
First target: 3003
Second target: 3050
Third target: 3106
Don't forget a simple principle: money management.
Place your stop-loss below the support zone in green.
For any questions, please leave a comment.
Thank you.
Ethsudt

#ETH/USDT (1h) (spot)#ETH
The price is moving in a descending channel on the 1-hour timeframe. It has reached the lower boundary and is heading towards breaking above it, with a retest of the upper boundary expected.
We have a downtrend on the RSI indicator, which has reached near the lower boundary, and an upward rebound is expected.
There is a key support zone in green at the 2960 price level. The price has bounced from this zone multiple times and is expected to bounce again.
We have a trend towards stability above the 100-period moving average, as we are moving close to it, which supports the upward move.
Entry price: 3000
First target: 3033
Second target: 3080
Third target: 3140
Don't forget a simple principle: money management.
Place your stop-loss below the support zone in green.
For any questions, please leave a comment.
Thank you.

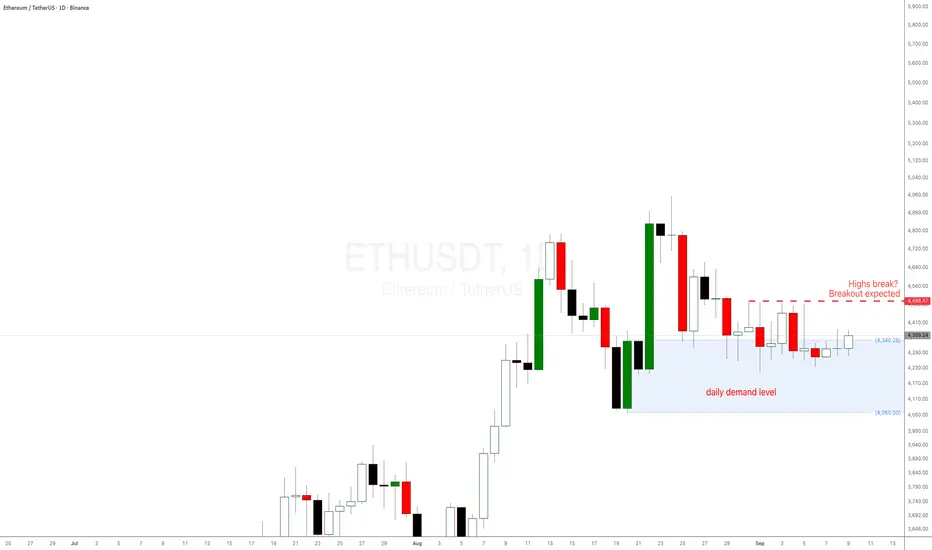
Ethereum ETH 2025 analysis and prediction daily demand levelEthereum ETH 2025 analysis and prediction as a reaction to the daily demand level at $4336. If the daily high in red is broken, a breakout is expected. ETH has been doing nothing for days, price action is not behaving as it usually does at these imbalances.
This is happening with Bitcoin BTC weekly demand level in control and playing out well. Refer to my BTC analysis in another trading idea.
ETH - Bearish correction awaited! remember my view on #ETH 📉
Nothing looks bullish here, under 4510$, especially 4600$
Very neutral area yet. (short term).
Again, it looks more like a bearish retest HTF, and there is a huge gap to be fill if price isn"t able to hold above 4250.
Medium term setup:
likely a correction to hit the 4050 - 4000$ support. 📉
A deeper correction toward 3800$ levels would also be a good spot & key demand zone for a next bull rally.
Money rotation into some #alts ?

#ETH/USDT#ETH
The price is moving within a descending channel on the 1-hour frame and is expected to break and continue upward.
We have a trend to stabilize above the 100 moving average once again.
We have a downtrend on the RSI indicator that supports the upward move with a breakout.
We have a support area at the lower boundary of the channel at 4300, acting as strong support from which the price can rebound.
We have a major support area in green that pushed the price upward at 4330.
Entry price: 4544.
First target: 4646.
Second target: 4830.
Third target: 4995.
To manage risk, don't forget stop loss and capital management.
When you reach the first target, save some profits and then change your stop order to an entry order.
For inquiries, please comment.
Thank you.

Did Eth just bottom? My Eth take profit targets.Did Eth just bottom. My guess is that was a local bottom. But I wouldn't be surpresed if Eth gets a lower low. I hope I wrong, but if we do get another lower low, that would be an ideal entry point for me.
May the trends be with you!

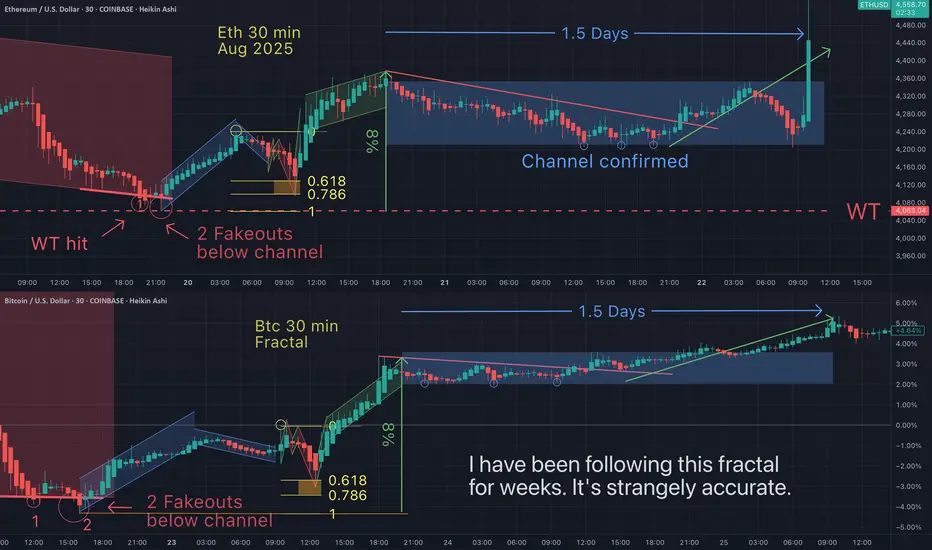
Eth- Continues to follow a strangely accurate fractal Aug 20th I suggested that Eth would enter a sideways channel. That is now confirmed. How could I have know that without a crystal ball?
Fractals are a mathematical anomaly. Price action "respects" these "trendlines" & patterns so perfecly. Yet on a graph (chart), this linear function has several veriables (y=mx+b). With this may variables in a linear equation, how do you explain fractals?
- Is human behavior just simply predictably repeating?
#ETH/USDT SETUP ,Bought From $3696#ETH
The price is moving within a descending channel on the 1-hour frame, adhering well to it, and is on its way to breaking strongly upwards and retesting it.
We have support from the lower boundary of the descending channel at 3640.
We have a downtrend on the RSI indicator that is about to be broken and retested, supporting the upside.
There is a major support area in green at 3600, which represents a strong basis for the upside.
Don't forget a simple thing: ease and capital.
When you reach the first target, save some money and then change your stop-loss order to an entry order.
For inquiries, please leave a comment.
We have a trend to hold above the Moving Average 100.
Entry price: 3696.
First target: 3764.
Second target: 3826.
Third target: 3904.
Don't forget a simple thing: ease and capital.
When you reach your first target, save some money and then change your stop-loss order to an entry order.
For inquiries, please leave a comment.
Thank you.

ETH (5 year of accumulation!)ETH / USDT
📌 Background: i shared an analysis about ETH/BTC chart and i predicted the ultimate bottom, from which ETH/BTC pumped 52% and ETH/USDT pumped 97% in few days !
you can check previous analysis: click here
📌 Today we have different chart against stable coin … Ethereum is being accumulated since 5 years in mega accumulation range with 2 major stop-loss hunt (long and short)
📌 What IF ?
What if ETH made a breakout throughout this accumulation ? i think we can see scenario like that in the green candles in my chart
DO YOU AGREE ?

#ETH/USDT#ETH
The price is moving within a descending channel on the 1-hour frame, adhering well to it, and is heading toward a strong breakout and retest.
We are experiencing a rebound from the lower boundary of the descending channel, which is support at 2460.
We are experiencing a downtrend on the RSI indicator, which is about to break and retest, supporting the upward trend.
We are heading toward stability above the 100 moving average.
Entry price: 2540
First target: 2582
Second target: 2646
Third target: 2717

ETH Breaks Out of Falling Wedge, Eyes $2800 TargetEthereum (ETH) has broken out of a falling wedge pattern, signaling a potential bullish move. If the breakout sustains, the price could rally towards the projected target in the $2800 region, based on the wedge’s height.

Ethereum (ETH): Bullish momentumEthereum (ETH): Gaining Strength as BTC Flows Shift
Ethereum is entering a key momentum shift, signaling the beginning of a bullish cycle as it starts absorbing liquidity from Bitcoin. Over the past seven days, BTC has seen a -1% decline, while ETH has gained +3.8%, indicating a potential rotation of capital into ETH.
This shift marks the start of Ethereum's next breakout phase, as it prepares to challenge the critical $4,400 resistance from May 2021. Successfully breaking this level could pave the way for a new all-time high, with a long-term target of $6,600 by the end of 2025.
Key Levels to Watch
Short-Term Target: $4,400 – Breaking this level confirms Ethereum’s strength.
Mid-Term Resistance: $5,200–$5,500 – A breakout above this range would accelerate the bullish scenario.
Long-Term Target: $6,600 by late 2025, fueled by capital inflows and increasing ETH dominance.
Conclusion: ETH Entering a Bullish Phase
Ethereum is showing early signs of strength, with capital rotation from BTC supporting a potential major breakout. The next critical step is breaking $4,400, which could open the path toward a new all-time high and a long-term bull run toward $6,600. The market is now shifting, and ETH is positioning itself as a dominant player in the next phase of the bull market.

Ethereum Holds Strong – $4K Target in Sight?#Ethereum has bounced off its long-term trendline support for the third time, maintaining a strong bullish structure.
Upcoming Resistance is at $2,900 and $3,250, with $4,000 as the next major target.
A sustained move above $2,900 could push ETH toward $3,250.
A breakout above $3,250 would confirm further upside. Losing trendline support may invalidate this setup.
DYOR, NFA

ETH mid term Long + scalp short .ETH Move average is heavy and strong , im waiting for a short term scalp short for 1 percent and after that
Big move +20% percent swing Long
#ETH #long #midterm

ETHUSDT TRADING POINT UPDATE >READ THE CHAPTIAN Buddy'S dear friend 👋
SMC Trading Signals Update 🗾🗺️ crypto Traders SMC-Trading Point update you on New technical analysis setup Ethusdt looking higher level pullback up trend 📈 RSl and EME) INDICATOR) Technical patterns Ethusdt bullish trend 📈🚀 4TF Close above EMA) More bullish )
Key Resistance level 3342+3431+3525+3749 +4111
Key support level 3052 - 2979 - 2920
Support 💫 My hard analysis setup like And Following 🤝 me that star ✨ game 🎮

"Ethereum (ETH) Technical Analysis | Long-Term Breakout Potentia1. Overall Chart Pattern:
On the weekly timeframe, Ethereum is forming a long-term symmetrical triangle.
This pattern indicates price consolidation, which can lead to a strong breakout in either direction.
2. Key Resistance Levels:
$3,500 - $3,700:
This range acts as a significant resistance and has previously halted price rallies.
$4,800:
If the first resistance is broken, this level becomes the next target.
$7,300:
A long-term target in case of a breakout above the triangle's upper boundary.
Ethereum (ETH) Technical Analysis Based on the Chart:
1. Overall Chart Pattern:
On the weekly timeframe, Ethereum is forming a long-term symmetrical triangle.
This pattern indicates price consolidation, which can lead to a strong breakout in either direction.
2. Key Resistance Levels:
$3,500 - $3,700:
This range acts as a significant resistance and has previously halted price rallies.
$4,800:
If the first resistance is broken, this level becomes the next target.
$7,300:
A long-term target in case of a breakout above the triangle's upper boundary.
3. Key Support Levels:
$3,000:
A strong support zone and the intersection of the triangle’s lower trendline.
$2,500:
A critical support in case the initial support is breached.
4. Price Pattern Analysis:
The symmetrical triangle pattern suggests price consolidation, which could lead to a strong move once the price breaks either the upper or lower boundary of the triangle.
Bullish Scenario:
A breakout above the $3,500 level could push the price toward the next resistances at $4,800 and $7,300.
Bearish Scenario:
A break below the $3,000 support might drive the price toward $2,500 or even lower levels.
Suggested Trading Scenarios:
Long Position:
Entry Condition:
Breakout above $3,500 with increasing volume.
Targets:
Target 1: $4,800
Target 2: $7,300
Stop Loss:
Below $3,300
Short Position:
Entry Condition:
Break below the $3,000 support.
Targets:
Target 1: $2,500
Target 2: $2,000
Stop Loss:
Above $3,200

Fibonacci Analysis for ETH/USDT (4H Chart)Based on the Fibonacci retracement levels shown in the chart:
Current Trend:
The price is in an uptrend, breaking above key Fibonacci resistance levels. The breakout above the 0.618 level at $3,589 is a bullish signal, and the price is approaching the 1.0 Fibonacci extension level at $3,726.
Key Levels:
Support Levels:
0.618 level at $3,589: Immediate support if the price pulls back.
0.5 level at $3,357: A critical area for a stronger retracement if the price fails to sustain momentum.
0.382 level at $3,441: A secondary support zone for any minor correction.
Resistance Levels:
Current resistance at $3,726, corresponding to the 1.0 Fibonacci level. A confirmed breakout here could lead to further upside momentum.
Price Action Observations:
The higher highs and higher lows indicate continued bullish momentum. The candles show strong buying pressure, and the Fibonacci levels align with potential zones for retracement and continuation.
Trading Plan:
For Long Positions:
Enter on a pullback to $3,589 or $3,357 with tight stop-losses below the 0.5 level.
Target: Breakout above $3,726 to aim for new highs around $3,800 or more.
For Short Positions:
If the price fails to sustain above $3,726, consider shorting with targets at the 0.618 and 0.5 levels.
Momentum Confirmation:
Volume and momentum indicators should confirm the breakout above $3,726 for a sustained move higher.
This analysis highlights ETH/USDT's bullish potential, with critical retracement and extension levels providing trading opportunities.

ETH Longterm Top Around HereFrom here up to possibly $3900 should mark a long-term ETH top, I'm confident you won't want to hold this long-term. It broke it's uptrend from 2016 and just crypto all around looks to be topping. Amazing short in the works here.

ETHEREUM, a local non-investment idea, the main goal is $2.044Not a financial idea, since the forecast is calculated by the beginning of 2025, the chart has rather bearish signs, the priority is to decrease

ETH Price Setup: Why $2,840 Could Spark the Next Big Move
BINANCE:ETHUSD has been underperforming compared to BINANCE:BTCUSD and some other major cryptocurrencies, yet recent developments hint at a potential shift. Despite facing a significant resistance cluster, ETH has shown resilience by breaking above a key volume profile Point of Control (POC) level on the higher timeframe, signaling the early stages of a bullish sentiment shift.
However, to sustain this momentum, CRYPTOCAP:ETH needs to conquer a critical resistance zone, marked by a 1-week Fair Value Gap (1W FVG) and a 1-day Order Block (1D OB) – a challenging area that will likely test ETH’s ability to break out.
Chart Analysis: Key Levels to Watch
Major Resistance Zone (1W FVG & 1D OB)
The most immediate challenge for ETH is closing above the resistance zone around $2,840. This area is crucial because it combines a 1W FVG and 1D OB, both of which create a barrier that ETH needs to break through for the next leg up.
A decisive close above this level on the daily chart would turn the 1D OB into a breaker block, potentially flipping it from resistance to support and laying the foundation for a more sustained bullish displacement.
Volume Profile POC Breakout
ETH has already broken above the higher timeframe volume profile Point of Control (POC), a positive sign that suggests market interest and liquidity are shifting upwards. This break above the POC adds to the semi-bullish case, as it often signals a potential move towards filling the FVG above.
Entry Into the 1W FVG (SIBI)
Should ETH successfully close above the $2,840 level, it would enter the 1W FVG, opening up the possibility for a larger upward move. Once in this zone, buyers could gain confidence, triggering additional buy-side liquidity and a rally towards $3,100 - $3,300.
Trade Setups
Swing Trade Setup
Entry: Look for a close above $2,840. Ideally, wait for a retest of this level to confirm it as a breaker block before entering long.
Target:
Primary Target: $3,100 - within the 1W FVG zone.
Secondary Target: $3,300 - higher end of the FVG, where resistance may intensify.
Stop Loss: Set below the 1D OB, around $2,750, to protect against a failed breakout and retracement.
Rationale: A breakout and successful retest of $2,840 would signal strength, allowing ETH to push into the FVG and potentially rally toward $3,300. If buyers are strong, this could lead to a medium-term bullish trend.
Scalping Setup
Entry: Enter long on quick pullbacks to $2,750 - $2,770, close to the 1D OB support zone, or during any small dips within this range.
Target:
First target at $2,840 for a quick profit.
Second target around $2,900 - $2,950 if momentum is strong.
Stop Loss: $2,730, slightly below the 1D OB level to protect against larger sell-offs.
Rationale: For scalpers, buying dips around the 1D OB level provides a quick entry with a high probability of retesting the resistance at $2,840. This setup allows for short-term gains while taking advantage of potential volatility near the key resistance area.
Looking forward to hearing your thoughts on this!
Trade safe folks,
Cheers

ETH (Crypto ETHEREUM) SELL TF H4 TP = 2286.86On the H4 chart the trend started on Sept. 27. (linear regression channel).
There is a high probability of profit taking. Possible take profit level is 2286.86
This level, which I have outlined above, is certainly not a “finish” level. But it is the level that has the “highest percentage of hits on target.”
Using a trailing stop is also a good idea!
Please leave your feedback, your opinion. I am very interested in it. Thank you!
Good luck!
Regards, WeBelievelnTrading

ETH (Crypto ETHEREUM-USD) BUY TF H4 TP = 3347On the H4 chart the trend started on Aug. 08 (linear regression channel).
There is a high probability of profit taking. Possible take profit level is 3347
Using a trailing stop is also a good idea!
Please leave your feedback, your opinion. I am very interested in it. Thank you!
Good luck!
Regards, WeBelievelnTrading

ETH 30m I expect a correction to the buy and up ETH 30m I expect a correction to the buy zone and up. I 've disigned take profit 1 and target
