#ETH/USDT : Rebound Setup from ascending channel Support#ETH
The price is moving in a descending channel on the 1-hour timeframe. It has reached the lower boundary and is heading towards breaking above it, with a retest of the upper boundary expected.
We have a downtrend on the RSI indicator, which has reached near the lower boundary, and an upward rebound is expected.
There is a key support zone in green at 2930. The price has bounced from this zone multiple times and is expected to bounce again.
We have a trend towards consolidation above the 100-period moving average, as we are moving close to it, which supports the upward move.
Entry price: 2971
First target: 3003
Second target: 3050
Third target: 3106
Don't forget a simple principle: money management.
Place your stop-loss below the support zone in green.
For any questions, please leave a comment.
Thank you.
Ethtrading

EthereumETHUSD
- Bearish Channel as an corrective pattern in Long Time Frame
- RSI - Divergence
- Break of Structure
- Symmetrical Triangle in Short Time Frame
- Change of Characteristics

ETH Is Not Weak — This Is Smart Money Reloading Before the PUSHETH / USD – 1H
1. Market Structure (What Price Is Really Doing)
ETH has returned precisely into the previous range support zone (~2,900–2,930).
The sell-off did not break structure impulsively — instead, price formed compression + shallow lower wicks, signaling sell-side liquidity absorption.
The recent down move is corrective, not a trend reversal:
Lower highs are short-lived
No strong bearish expansion
Buyers step in immediately at range low
➡️ This is range re-accumulation, not distribution.
2. Key Levels
Primary Support (High-Probability Demand): 2,900 – 2,930
Range High / Resistance: 3,050 – 3,080
Upside Liquidity Target: 3,100 – 3,150
As long as ETH holds above 2,900, bullish structure remains intact.
3. Price PatH
Expected Flow:
Minor dip or sweep below 2,920 (liquidity grab)
Sharp reaction back into range
Expansion toward range high
Break above 3,080 → 3,100+
This is a classic “sell the fear, buy the base” setup inside a higher-timeframe range.
4. Macro & Crypto-Specific Tailwinds
Macro Alignment
USD momentum is weakening as markets price Fed easing in 2025.
Risk assets remain supported → ETH benefits disproportionately vs BTC during rotations.
Crypto-Specific
ETH continues to gain from:
ETF narrative speculation
Reduced net issuance (post-merge supply dynamics)
Capital rotation from BTC into ETH during consolidation phases
➡️ Macro does not support sustained downside here.
🧠 Final Takeaway
ETH is not breaking down — it is reloading at the most logical level.
Structure: Neutral → Bullish
Location: Optimal (range low)
Liquidity: Below price already taken
Bias: Upside continuation toward 3,100+
Unless ETH accepts below 2,880, this remains a buy-the-dip environment, not a short-the-rally one.

Merry ETHmas, Everyone! - A Retrace to the Daily BOS ZoneMerry Christmas, everyone! On this 24th Day of ETHmas, my True Love gave to me...a signaled return to the Daily BOS Zone with a target of the H1 BOS Source.
If you have been following our ETH analyses for the last two months, you know this has been a seemingly wild ride with ETH...BUT, it has done almost EXACTLY what our analysis of the structure said it would do. Please see our previous posts for details on how we got here.
Where are we now?:
It's Christmas Eve and we have recently seen the H1 BOS Up out of this HUGE Daily Demand Zone. We have been waiting for this, and once we got it, the next target was a retracement back down to the H1 BOS Source. NOTE: We saw the price push up after the BOS Up, but it did not pass the retest rules, so there was no strength to keep moving.
What is next?:
Now that we have seen the rejection after the H1 BOS, it's simply retracing back down to this source area. So, once we get back into the Daily Demand Zone, the target is most likely this H1 BOS Source (2776 - 2811). At that point, we have a pretty strong area of support that should hold ETH...at least give us a consolidation period for the market to determine if it's ready for the strong move up. Keep in mind this is a Daily Demand Zone, so we could see a strong bullish response out or it could consolidate here for days.
Are there Trade Opportunities?:
For now, the possible trade opportunities are to short ETH back down to this H1 BOS Source. If you've been following our analysis, you would already be in that short after the H1 BOS Up.
Once we get to this source area, aggressive traders can take a long, with a stop loss below the Daily Demand Zone.
I pray you all have a MERRY CHRISTMAS! Please send me your comments and ideas, as I would love to hear what other traders are seeing and thinking!

ETHUSD Short Setup (1H)ETH shows weakness after a strong bearish displacement, with price rejecting previous support turned resistance. Looking for continuation to the downside if structure holds.
🔻 Short Entry: 2,884.41
🛑 Stop Loss: 2,932.45
🎯 Take Profit: 2,554.91
📊 Risk / Reward: ~1:6.86
📉 Target Move: ~11.4%
📌 Confluences:
Bearish displacement
Rejection at key resistance
Clean downside liquidity
High R:R setup
⚠️ Setup invalidated with a strong close above 2,932.45.
🤡 Disclaimer: Not financial advice. Just a random trader drawing boxes and lines on TradingView. If it works, skill. If it doesn’t, market manipulation.

EthereumETHUSD
- Completed " 12345 " Impulsive Waves
- Break of Structure
- Bearish Channel as an corrective pattern in Short Time Frame
- Support Level
- Change of Characteristics

Ethereum looks good for a small long position.Ethereum looks good for a small long position. From the $2,927 range, it could rally toward $3,120. Keep a close eye on the critical level at $2,871.57. BINANCE:ETHUSDT

#ETH/USDT : Rebound Setup from ascending channel Support#ETH
The price is moving in a descending channel on the 1-hour timeframe. It has reached the lower boundary and is heading towards a breakout, with a retest of the upper boundary expected.
We are seeing a bearish trend in the Relative Strength Index (RSI), which has reached near the lower boundary, and an upward bounce is expected.
There is a key support zone in green at 3020, and the price has bounced from this level several times. Another bounce is expected.
We are seeing a trend towards stabilizing above the 100-period moving average, which we are approaching, supporting the upward trend.
Entry Price: 3100
First Target: 3200
Second Target: 3295
Third Target: 3395
Remember a simple principle: Money Management.
Place your stop-loss order below the green support zone.
For any questions, please leave a comment.
Thank you.

ETH Trade Plan (December 12, 2025)ETH Trade Plan (December 12, 2025)
(D1 / H4 / H1 / M15)
⬛️ 1. Higher Timeframe Context (D1 and H4)
• D1 bias: bullish
• D1 range (approx): $3,000 – $3,500
• Key D1 zones:
• Supply: $3,450–$3,500
• Demand: $3,000–$3,192
• H4 bias: buy dips
• H4 zones of interest:
• H4 Sell Zone 1: – previous highs
• H4 Buy Zone 1: – support cluster
Active setups trend-aligned.
⬛️ 2. Preferred Setups by Horizon
🔳 2.1 Swing Setup (D1/H4)
• Idea: Buy dips to $3,192 (trend-aligned).
• Time horizon: multi-day.
• Context: On-chain + macro.
🔲 2.2 Intraday Setup (H1 focus)
• Idea: Long above $3,250.
• Time horizon: intraday.
• Context: Impulse regime.
▫️ 2.3 Scalp Setup (M15 focus)
• Idea: Buy pullbacks with absorption.
• Time horizon: minutes–hours.
▪️ 2.4 Arbitrage/Pairs Concept
• None.
⬛️ 3. Entry Zones and Triggers
🟩 3.1 Long Setup (Trend-Aligned)
• Execution timeframe: H1
• Trigger timeframe: M15
• Entry zone:
• Context: H4 demand.
• Pattern tags:
Trigger conditions:
• Hold support + positive delta.
• ML-Predictive (15m): upside ≥ downside.
• Risk not extreme.
🔴 4. Stops (Invalidation Levels)
Long setups:
• Stop: $3,100.
• Logic: Demand break.
🟢 5. Targets
Long:
• TP1: $3,300 – H1 level.
• TP2: $3,450 – H4 supply.
• TP3 (optional): $3,500 – D1 objective.
⬛️ 6. Position Sizing
• Baseline risk:
• Trend-aligned: 1.0.
• Adjust: medium uncertainty (Fed).
Final: 0.7 for long.
⬛️ 7. Risk Flags
• Fed event.
• Put skew.
• Mixed flows.
⬛️ 8. Flip Conditions
• Long to bear: Below $3,192 + sell delta.
⬛️ 9. Alternative Scenario
Rejection at $3,450: short zone $3,400–$3,450, stop $3,500, targets $3,300/$3,192. Failed break vs continuation.
⬛️ 10. Model Self-Critique
• Assumptions: Rally on macro, no surprise.
• Vulnerabilities: Risk-off.
• Do not overleverage pre-event.
⬛️ 11. Uncertainty and Constraints
• Uncertainty.level: medium.
• Avoid leverage, require confirmation.

EthereumETHUSD
- Completed " 12345 " Impulsive Waves and " AB " Corrective Waves
- Break of Structure
- Sell Side Liquidity
- Break of Structure
- Bullish Channel as an corrective pattern in Long Time Frame

ETH Trade Plan (December 10, 2025)ETH Trade Plan (December 10, 2025)
(D1 / H4 / H1 / M15)
⬛️ 1. Higher Timeframe Context (D1 and H4)
• D1 bias: bullish
• D1 range (approx): $3,000 – $4,000
• Key D1 zones:
• Supply: $3,800–$4,000 (historical resistance)
• Demand: $3,000–$3,300
• H4 bias: buy dips
• H4 zones of interest:
• H4 Sell Zone 1: – highs cluster
• H4 Buy Zone 1: – OB + demand
Active setups are trend-aligned with D1/H4.
⬛️ 2. Preferred Setups by Horizon
🔳 2.1 Swing Setup (D1/H4)
• Idea: Buy dips to $3,300 for $4,000+ (trend-aligned).
• Time horizon: multi-day.
• Context: Macro risk-on + on-chain strength.
🔲 2.2 Intraday Setup (H1 focus)
• Idea: Long above $3,370.
• Time horizon: intraday.
• Context: H4 impulse + rally regime.
▫️ 2.3 Scalp Setup (M15 focus)
• Idea: Buy pullbacks to $3,350 with absorption.
• Time horizon: minutes–hours.
▪️ 2.4 Arbitrage/Pairs Concept (if relevant)
• Long ETH/BTC – outperforming bias.
⬛️ 3. Entry Zones and Triggers
🟩 3.1 Long Setup (Trend-Aligned)
• Execution timeframe: H1
• Trigger timeframe: M15
• Entry zone:
• Context: H4 demand, whale flows supportive.
• Pattern tags:
Trigger conditions:
• Reclaim above $3,370 with positive delta.
• ML-Predictive (15m): upside ≥ downside.
• No extreme risk flags.
🔴 4. Stops (Invalidation Levels)
Long setups:
• Stop: $3,300.
• Logic: Break of demand; idea wrong below.
🟢 5. Targets
Long:
• TP1: $3,500 – H1 extension.
• TP2: $3,800 – H4 supply.
• TP3 (optional): $4,000 – D1 objective.
⬛️ 6. Position Sizing
• Baseline risk:
• Trend-aligned setups: 1.0.
• Adjust: low uncertainty + high alignment.
Final: 1.0 for trend long.
⬛️ 7. Risk Flags
• Put skew volatility.
• Fed event risk.
• High OI crowding.
⬛️ 8. Flip Conditions
• Long to bear: Close below $3,300 + negative funding.
⬛️ 9. Alternative Scenario
Rejection at $3,800: double top, short zone $3,750–$3,800, stop $3,850, targets $3,500/$3,300. Differs as failed breakout vs continuation.
⬛️ 10. Model Self-Critique
• Assumptions: Rally sustains on macro, no Fed surprise.
• Vulnerabilities: Sudden risk-off, misinterpreted flows.
• Do not chase highs without confirmation.
⬛️ 11. Uncertainty and Constraints
• Uncertainty.level: low.

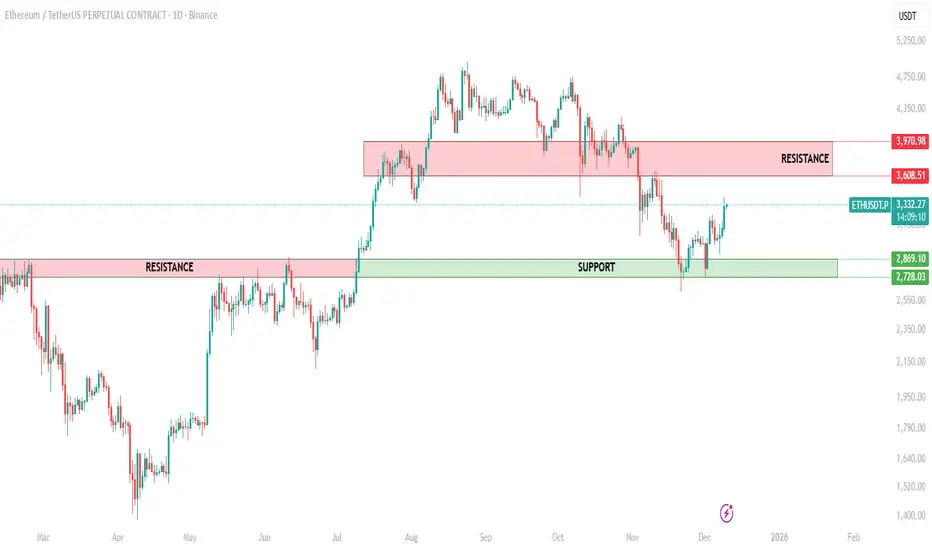
ETH Daily Chart UpdateEthereum has bounced strongly from the key support zone at 2728–2869 and is now pushing upward. This level has acted as a reliable demand area throughout the year, and the latest reaction confirms buyers are active again.
The next major hurdle is the resistance zone at 3608–3970. ETH will need a clean breakout above this range to open the door for a larger trend continuation.
For now, the structure remains intact:
• Support held perfectly
• Momentum shifting upward
• All eyes on the resistance above
ETH: Upward!Ethereum has managed to rise towards the $3,100 level in recent hours. We still assign a 40% probability that, as part of blue wave alt.(b), ETH will move above resistance at $3,656 before selling off into our green Target Zone between $2,228 and $1,789. In our primary scenario, we also expect ETH to reach this zone—potentially without first exceeding the $3,656 level. In either case, once ETH enters the Target Zone, we anticipate a corrective rally, which should top out within the red Target Zone ($5,805 – $7,326) at the high of magenta wave (B).

Sideway but Dangerous – SOL Is About to Choose a Direction!If I had to pick a market that is “walking instead of running”, SOLUSDT is the perfect example right now . Recent news has been mixed: on one hand, ETF flows, staking, and long-term optimism are supportive; on the other hand, broad crypto selling pressure prevents SOL from making a clean breakout. The result: price is stuck in a tight tug-of-war zone , unable to rise strongly but also not breaking down clearly.
On the chart, price is moving inside a sideway box around 2,790 – 3,210 USDT , with the long-term descending trendline and the Ichimoku cloud acting as dynamic resistance. Every time price approaches 3,200, selling pressure emerges, and when price retreats toward 2,800, buying support shows up. This structure signals that SOL is currently in an accumulation – waiting phase, not firmly controlled by bulls or bears.
Given this backdrop, I do not see this as a perfect moment to trade strong trends. Instead, it makes more sense to trade the range : look for bullish reactions around 2,790–2,800 for short-term buys, and consider taking profits when price retests 3,200–3,210. Only if SOL breaks clearly outside one of these boundaries (especially a decisive breakout above the descending trendline) will the situation turn into a true trending market; for now, SOLUSDT remains a sideway market, better approached with range strategies rather than predicting a breakout too early.

ETH Long RiskySpotted a potential long opportunity on ETH after a clean pullback into a demand area.
Price is currently retracing after a strong bullish leg, showing signs of slowing momentum on the way down.
🔹 Entry: 3049
🔹 Stop-Loss: 2974.72
🔹 Take-Profit: 3326.79, giving roughly a 1:4 R/R
🔹 Risk: ~2.4%
🔹 Reward: ~9.1%
Why I like this setup:
Clear bullish structure on the higher timeframes
Liquidity grab below previous lows
Price pulling back into a strong demand zone
Good risk-to-reward for a continuation play
Waiting for confirmation before full entry — a change of character (CHoCH) or bullish rejection wick would strengthen the setup.
Let’s see how it plays out. 🚀

ETHUSD - Bullish Setup with Clear Risk-RewardTrade Setup:
Entry Point:
Enter at the price level of 3,020 only.
Stop-Loss:
Set the stop-loss at 2,965.86 (below the recent low), a 1.79% risk.
Target:
The target for this trade is 3,208.39, providing a potential upside of 5.17% (around 156.23 points).
Risk/Reward Ratio:
The setup offers a 3.01 risk/reward ratio—great potential for reward compared to risk.
📈 Why This Setup?
This trade has a solid risk-to-reward profile, with a clear entry point, stop-loss, and target.
The entry zone aligns with current market structure, and the target is based on key price levels.
💡 Trading Tip:
Stick to your risk management plan. Adjust the trade if market conditions change. Always be ready for any market movements!
Let’s see how this setup unfolds! 🔥
#ETHUSD #Crypto #Trading #TechnicalAnalysis #CryptoTraders #ETH #TradeSetup #RiskManagement

Is ETH About to Drop Hard?From my perspective, ETHUSDT is showing clear weakness when combining the latest news with the current price action on the chart.
In the final days of November, the USD strengthened and risk-off sentiment spread across the crypto market , causing liquidity to stall. ETH had no positive catalysts , and multiple reports showed that price continued to remain “stuck” below the 3,000–3,100 USD zone — an environment that leans more toward downside than upside.
On the H4 chart, the 3,100 USD zone has become extremely strong resistance . ETH has been repeatedly rejected at the descending trendline — exactly the same pattern as previous reversals. Buying pressure is very weak , showing the market is not ready for a breakout.
Ichimoku also leans bearish: price is below the cloud , the future cloud is thin and sloping downward , signaling weak bullish momentum. The lower-highs, lower-lows structure further reinforces the downside bias.
If ETH continues to be rejected at 3,100, the highest-probability scenario is a pullback toward 2,950–2,980, before potentially dropping further. A very achievable target is 2,870 USD, which aligns with the support zone shown on the chart. If the market weakens further, the 2,750–2,800 zone may also be retested.

ETHUSDT: Pullback to 2,900 Before the Next DropLooking at the current price action, ETH is showing the classic signs of a weak market : shallow pullbacks, weak buying pressure , and repeated rejections at key resistance zones. Everything suggests ETH is simply taking a short pause before the next leg down.
On the H4 timeframe, price remains firmly inside the descending channel drawn on the chart. Every time ETH touches the upper boundary of the channel, it gets sold off aggressively — a pattern that has repeated consistently. The 2,900 USDT area above now acts as a confluence resistance zone: it aligns with the channel’s upper boundary and a corrective structure — the perfect place for sellers to step in.
At the moment, ETH is making a minor pullback to retest the 2,900 region, but buying momentum is fading and candles are being pushed down repeatedly. This indicates that a bearish reversal is likely forming. Once rejection confirms, the nearest target is the 2,650 support zone. If bearish momentum accelerates, ETH could slide further toward 2,550.
Reference Scenario
Main Trend: Bearish
Strategy: Wait for ETH to retest 2,900 and SELL
Targets: 2,650 – 2,780 → deeper target: 2,550

ETH idea 12.11.2025On this market, I see the potential of the two closest scenarios, on the one hand, a short at the level of 3900-4000, where I would like to see the sfp above the previous high, and then a long one, which I would like when it falls below the wall at the price of 3180

$ETH Macro planI made this CRYPTOCAP:ETH cheatsheet. I'm looking to bid 2900-2700 area. As you can see we lost the level on weekly timeframe. And retesting it this week. A close below means we will likely go to my marked area.

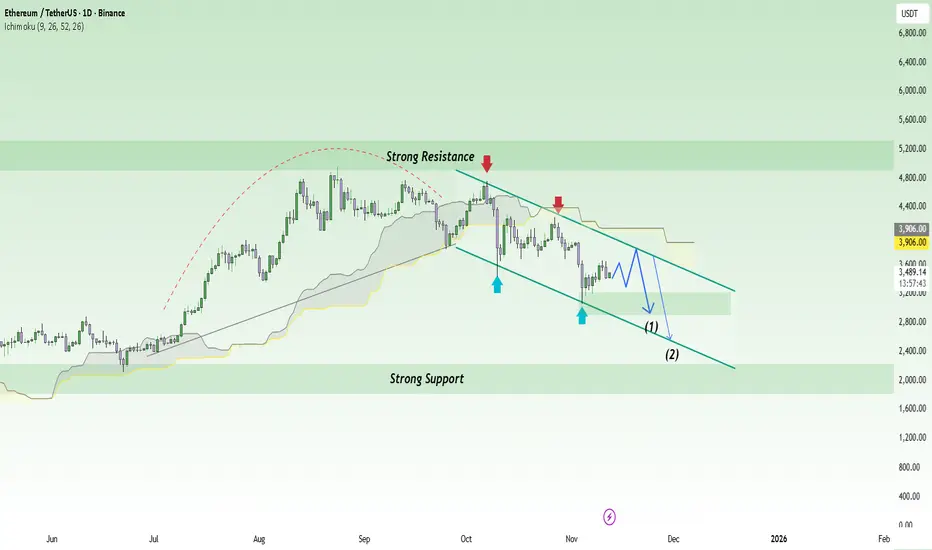
ETH Breaks Structure! Are the Bears Back in the Race?Ethereum (ETH) is entering a sensitive phase as overall market sentiment turns more cautious following recent declines across the crypto market. While it remains the leading platform for tokenization and DeFi, short-term selling pressure is becoming increasingly evident — especially as speculative capital shifts toward safer assets.
On the daily chart, ETHUSDT remains inside a medium-term descending channel , with every rebound quickly rejected at the dynamic resistance line. Price is currently trading around $3,480, signaling a weak recovery attempt while momentum remains trapped below the Ichimoku cloud.
The current scenario suggests that ETH could retest the $3,800 resistance zone before continuing its move lower toward $2,900 and $2,500 — both aligning with the lower boundary of the channel and a strong support area from previous price action.
Overall, the primary trend remains bearish , and any short-term bounce is likely just a technical pause before renewed selling pressure. In the short run, the bears are clearly still in control.
#ETH/USDT Ethereum analysis#ETH
The price is moving within an ascending channel on the 1-hour timeframe and is adhering to it well. It is poised to break out strongly and retest the channel.
We have a downtrend line on the RSI indicator that is about to break and retest, which supports the upward move.
There is a key support zone in green at the 3350 price level, representing a strong support point.
We have a trend of consolidation above the 100-period moving average.
Entry price: 3397
First target: 3445
Second target: 3502
Third target: 3570
Don't forget a simple money management rule:
Place your stop-loss order below the green support zone.
Once the first target is reached, save some money and then change your stop-loss order to an entry order.
For any questions, please leave a comment.
Thank you.

ETH/USD Bearish trend analysis Read The captionSMC Trading point update
Technical analysis of (ETH/USD) on the 4-hour timeframe — aclassic retracement and continuation setup. Here's the breakdown:
---
1. Market Structure
ETH is currently in a clear downtrend — forming lower highs and lower lows.
The overall direction remains bearish, confirmed by price trading below the 50 EMA and 200 EMA.
Both EMAs are also sloping downward, reinforcing bearish momentum.
---
2. Correction Phase
After a sharp drop, ETH formed a falling wedge (a short-term corrective pattern).
It has broken out upward from that wedge — typically signaling a temporary retracement (pullback before continuation).
---
3. Key Zone (Supply / Rejection Area)
The blue box marks the supply zone or Fibonacci retracement area (0.62–0.79).
This zone also overlaps with the EMA 50 and EMA 200, creating strong confluence resistance.
The red arrow points to where a potential bearish reaction is expected — around $3,550–$3,700.
---
4. Expected Scenario
ETH may continue slightly higher to retest the Fibonacci 0.705–0.79 region.
Then a reversal (sell setup) is expected, leading to another leg down following the prevailing trend.
The target point for this bearish move is around $2,997, aligning with a previous liquidity and support zone.
---
5. Summary
Trend: Bearish
Bias: Short-term retracement → continuation lower
Key Resistance (Sell Zone): $3,550 – $3,700
Target: $2,997
Invalidation: Break and close above $3,863 (200 EMA + previous high)
Mr SMC Trading point
---
Trading Idea Summary:
“ETH remains in a downtrend. After a wedge breakout, a retracement toward the 3.55K–3.7K supply zone is likely before the next bearish continuation toward 3K. Sellers should look for confirmation signals near the resistance area.”
---
please support boost 🚀 this analysis
