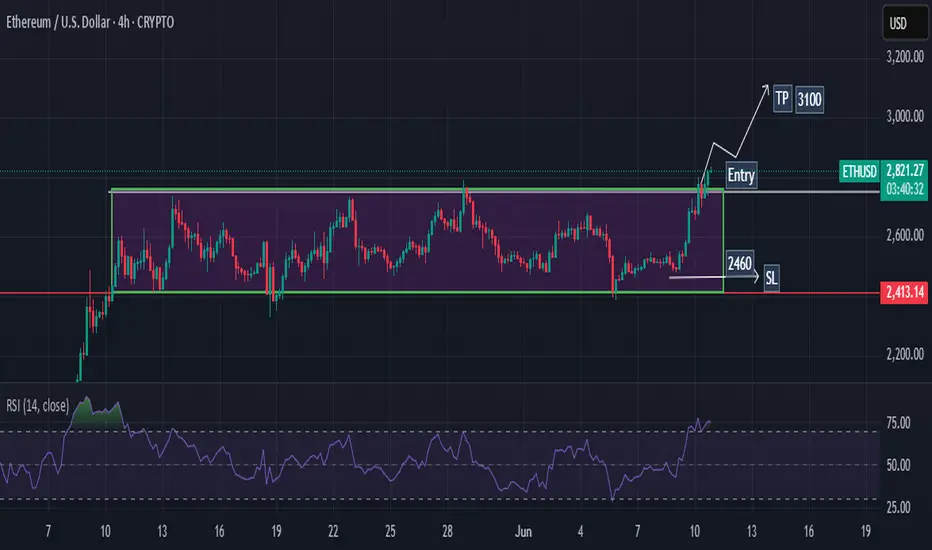
ETH | UPDATE📊 ETH Update — Momentum Zone in Focus
Ethereum is trading near an important structure area where buyers have previously stepped in. Holding above this support keeps the bullish bias intact, and a strong reaction from this zone could open the door for a move toward the next resistance level.
🔓 Entry: 2,948
❌ Stop Loss: 2,865
🎯 Target: 3,027
Volume and price behavior around these levels will be key.
Do you see continuation from here or a pullback first? Share your view below 👇
A like/support helps this idea reach more traders 🚀
⚠️ Disclaimer: This reflects personal market analysis and is not financial advice.
Ethupdate

Sideway but Dangerous – SOL Is About to Choose a Direction!If I had to pick a market that is “walking instead of running”, SOLUSDT is the perfect example right now . Recent news has been mixed: on one hand, ETF flows, staking, and long-term optimism are supportive; on the other hand, broad crypto selling pressure prevents SOL from making a clean breakout. The result: price is stuck in a tight tug-of-war zone , unable to rise strongly but also not breaking down clearly.
On the chart, price is moving inside a sideway box around 2,790 – 3,210 USDT , with the long-term descending trendline and the Ichimoku cloud acting as dynamic resistance. Every time price approaches 3,200, selling pressure emerges, and when price retreats toward 2,800, buying support shows up. This structure signals that SOL is currently in an accumulation – waiting phase, not firmly controlled by bulls or bears.
Given this backdrop, I do not see this as a perfect moment to trade strong trends. Instead, it makes more sense to trade the range : look for bullish reactions around 2,790–2,800 for short-term buys, and consider taking profits when price retests 3,200–3,210. Only if SOL breaks clearly outside one of these boundaries (especially a decisive breakout above the descending trendline) will the situation turn into a true trending market; for now, SOLUSDT remains a sideway market, better approached with range strategies rather than predicting a breakout too early.

Is ETH About to Drop Hard?From my perspective, ETHUSDT is showing clear weakness when combining the latest news with the current price action on the chart.
In the final days of November, the USD strengthened and risk-off sentiment spread across the crypto market , causing liquidity to stall. ETH had no positive catalysts , and multiple reports showed that price continued to remain “stuck” below the 3,000–3,100 USD zone — an environment that leans more toward downside than upside.
On the H4 chart, the 3,100 USD zone has become extremely strong resistance . ETH has been repeatedly rejected at the descending trendline — exactly the same pattern as previous reversals. Buying pressure is very weak , showing the market is not ready for a breakout.
Ichimoku also leans bearish: price is below the cloud , the future cloud is thin and sloping downward , signaling weak bullish momentum. The lower-highs, lower-lows structure further reinforces the downside bias.
If ETH continues to be rejected at 3,100, the highest-probability scenario is a pullback toward 2,950–2,980, before potentially dropping further. A very achievable target is 2,870 USD, which aligns with the support zone shown on the chart. If the market weakens further, the 2,750–2,800 zone may also be retested.

ETHUSDT: Pullback to 2,900 Before the Next DropLooking at the current price action, ETH is showing the classic signs of a weak market : shallow pullbacks, weak buying pressure , and repeated rejections at key resistance zones. Everything suggests ETH is simply taking a short pause before the next leg down.
On the H4 timeframe, price remains firmly inside the descending channel drawn on the chart. Every time ETH touches the upper boundary of the channel, it gets sold off aggressively — a pattern that has repeated consistently. The 2,900 USDT area above now acts as a confluence resistance zone: it aligns with the channel’s upper boundary and a corrective structure — the perfect place for sellers to step in.
At the moment, ETH is making a minor pullback to retest the 2,900 region, but buying momentum is fading and candles are being pushed down repeatedly. This indicates that a bearish reversal is likely forming. Once rejection confirms, the nearest target is the 2,650 support zone. If bearish momentum accelerates, ETH could slide further toward 2,550.
Reference Scenario
Main Trend: Bearish
Strategy: Wait for ETH to retest 2,900 and SELL
Targets: 2,650 – 2,780 → deeper target: 2,550

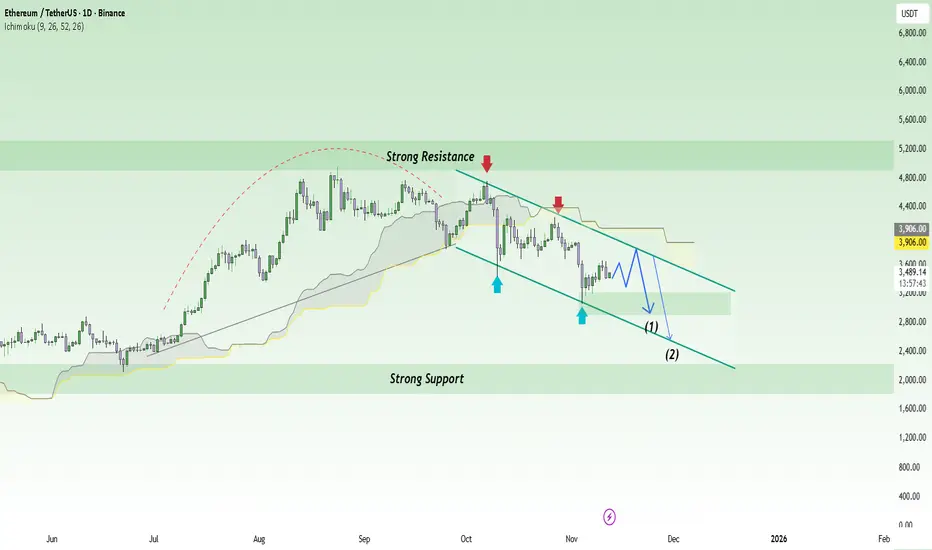
ETH Breaks Structure! Are the Bears Back in the Race?Ethereum (ETH) is entering a sensitive phase as overall market sentiment turns more cautious following recent declines across the crypto market. While it remains the leading platform for tokenization and DeFi, short-term selling pressure is becoming increasingly evident — especially as speculative capital shifts toward safer assets.
On the daily chart, ETHUSDT remains inside a medium-term descending channel , with every rebound quickly rejected at the dynamic resistance line. Price is currently trading around $3,480, signaling a weak recovery attempt while momentum remains trapped below the Ichimoku cloud.
The current scenario suggests that ETH could retest the $3,800 resistance zone before continuing its move lower toward $2,900 and $2,500 — both aligning with the lower boundary of the channel and a strong support area from previous price action.
Overall, the primary trend remains bearish , and any short-term bounce is likely just a technical pause before renewed selling pressure. In the short run, the bears are clearly still in control.
ETHUSDT – Short-Term Bounce Before Another DropEthereum is currently showing signs of a mild recovery after the sharp selloff seen earlier this week. Despite the ongoing bearish sentiment in the crypto market, a short-term rebound is forming as price finds support around the $3,300 zone.
Recent news highlights large outflows from Ethereum ETFs, signaling cautious investor sentiment. However, on-chain data also points to short-term accumulation, suggesting that some traders are taking advantage of lower prices to re-enter the market. This has helped ETH recover slightly toward the $3,700 region — a key resistance area aligned with the descending trendline and previous supply zone.
Still, the $3,700 area remains a potential turning point. If buyers fail to sustain momentum here, sellers may regain control, pushing ETH back down to $3,300 or lower in the next sessions.

BTC, ETH, SOL Support, Resistance, and Discovery Zones From HereHere's the 'heat map' for Bitcoin, ETH and Solana's prices from here.
Despite the big liquidation target zone and buy limit order concentration in the $106k zone in Green...
Price pushed higher the last few days as 'Uptober' took hold and the US Government shut down, effectively silencing any negative economic news releases.
Plus we can see that 2 more rate cuts are virtually guaranteed in October and December.
So, very likely that Bitcoin rallies to new ATH later in October into November.
However, I'm seeing sell block pressure just above on Bitcoin in the $121k - $124k range, and also on the TOTAL market cap.
What's interesting is that I'm not seeing any sell block pressure on TOTAL2 or TOTAL3, indicating that Alts are more likely to push higher from here, as BTC retraces.
What do you think?

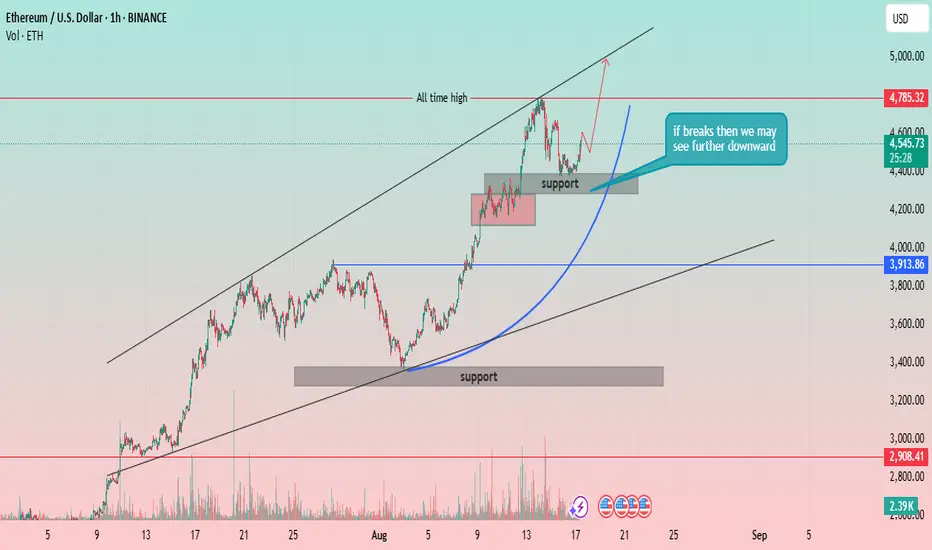
Ethereum (ETH) 1H Chart: Re-testing the All-Time High?Strong Uptrend Channel: The price of Ethereum has been moving within a well-defined ascending channel, indicated by two parallel black trendlines. This strong channel suggests a sustained bullish momentum.
All-Time High: A significant resistance level is marked as the "all-time high" at approximately 4,785.32 USD. The price has recently tested this level.
Support Levels:
Major Support Zone: A broad support zone is identified between approximately 3,300 USD and 3,450 USD. This zone has previously acted as a strong base for a price rally.
Recent Support Zone: A smaller, more recent support zone is marked around 4,200 USD. The price has consolidated within this area after its recent push towards the all-time high.
Price Action and Projections:
The price recently reached a peak near the all-time high and has since pulled back, consolidating within the recent support zone.
A key annotation states, "if breaks then we may see further downward." This highlights the importance of the 4,200 USD support zone. A break below this level could indicate a potential deeper retracement, possibly towards the lower trendline of the channel or the major support zone.
A parabolic arc is drawn (blue line), suggesting a potential trajectory for the price to continue its move higher from the current level, with a goal of re-testing or breaking the all-time high.
Volume: The chart includes a volume indicator, showing significant volume spikes during the major rallies and drops, confirming strong market interest and participation.
"ETH Breakout Watch: Holding Support for a Push Toward $1900+"ETH 4H chart par price apne key support (purple box) ke upar consolidate kar raha hai. Jab tak yeh support hold karta hai, $1900 - $1920 ka target active rahega.
Agar support toot jata hai to next major demand zone 1660-1680 ke aas paas hai. Tab tak structure bullish hai.
Trading plan simple hai:
✅ Support hold = Buy dips for $1900+
❌ Support breakdown = Wait for lower entries.
Chart clear path dikhata hai, risk manage karte raho! 🚀

Ethereum Closes with 10% Loss, Testing Key Support at $2,400Market Update:
Ethereum had a challenging week, closing with a 10% loss, briefly dipping below $2,400.
ETH is now attempting to reconfirm $2,400 as support after wiping out all gains from September, turning market bias bearish.
Technical Outlook:
Ethereum is on the verge of making a lower low, and the coming days are crucial for the remainder of the month.
If weakness persists, the price could drop to $2,200, but if buyers return, a recovery towards $2,500 is possible.
#Ethereum #ETH #CryptoMarket #BearishBias #PriceAction #SupportLevels #ETHUpdate

Quick Bitcoin UpdateHello traders,
Checkout the latest update on Bitcoin. As expected rejected from resistance. Checkout the last video also

#ETH: UPDATE
Ethereum is currently encountering a crucial price range between $2370 and $2400, with the lower trendline of this range serving as a formidable resistance. Presently, Ethereum is experiencing rejection at this level, indicating a significant challenge for bullish momentum.
For the bulls to gain control and initiate an upward trend, it is essential for Ethereum's price to break through the resistance presented by the $2370 to $2400 range. If successful, this could signal a positive shift in market sentiment.
However, should the prevailing bearish pressure persist, there is a likelihood that Ethereum may face rejection and decline towards the lower support level. Traders and investors are advised to stay informed and monitor the market closely for updates on the evolving situation. I will provide further updates as the scenario unfolds.

Ethereum is struggling with an important key levelFundamenta Aspect
Ethereum Upgrade Delays 'Difficulty Bomb', more on my blog as I cannot paste the link here.
Technical Aspect
Ethereum is establishing fresh support above the $3,500 level, and if buyers continue to break over the crucial resistance level of $4,000, the price may begin a new rally.
If buyers continue to sway the market, the nearest obstacle they will encounter is at the $4,000-$4,150 level. The price's first significant resistance level is at $3,950, which, if broken, might signal the commencement of a fresh uptrend in the near term.
Contrary to this assumption, if buyers can not overcome the $4,000 barrier, the downtrend may continue. In this case, the closest price support will be at $3,500 - $3550.


ETHEREUM (Technical Analysis) ✅#Ethereum fell sharply as $ 3,200 support collapsed; It was traded at the lowest price level of $ 2,807 and is now trying to return.
#ETH started a big drop from the $ 3,500 resistance range. As a result, many important support levels, including $ 3,300, collapsed and the price completely fell short of the 100-hour moving average.
With the $ 3,200 support collapsing, the bears revived and went on to crush the $ 3,000 support.
Eventually, their $ 3,000 support collapsed and the $ 2,807 floor was reached.
ETH has since entered a bullish correction, with resistance levels at $ 2,920 and $ 2,950 re-conquered so far.
Meanwhile, the 23.6% Fibonacci retracement level of the recent fall has been reversed from the $ 3,455 ceiling to the $ 2,807 floor. The nearest resistance level above is considered to be around $ 3,020. The ETH/USD pair's hourly chart also shows a downtrend with resistance around $ 3,020.
Climbing and closing Kendall above $ 3,020 will probably be a good start for a bullish move. The next resistance level is expected at around $ 3,130, where the Fibonacci 50% level has fallen. Climbing to the top will provide an opportunity for an integrated ascent. The next significant resistance is in the $ 3,300 range.
If ETH is not able to climb above the resistance level of $ 3,020, the fall will probably be more severe. In this case, the nearest downstream support level is around $ 2,960.
The first strong support level is apparently forming in the $ 2,900 range. As it collapses, it is likely to fall to $ 2,750 support. With its loss, Ethereum will take refuge in the $ 2,640 support range.

ETHEREUM TECHNICAL ANALYSIS✅#ETH surpassed the $3,400 resistance level by being in a bull movement. Favorable conditions are now provided for the $3,500 level to be exceeded.
Ethereum formed a strong support base at around $3,200 and started a new uptrend. It managed to continue the resistance of $3,350 and the 100-hour moving average.
The ETH/USD pair also broke the key resistance of the downtrend line in the range of $3,360. It then paved the way for the $3,400 resistance. #Ethereum continued to move above the $3,420 level and even tested the $3,450 level.
After conquering the $3,450 peak, ETH is seen trying to stabilize its current position. So far, Fibonacci support at 23.6% has not lost the recent return of the $3,115 to $3,450 level.
Fibonacci has not missed the recent climb from $3,115 to $3,450.
The nearest resistance level upstream is around $3,420. Strong resistance has since been seen in the $3,450 range. By climbing to the top, the price will be raised to higher levels. The next significant resistance is at $3,500. Any further growth in this atmosphere would be conducive to further ETH ascent. But if #ETH is unable to climb above the $3,450 resistance level, a bearish correction will be imminent. In this case, the closest downstream support is in the $3,380 range.
The next strong support seems to be forming in the $3,350 range. A further drop is likely to signal a 50% Fibonacci level. The next hurdle for bears is likely to be in the $3,240 range.

ETH/USDTEthereum is at the resistance area as in the previous days. It needs to give a daily candle close above this area (yellow area).
Then we can expect bullish and it will go towards 4000 - 4200 area.

ETH (Update)ETH breaks the $2200 resistance and as mentioned give a good pump towards $2400. ETH tested the $2380 - $2400 resistance. We expecting a retest of the $2200 support zone now before going towards the resistance. Bitcoin is bullish and same case in ETH. Also the London hardfork is coming on 4 August and the supply shortage on exchanges ongoing. All these are strong bullish fundamentals.

ETH (UPDATE)ETH give a perfect retest of the $2000 - $2050 area and now moving up. The next resistance area is $2180 - $2200 and if broken then we will see a good pump in ETH towards $2400 - $2500 area. The support remains the same of $2000 - $2050 and as long as ETH trading above this, the bullish case is valid.
If you liked my idea, follow me for more.

ETH Analysis (1D)Ethereum doesn’t look globally good, as well. What we have is a descending triangle with the flat support which is a bearish pattern.
Moreover, there are even two strong resistances that keep $ETH from growing. Once the $1800 is broken, the massive down trend will be confirmed.
If you liked my idea, follow me for more.


ETHUSDT UpdateIf breakout the resistance line, rising is obvious in coming few hours. If not fall is predictable✌🏻
