DeGRAM | ETHUSD is preparing to rebound📊 Technical Analysis
● After a prolonged decline within a descending structure, price produced a false breakdown below the major support near 1,800 and sharply rebounded, signaling seller exhaustion and potential accumulation.
● The reaction from the lower boundary of the falling channel suggests a corrective recovery toward the descending resistance line near 2,300–2,400 if higher lows continue to form.
💡 Fundamental Analysis
● Ethereum sentiment stabilizes as network activity and staking participation remain resilient despite volatility.
● Expectations of renewed institutional flows into crypto markets support long-term recovery potential.
✨ Summary
False break below 1,800 confirmed; rebound from support underway. Upside focus toward 2,300–2,400 while price holds above key support.
-------------------
Share your opinion in the comments and support the idea with a like. Thanks for your support!
Ethusdanalysis

ETH/USD – Bearish Trend with Corrective Bullish Rally 🧱 Key Levels
🔴 Resistance Zones
2,100 – 2,150 → immediate intraday resistance
2,380 – 2,450 → major supply zone (your marked Target)
2,650 – 2,720 → higher-timeframe resistance
🟢 Support Zones
1,980 – 2,000 → short-term support
1,880 – 1,800 → strong demand (previous liquidity grab)
📐 Fibonacci Context
Price reacted around 0.86 Fib retracement, which often acts as a deep correction zone
This supports the idea of a relief rally, not instant trend flip
🔮 Projection (Based on Your Path)
Short-term:
➝ Sideways / small dip possible around 2,000
If 2,150 breaks & holds, price can move toward
🎯 2,380 – 2,450 target
Rejection below 2,100 could send price back to 1,950–1,980

ETH/USD Daily — Support Bounce Setup in a Strong Downtrend
Chart Analysis:
Market Structure:
ETH is clearly in a bearish trend on the daily timeframe. Lower highs and lower lows are intact after a sharp rejection from the major supply zone around 3,300–3,400 (yellow zone).
Impulsive Sell-Off:
The recent move down is strong and aggressive, suggesting capitulation-style selling rather than a slow grind. This often precedes at least a technical relief bounce.
Key Support Zone (Red): ~1,900–2,000
Price has tapped into a well-defined demand/support area, where buyers previously stepped in. The long lower wicks here hint at buying interest and absorption.
Proposed Entry:
The marked entry is based on a support reaction, not a trend reversal. This is a counter-trend long, so it’s tactical, not positional.
Target Zone (Green): ~2,450–2,550
This zone aligns with:
Prior structure support → resistance flip
Likely liquidity resting above
Mean reversion after an extended drop
Bias & Expectations:
Short-term: Bullish relief bounce toward the green zone
Medium-term: Still bearish unless ETH reclaims and holds above ~2,600–2,700
Expect high volatility—clean V-shaped recoveries are rare in this context
Risk Note:
If price loses the 1,900 support decisively, the setup is invalidated and opens the door for continuation toward lower psychological levels.
📌 Summary:
This chart shows a high-risk, counter-trend bounce play off major daily support, targeting a logical resistance zone above. Good for disciplined traders, not for blind bottom-catching.

Here is why I updated my Ethereum target to 30K instead of 15KYes you have read it right. I believe Ethereum will be 30K in around 18 months. Ma advice will be buy one or 0.5 Ethereum and forget about it and come back in 2027.
Disclaimer: Not financial advice. Do your own analysis

DeGRAM | ETHUSD confirmed the support line📊 Technical Analysis
● ETH/USD has completed a sharp corrective leg into the long-term descending support line near 2,200, where price shows stabilization after an impulsive sell-off. The reaction from this zone suggests seller exhaustion and a potential base formation.
● Despite the prevailing falling trend, the structure favors a rebound toward the descending resistance around 2,600–2,700, as prior breakdown levels act as magnets for corrective upside within a broader consolidation phase.
💡 Fundamental Analysis
● Medium-term expectations of easing financial conditions and continued Ethereum ecosystem development support a recovery scenario after the recent risk-off move.
✨ Summary
● ETH is holding a major descending support near 2,200.
● A corrective rebound toward 2,600–2,700 is favored while support holds.
-------------------
Share your opinion in the comments and support the idea with a like. Thanks for your support!

DeGRAM | ETHUSD is under the $3000📊 Technical Analysis
● ETH/USD remains capped below a descending resistance line after failing to reclaim the prior distribution range near 3,400, confirming a broader bearish market structure.
● Price is compressing inside a narrowing consolidation near 3,000, with repeated rejections suggesting a bearish continuation toward the lower channel support around 2,800–2,530.
💡 Fundamental Analysis
● Elevated US yields and reduced risk appetite continue to pressure crypto assets, while the absence of strong bullish catalysts limits recovery attempts in ETH.
✨ Summary
● ETH trades under long-term resistance.
● Breakdown risk remains dominant below 3,100, targeting 2,800–2,530.
-------------------
Share your opinion in the comments and support the idea with a like. Thanks for your support!

ETHUSD 2H Demand Reaction & Potential Mean ReversionThis is a 2-hour ETH/USD chart (Coinbase) showing a clear market structure shift from bullish to bearish, followed by consolidation at demand.
Key observations:
Upper Range & Supply Zone (~3,320–3,400):
Price previously traded within a defined range near supply, showing multiple rejections at the highs. This area acted as strong resistance.
Break of Structure (BOS) → Distribution:
After pushing into supply, ETH failed to hold higher highs, indicating distribution before the sell-off.
CHoCH & Breakdown (~3,080):
A Change of Character (CHoCH) occurred as price broke below prior support, confirming bearish control. This level flipped from support to resistance.Strong Impulsive Sell-Off:
Following the breakdown, price dropped aggressively, showing imbalance and momentum to the downside.
Demand Zone (~2,880–2,920):
Price reacted sharply at demand, forming long wicks and halting the decline—suggesting buy-side interest.
Lower Range Consolidation (~2,920–3,040):
ETH is currently ranging at the lows, indicating pause/accumulation after the impulsive move.
Projected Targets:
2nd Target: Return to prior structure near ~3,080
1st Target: Range midpoint / prior resistance near ~3,280
These imply a potential mean reversion or corrective move if demand holds
The chart tells a classic story:
Distribution at supply → structure break → sell-off into demand → consolidation, with upside targets mapped if the demand zone continues to defend.
If you want, I can also:

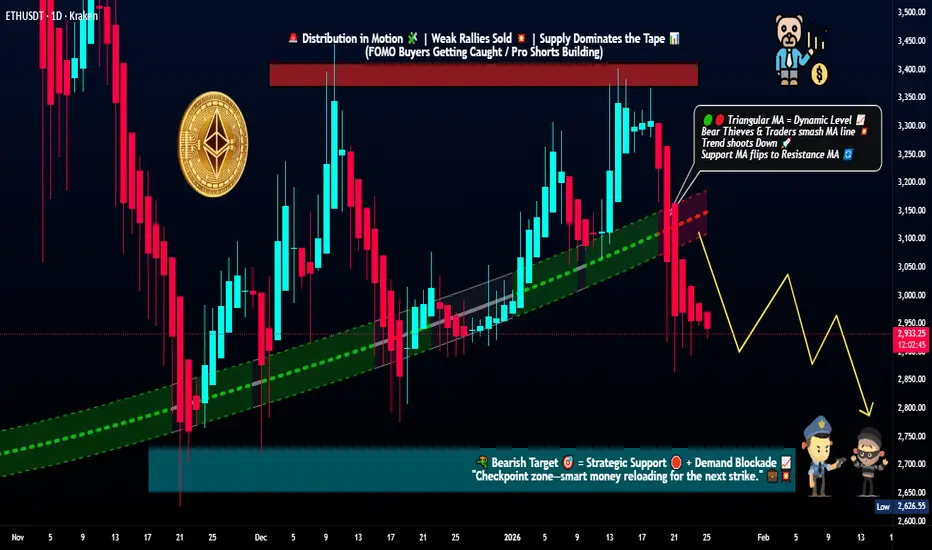
Ethereum Breaks Structure as Sellers Regain Control!🎯 ETH/USD: ETHEREUM vs TETHER - Crypto Market Profit Pathway Setup 💰
📊 Day/Swing Trade Opportunity | Bearish Momentum Confirmed ⚡
🔥 REAL-TIME MARKET DATA (January 25, 2026) 📈
Current ETH Price: $2,929 - $2,948 USD 💵
24H Volume: $8.1B - $25.89B (Extremely High Activity! 🚀)
Market Cap: $353.5B - $354.9B (#2 Crypto by Market Cap 👑)
24H Change: -0.06% to -3.07% (Bearish Pressure Building 🐻)
Market Rank: #2 Global Cryptocurrency 🥈
📉 TECHNICAL ANALYSIS & SETUP 🎨
🔴 Trade Plan: BEARISH CONFIRMATION
✅ Triangular Moving Average Breakout Confirmed
✅ Double-Top Pattern Formed at $4,000 Resistance (Major Reversal Signal! ⚠️)
✅ RSI Dropped Below 14-Week MA (Trend Reversal Confirmed 📉)
✅ Price Broke Below 100-Week EMA (5th Time Since 2022 - Historical Bearish Indicator! 🔻)
Chart Pattern: Symmetrical Triangle Breakdown + Structural Support Violation 📐
Momentum Indicators: Bearish divergence across multiple timeframes ⏱️
Bollinger Bands: Tight squeeze pattern (High Volatility Expected! 💥)
🎯 THIEF STRATEGY - LAYERED ENTRY EXECUTION 🏴☠️
💡 What is Thief Strategy?
Multiple Limit Orders (Layering Method) = Dollar-Cost Averaging into position across multiple price zones for optimal risk distribution! 🎲
🚨 RECOMMENDED SELL LIMIT LAYERS (Short Position):
Layer 1: 🔴 $3,150 (25% of Position Size)
Layer 2: 🟠 $3,100 (25% of Position Size)
Layer 3: 🟡 $3,050 (25% of Position Size)
Layer 4: 🟢 $3,000 (25% of Position Size)
Alternative Entry: Any current market price levels ($2,929 - $2,950 range) for aggressive traders 🎯
💎 Pro Tip: You can increase layer count based on your capital allocation and risk management strategy! Scale as you see fit, Thief OG's! 💪
🏆 PROFIT TARGET - "POLICE FORCE ZONE" 🚔
Primary Target: $2,700 🎯
Why This Level?
✅ Strong Historical Support Zone (Multiple bounces recorded 📊)
✅ Oversold Territory Expected (RSI < 30 anticipated 📉)
✅ Liquidity Trap Area (Institutional buyers likely positioned here 💰)
✅ Correlation with BTC Support Levels (Bitcoin dominance analysis confirms 🔗)
Potential Profit: ~8-15% from layered entries 💵
Risk-to-Reward Ratio: Approximately 1:2.5 to 1:3.5 📊
🛡️ RISK MANAGEMENT & STOP LOSS ⛔
Thief Stop Loss: $3,200 🚨
Invalidation Level: Price action above $3,200 negates bearish setup ❌
Risk Per Layer: Approximately 1.5-5% depending on entry point 📊
⚠️ IMPORTANT DISCLAIMER - READ CAREFULLY! 📢
Dear Ladies & Gentlemen (Thief OG's): 👋
I am NOT recommending you set only my TP/SL levels blindly! This is YOUR trade, YOUR capital, YOUR decision. 💯
You can make money, then TAKE MONEY at your own risk and comfort level! 🎰
Partial profits at $2,900? ✅ Your choice!
Exit at $2,850? ✅ Your prerogative!
Hold to $2,700 or beyond? ✅ Your strategy!
Risk Management is KING! 👑 Always trade with stop losses and position sizing! 📏
💱 RELATED PAIRS TO WATCH 👀
Correlated Assets for Multi-Pair Analysis:
BTC/USD (Bitcoin) 💰
Current: ~$89,100 - $93,700
Correlation: HIGH (BTC leads, ETH follows with amplified moves 📈📉)
Strategy: Watch BTC breaks below $88,000 support = ETH acceleration lower! ⚡
ETH/BTC (Ethereum vs Bitcoin Ratio) 🔄
Current: ~0.0346 BTC
Correlation: INVERSE strength indicator
Strategy: Weakening ratio confirms ETH underperformance 📉
SOL/USD (Solana) 🌟
Current: ~$137.45
Correlation: MEDIUM-HIGH (L1 blockchain competitor)
Strategy: Monitor for rotation signals from ETH to SOL 🔄
LINK/USD (Chainlink) 🔗
Correlation: MEDIUM (Ethereum ecosystem dependent)
Strategy: LINK weakness confirms ETH bearish momentum 📊
MATIC/USD (Polygon) 🟣
Correlation: HIGH (L2 scaling solution for Ethereum)
Strategy: Polygon decline = ETH infrastructure stress 🚨
AAVE/USD & UNI/USD (DeFi Leaders) 🏦
Correlation: HIGH (Ethereum DeFi ecosystem health)
Strategy: DeFi token weakness = ETH selling pressure ⚠️
Key Insight: Monitor these pairs for confirmation signals! When multiple correlated assets move together = HIGHER PROBABILITY SETUP! 🎯
🌍 FUNDAMENTAL & ECONOMIC FACTORS 📰
🔴 BEARISH CATALYSTS (Current Market Environment):
1. FEDERAL RESERVE POLICY UNCERTAINTY 🏦
❌ Interest Rates Held at 3.5%-3.75% (No immediate cuts expected! 🚫)
❌ Inflation Remains Above 2% Target (Wholesale prices +3%, Core CPI at 2.6% 📈)
❌ Jerome Powell's Tenure Ends May 2026 (Transition uncertainty ahead! ⚠️)
⚡ Impact: Risk assets under pressure as "higher for longer" narrative persists 📉
2. CRYPTO MARKET SENTIMENT - EXTREME FEAR 😨
📊 Fear & Greed Index: 24 (EXTREME FEAR ZONE!) 🔴
📊 BTC Dominance Rising: 59.8% (Capital fleeing altcoins including ETH! 🏃♂️)
📊 ETF Outflows Accelerating:
BTC ETFs: -$483M outflows (January 20) 💸
ETH ETFs: -$229M outflows (Breaking 2-month green streak!) 😱
3. GEOPOLITICAL TENSIONS & TARIFF CONCERNS 🌐
⚠️ US-Europe Tensions Escalating (Greenland disputes creating risk-off environment 🗺️)
⚠️ Tariff Threats on China (100% tariff increases = market instability! 💥)
⚡ Impact: "Crypto acts like ATM during uncertain times" - Recent 6.6% BTC drop confirms 📉
4. TECHNICAL BREAKDOWN SIGNALS 📉
🔻 Double-Top Pattern at $4,000 (Classic reversal formation! ⚠️)
🔻 $648M ETH Derivatives Liquidated (234,227 trader positions wiped! 💀)
🔻 Price Below $3,200 Key Support (January 19 breakdown confirmed 🚨)
🔻 25-Delta Skew Deterioration (Traders paying premium for downside protection! 🛡️)
🟢 POTENTIAL BULLISH CATALYSTS (Medium-Term, Post $2,700):
1. INSTITUTIONAL ACCUMULATION SIGNALS 💼
✅ Morgan Stanley ETH ETF Filing ($1.8T AUM entering market! 🏦)
✅ BitMine Aggressive Buying: 278,551 ETH purchased (30 days) = $13B+ total holdings 💰
✅ Stablecoin Growth: $300B supply, $1.1T monthly transactions (ETH ecosystem benefit! 📈)
2. ETHEREUM ECOSYSTEM DEVELOPMENTS 🛠️
✅ Pectra Upgrade Success (Improved scalability, lower gas fees ⚡)
✅ Upcoming: Glamsterdam & Hegota Upgrades (2026 implementation planned 🚀)
✅ DeFi Dominance: 68% Market Share ($68B TVL - Aave & Lido leading 👑)
✅ Layer-2 Scaling: Base & Arbitrum efficiency improvements 🔧
3. REGULATORY CLARITY POTENTIAL 📜
✅ CLARITY Act Progress (Could pass Senate in 2026 🏛️)
✅ Trump Administration Crypto-Friendly Stance (Despite current tariff concerns 🤝)
✅ Institutional Framework Development (Traditional finance integration advancing 🏦)
4. FUTURE FED POLICY EASING 📊
✅ 2+ Rate Cuts Expected 2026 (Mark Zandi, Moody's Analytics forecast 📉)
✅ Potential New Fed Chair (Kevin Hassett): "Cheaper car loans, easier mortgages" rhetoric 💰
✅ Historical Pattern: Past cycles peaked during rate hikes; current environment = rate cuts! 📈
🎲 UPCOMING ECONOMIC EVENTS TO MONITOR 📅
Critical Data Releases (Next 30 Days):
January 29, 2026: FOMC Meeting Decision 🏦
Impact: HIGH ⚡⚡⚡
Watch for: Rate guidance, Powell's press conference tone 🎤
February 2026: ISM Manufacturing PMI 📊
Impact: MEDIUM ⚡⚡
Watch for: <50 = economic slowdown = potential risk asset pressure 📉
February 2026: Monthly Jobs Report 💼
Impact: HIGH ⚡⚡⚡
Watch for: Weak job creation = Fed dovish pivot potential 🕊️
Q1 2026: Fed Chair Transition Announcements 🔄
Impact: HIGH ⚡⚡⚡
Watch for: Kevin Hassett confirmation = dovish policy expectations 📈
Ongoing: Trump Tariff Policy Updates 🌐
Impact: VERY HIGH ⚡⚡⚡⚡
Watch for: Escalation = risk-off / De-escalation = risk-on 🎢
📊 VOLUME & LIQUIDITY ANALYSIS 💧
24H Trading Volume: $3.8B - $25.89B (MASSIVE volume spike indicates institutional activity! 🐋)
Open Interest Changes: Declining futures OI = reduced speculative positioning 📉
Exchange Flows: Net outflows from exchanges = potential supply squeeze (bullish for reversal) 🔄
Whale Activity Alert: 🐋
Large liquidations observed ($648M derivatives wiped)
Smart money appears to be accumulating near support zones
Watch for $2,700-$2,750 zone for reversal signals! 👀
🎯 TRADE EXECUTION CHECKLIST ✅
Before Entering This Trade:
✅ Confirm your risk tolerance (Max 2-5% account risk recommended!)
✅ Set ALL limit orders if using layered strategy
✅ Place stop loss at $3,200 (or adjusted to your risk parameters)
✅ Monitor BTC/USD correlation (BTC leads the market!)
✅ Check upcoming FOMC announcements (Calendar marked?)
✅ Review your position size (Never over-leverage, Thief OG's! 🚫)
✅ Have profit-taking plan ready (Partial exits at multiple levels?)
✅ Confirm exchange liquidity for your order sizes
✅ Set price alerts at key levels ($3,000, $2,900, $2,700)
✅ Mentally prepare for volatility (Crypto never sleeps! 🎢)
🔥 FINAL THOUGHTS - THE THIEF OG PHILOSOPHY 🏴☠️
Trading is 90% Risk Management, 10% Entry Timing! 💯
This setup presents a HIGH-PROBABILITY bearish scenario based on:
✅ Technical breakdown patterns
✅ Macro economic headwinds
✅ Market sentiment extremes
✅ Historical correlation data
✅ Real-time volume analysis
BUT REMEMBER: 🧠
Markets can remain irrational longer than you can remain solvent!
Unexpected news can flip the script instantly!
ALWAYS protect your capital with stop losses!
NEVER trade with money you can't afford to lose!
Take profits when you have them - "Pigs get slaughtered" 🐷
💬 COMMUNITY ENGAGEMENT 🤝
Like this idea? Smash that 👍 button!
Disagree? Drop your counter-analysis in comments! 💬
Following this trade? Update us on your results! 📊
Let's make money together, Thief OG's! 💰🎯🔥
🏴☠️ Trade Smart. Trade Safe. Trade Like A Thief OG! 🏴☠️
#ETHUSD #Ethereum #CryptoTrading #TechnicalAnalysis #BearishSetup #DayTrading #SwingTrading #ThiefStrategy #TradingView #CryptoAnalysis #RiskManagement #FOMC #FederalReserve #DeFi #Layer1 #SmartContracts #Blockchain #TradingIdeas #ChartPatterns #PriceAction 🚀📊
DeGRAM | ETHUSD is preparing for a local pullback📊 Technical Analysis
● ETH/USD is testing the support line at $2,811.77 after a rejection from the resistance zone near $3,100.00.
● The price is forming higher lows above the support, suggesting a potential bullish continuation if it holds the current support levels.
💡 Fundamental Analysis
● Ethereum has seen increased network activity, with more decentralized applications (dApps) pushing the demand for ETH.
✨ Summary
● Key support is at $2,811.77, while resistance lies around $3,100.00. Look for a rebound off support for a short-term bullish move.
-------------------
Share your opinion in the comments and support the idea with a like. Thanks for your support!

DeGRAM | ETHUSD held the resistance area📊 Technical Analysis
● ETH/USD broke down from a rising channel after failing to hold the upper trendline, followed by a sharp impulsive sell-off that invalidated the prior bullish structure. The loss of the key resistance zone near 3,050–3,080 confirms a bearish shift in market control.
● Price is now testing a broader support cluster around 2,880–2,920, with lower highs and weak rebounds suggesting corrective bounces rather than reversal, opening risk toward 2,800 and below if support fails.
💡 Fundamental Analysis
● Ethereum remains pressured by overall crypto risk-off sentiment, firm USD conditions, and reduced speculative appetite, limiting upside flows into major altcoins.
✨ Summary
● Medium-term bearish bias. Resistance at 3,050–3,080, key support at 2,920. Breakdown favors continuation toward 2,800 while below former channel resistance.
-------------------
Share your opinion in the comments and support the idea with a like. Thanks for your support!

ETH Price Action – Smart Money Pullback TradeMarket Structure Overview
Higher Timeframe Bias: Bullish
ETH has been making Higher Highs (HH) & Higher Lows (HL) inside an ascending channel.
Multiple BOS (Break of Structure) confirm strong bullish momentum.
Recent CHoCH indicates a possible short-term pullback within the uptrend, not a full reversal.
📉 Current Price Action
Price is reacting at a premium zone / resistance near 3,320 – 3,350
Formation suggests distribution (equal highs + rejection wicks)
Liquidity resting above highs has likely been taken
📦 Key Zones
🔴 Supply Zone (Major)
3,320 – 3,350
Strong rejection area
Ideal zone for short-term shorts / pullback trades
🔵 Demand Zone (Strong)
3,080 – 3,120
Previous BOS + consolidation
High probability reaction zone
🎯 Trade Plan
📥 Entry
Around 3,290 – 3,300
After bearish confirmation (lower low on LTF)
🎯 Targets
TP1: 3,214 (partial profits)
Final TP: 3,040 – 3,030 (major demand & liquidity zone)
🛑 Stop Loss
Above 3,350
Above equal highs & supply

Ethereum Builds Strength: Day Trading Blueprint🔥 ETH/USD — Ethereum Day-Trade Breakout Blueprint 🚀 | Bullish Momentum Setup 🔍
📌 Asset: ETH/USD — Ethereum vs U.S. Dollar
📈 Market Type: Crypto | DAY TRADE Blueprint
📖 Trade Plan — Bullish Breakout Structure
ETH is building strong upward momentum with clean higher-lows and tightening price compression. Buyers are stepping in across major crypto pairs, signaling strength in the broader market cycle.
🎯 Entry
Any price-level breakout entry depending on your execution style.
🛑 Stop Loss (Risk Management First)
This is Thief SL → @ 2760
Dear Ladies & Gentlemen (Thief OG’s), adjust your SL based on your OWN strategy and risk.
⚠️ I'm NOT recommending to use ONLY my SL — your money, your rules, your risk tolerance.
🏆 Target
Moving Average is acting as strong resistance + market is entering overbought zones + potential trap formation for late buyers.
Our TP Zone → @ 3000
⚠️ Dear Ladies & Gentlemen (Thief OG’s), TP is your personal choice.
You can take profits the way YOU manage risk.
🔗 Related Pairs to Watch (Correlation Radar)
Watching correlated pairs gives confirmation + early signals of ETH strength or weakness.
1️⃣ BTC/USD (Bitcoin) — King Maker
ETH usually follows BTC’s momentum.
If BTC shows bullish continuation + strong volume → ETH breakout becomes HIGHER probability.
If BTC stalls or rejects → ETH breakouts often fail or become fakeouts.
2️⃣ ETH/BTC — Relative Strength Pair
A rising ETH/BTC = Ethereum outperforming Bitcoin.
A falling ETH/BTC = ETH lagging → Breakouts weaken.
Key Significance: Shows where smart money is rotating.
3️⃣ NASDAQ 100 / US Tech Index ( NASDAQ:NDX / NASDAQ:QQQ )
ETH has high correlation with risk-on tech sentiment.
If US tech rallies → Crypto liquidity flows → ETH bullish pressure increases.
If tech sells off → Crypto often follows.
4️⃣ DXY — U.S. Dollar Index ( TVC:DXY )
Weak USD → Crypto strengthens (inverse correlation).
Strong USD → Crypto cooling or correcting.
Watching DXY helps understand global risk appetite.
5️⃣ SOL/USD, AVAX/USD, MATIC/USD — Layer-1 Competitive Coins
High performance in these alt L1s often triggers rotation flows into ETH.
When these pump together → ETH usually follows with momentum.
📊 Why These Correlations Matter
Crypto → Highly interconnected; no asset moves alone.
BTC controls trend direction.
TradFi indices & USD influence liquidity conditions.
ETH/BTC shows smart-money rotation.
Alt-L1s show risk appetite in the broader ecosystem.
Tracking these pairs = fewer fake breakouts + stronger conviction.

Ethereum (ETH/USD) 1H Chart Observation – January 10, 2026Current price hovering around 3,094 USD with minor fluctuations (+0.08% in the recent session shown), trading in a corrective phase after the late-2025 pullback. Market Observation The 1H chart shows Ethereum consolidating in a broad range between approximately 3,040–3,160, with recent price action forming a potential base near the lower channel after a sharp decline from higher levels around 3,300+ earlier in the month.
The 200-period SMA at ~3,146 is acting as dynamic overhead resistance, capping upside attempts while providing context for the ongoing bearish pressure in the short term.
Price has found temporary support in the 3,080–3,100 zone (near recent lows), with a mild recovery attempt visible, but overall momentum remains corrective below key moving averages and prior swing highs.
Entry Zone (for study): Around the 3,080–3,100 support area or minor bounces for potential short-term rebound plays (if holding above recent lows).Hypothetical Target Levels (for analysis): Upside toward 3,120–3,146 (SMA resistance) or extension to 3,200+ on renewed buying pressure; downside risk to 3,040 or lower if support breaks. Risk Zone / Invalid Level (example): A decisive close below 3,080 (recent session low) would invalidate the current stabilization and suggest deeper retracement toward 2,900–3,000 range. Ethereum continues to exhibit choppy price action in early 2026 amid broader crypto market consolidation, with the 200 SMA serving as a critical level to monitor for any shift in short-term trend momentum. #Ethereum #ETH #CryptoAnalysis #TechnicalAnalysis #TradingView This is an educational observation, not financial advice. Always do your own research and trade responsibly. Not a trading call.

ETHUSD | Corrective Price Action, Before a Relief RallyHi traders,
I can see that price is moving inside a contracting triangle where price is making lower highs and higher lows. This pattern creates a lot of liquidity on both ends because buyers and sellers are equally placing their orders.
From an Elliott perspective, the structure fits a clean ABCDE corrective triangle. Right now, price is approaching the (e) leg.
Afterwards, I'm expecting price to break the triangle shape towards $3300, $3450, $3590
Good Luck!

DeGRAM | ETHUSD broke out of the triangle📊 Technical Analysis
● ETH/USD is forming a long-term ascending base after the major low near ~$2,600, with price stabilizing along the rising support line and completing a broad consolidation triangle. The breakout from this formation suggests a potential trend change after the extended downtrend.
● The downward sloping resistance line from the 2025 highs provides the next objective. A reclaim above the ~$3,400–3,500 region would signal structural recovery and continuation toward higher long-term targets.
💡 Fundamental Analysis
● Ethereum’s fundamentals remain strong with continued network growth, increasing staking activity, and renewed institutional interest in ETH-related products, which supports a sustained long-term recovery narrative.
✨ Summary
● Long-term bullish bias. Support holds at the rising trendline. Key breakout region: ~$3,400–3,500. Targets above resistance line uphold continuation potential.
-------------------
Share your opinion in the comments and support the idea with a like. Thanks for your support!

ETHUSD: Ethereum Wave Structure Awaits ImpulseETHUSD: Ethereum Wave Structure Awaits Impulse
ETHUSD Wave Overview (D1 and H4)
As a trader who has been practicing wave analysis for over ten years, I note that the current picture for Ethereum shows the completion of an extended corrective formation and the potential for a new move.
Chart D1: The global structure indicates that the market is gradually breaking out of its sideways range. The wave formation looks like the end of a correction, which is laying the foundation for the next impulse.
Chart H4: Local dynamics confirm the first signs of an impulse. Key entry points are forming here, which could mark the beginning of a larger wave.
Main Scenario
After the completion of the corrective phase, a downward impulse sequence is expected to develop. This movement may be accompanied by increased seller activity and a shift in focus to the downside.
Alternative Scenario
If the price holds above local peaks and forms a stable upward impulse structure, the focus will shift to continued growth. In this case, the correction will be considered incomplete, and Ethereum may experience an additional rebound.
Trading Idea
Conservative approach: wait for confirmation of a breakout of key levels and enter with the trend.
Aggressive approach: use local impulses on H4 for earlier entries, but with short stops.
In both cases, it is important to maintain strict risk management and adjust the plan as new impulses emerge.
Results
ETHUSD is at a crossroads between the end of the correction and the beginning of a new impulse. The wave structure on D1 and H4 provides clear guidelines for action: watch for confirmation of the scenario and act with discipline.

ETHUSD Long Analysis**ETHUSD Long Analysis**
Ethereum is reacting from a strong **support zone around 3090**, where price has shown rejection and buyer interest. The recent move suggests a **break from the descending structure**, signaling potential bullish reversal from this demand area.
As long as ETH holds **above 3090**, upside momentum could build toward the **3280 target**, which aligns with the next key resistance zone.
**Bias:** Bullish above 3090
**Target:** 3280
**Invalidation:** Sustained break below 3090
---
#ETHUSD
#Ethereum
#BullishBias
#SupportZone
#CryptoAnalysis
#PriceAction
#TechnicalAnalysis
**Not financial advice. Trade at your own risk.**

DeGRAM | ETHUSD formed a rising bottom📊 Technical Analysis
● ETH/USD remains in a broader descending structure but has stabilized at the lower channel support near 2,850–2,900, where price formed a clear higher low. The reaction from this zone suggests seller exhaustion and medium-term base formation.
● Price is consolidating inside a rising micro-channel while holding above the support line. A sustained move above 3,050 would open room toward the descending resistance near 3,200–3,300, confirming a corrective bullish phase.
💡 Fundamental Analysis
● Ethereum is supported by improving risk sentiment and continued institutional interest in ETH infrastructure, while USD momentum remains mixed, allowing recovery setups in major crypto assets.
✨ Summary
● Medium-term long from channel support. Key support: 2,850–2,900. Targets: 3,200–3,300. Bullish structure weakens below 2,800.
-------------------
Share your opinion in the comments and support the idea with a like. Thanks for your support!

Ethereum - The bearmarket is not over yet!🪚Ethereum ( CRYPTO:ETHUSD ) can still drop about -30%:
🔎Analysis summary:
Over the past four years, Ethereum has been creating a major bullish triangle. With the recent all time high retest, we are now seeing an expected reversal. But considering the bullish nature of this triangle, Ethereum will head higher after a retest of the next support.
📝Levels to watch:
$2,000
SwingTraderPhil
SwingTrading.Simplified. | Investing.Simplified. | #LONGTERMVISION

ETHUSD - Are Bears Ready for the Fall?ETHUSD on the 4H timeframe is clearly in a corrective downtrend, not a healthy bullish structure. The price action fits an Elliott Wave decline where wave 3 already completed near 2620 , followed by a weak and overlapping recovery that looks like wave 4. That recovery stayed inside a falling channel and never showed impulsive strength, which already tells you buyers are weak. More importantly, wave 4 is flirting with wave 1 territory, which puts the entire bullish hope on thin ice.
Right now, ETH is at a make or break zone. If this move is just a fake breakdown, price must quickly reclaim the channel and hold above recent highs. If not, then this is likely wave 5 of C, and downside continuation becomes the dominant scenario. The structure favors a final flush toward the 2380 to 2350 area, where wave 5 projection and channel support align. Anyone blindly bullish here is ignoring structure. This is not a buy the dip market, it is a wait for confirmation or respect the downtrend market.

Ethereum (ETHUSDT): Short-Term Recovery Attempt Hi guys!
ETH is still trading inside a well-defined descending channel, keeping the broader short-term structure bearish. The previous upside breakout attempt near the upper boundary resulted in a clear fakeout, confirming strong supply pressure at higher levels. Following that rejection, price experienced a sharp sell-off and formed a notable double bottom structure around the 2,800–2,850 zone, indicating demand absorption and short-term stabilization.
Currently, price is consolidating below a key supply zone around 3,000–3,020, which acts as a pivotal decision area. This zone aligns with prior intraday resistance and must be reclaimed to confirm further upside. A sustained breakout and acceptance above this area would open the path toward the upper channel resistance near 3,125–3,130, which is the next major technical target.
On the downside, failure to hold above the current support zone would invalidate the recovery structure and could lead to another retest of the recent lows.

ETHUSD Bull Trap? - Final Breakdown Setup Is Almost Locked InETH is still stuck inside a clear falling channel, and the entire pattern is behaving like a corrective downtrend. The recent bounce from 2620 looks sharp, but it’s still just a counter-trend move. Nothing here screams trend reversal yet.
Wave 3 ending at 2620 , and now the price is rising for a Wave 4 retracement. Wave 4 usually moves back toward the mid-channel and tests previous breakdown zones.
The red box around 3200–3300 is the key trap zone. This is where sellers can return because Wave 4 must not enter Wave 1 territory, which sits higher. As long as ETH stays under that invalidation level, the bearish structure remains fully intact.
The move looks like a classic (a)-(b)-(c) correction inside Wave 4. Once this corrective bounce completes, the chart suggests ETH will resume the downward path. The channel alignment and wave symmetry both support a final Wave 5 drop.
If the bearish count plays out, ETH could slide toward 2400 – 2300 in Wave 5 before a major bottom forms. That’s the zone where sellers exhaust and buyers take control again. Until ETH breaks the invalidation level with strength, downside remains the more probable outcome.
Stay Tuned!
@Money_Dictators

ETHUSD: Reversal or Another Bull Trap?Look at this:
ETH played the trap perfectly. After pushing into the 3200–3400 resistance zone, price failed to sustain above it and rolled over, confirming that the move was distribution, not strength. Sellers stepped in exactly where a Wave 4 rally should fail.
The rejection was followed by a clean breakdown of the parallel rising channel, which shifts the short-term bias back in favor of the bears. That channel was the last structure holding the corrective bounce together. Once it broke, the bullish case weakened sharply.
This drop reinforces the view that the move up from 2620 was only a Wave 4 correction, not the start of a new trend. With Wave 4 likely complete, ETH appears to be transitioning into Wave 5 of the broader corrective decline.
As long as price remains below the broken channel and prior resistance, downside continuation remains the dominant scenario. The structure opens the door for a retest of 2620 , with a deeper extension toward 2465 if selling pressure accelerates.
Until ETH reclaims the channel with strength and acceptance, this remains a sell-the-bounce environment. The warning came at the trap zone, and the market is now following through.
Stay Tuned!
Money Dictators,
R.D :)
