Can Ethereum’s Capital Flow Blueprint Target 4600 Next?🎯 ETH/USD "The Liquidity Thief" Strategy 💰
Weighted MA Pullback + Manipulation Grab Blueprint
📊 TRADE SETUP OVERVIEW
Asset: ETH/USD (Ethereum vs USD) | Timeframe: Swing Trade
Market Structure: Bullish Confirmation with WMA Pullback Recovery
Strategy Type: Multi-Layer Accumulation (Thief-Style Entry Method)
🎪 THE GAMEPLAN
Bias: 🟢 BULLISH — Confirmed via:
Weighted Moving Average (WMA) acting as dynamic support
Liquidity pool identification on pullback zones
Institutional accumulation patterns detected
This setup thrives on pullback retracements where smart money accumulates before the next leg up. We're essentially "stealing" liquidity at discount prices during these inefficiency windows.
🚀 MULTI-LAYER ENTRY STRATEGY (The Thief Approach)
Instead of FOMO market orders, we deploy calculated limit order layers at strategic support zones:
Entry Levels (Layer-by-Layer Accumulation):
Layer 1: $3,700 USD
Layer 2: $3,800 USD
Layer 3: $3,900 USD
(Pro Tip: Scale these layers based on your risk tolerance and account size. Tighter layers = more fills; wider layers = better average price)
Position Building: Fill partial positions at each layer, building your total exposure gradually. This reduces average entry cost and maximizes probability of initial profit.
🛑 STOP LOSS (Risk Management)
Hard Stop: $3,500 USD
⚠️ Important Disclaimer: This is YOUR trading decision. No strategy guarantees profits. Position sizing and risk management are YOUR responsibility. Never risk capital you can't afford to lose.
🎯 TARGET & EXIT STRATEGY
Primary Target: $4,600 USD
Exit Rationale:
Strong resistance zone confluence
RSI/Stochastic overbought divergence
Liquidity trap zone (potential reversal catalyst)
💡 Golden Rule: Lock in profits at $4,600 or take partial profits at resistance. Never hold through key resistance on swing trades—greed kills thief traders.
⚠️ Disclosure: Risk management and profit targets are trader-dependent. Adjust based on your strategy framework, market conditions, and account allocation.
📈 CORRELATED PAIRS TO WATCH
Monitor these assets for confluence signals and capital flow indicators:
BITSTAMP:BTCUSD (✅ High Positive Correlation) — Bitcoin sets market sentiment; ETH typically follows in lockstep. When BTC rallies, altcoins like ETH amplify the move upward.
BINANCE:ETHBTC (⚖️ Relative Strength) — ETH strength against BTC equals altseason confirmation. Rising ETHBTC ratio means Ethereum is outperforming Bitcoin—bullish for our setup.
$SPY/ IG:NASDAQ (📊 Risk Appetite) — Traditional equity weakness creates crypto pullback risk. If stocks dump, crypto usually follows. Monitor US market opens for confirmation signals.
TVC:DXY (Dollar Index) (⚖️ Inverse Correlation) — Strong dollar = crypto headwind; weak dollar = tailwind for ETH. A declining DXY supports crypto rally scenarios.
COINBASE:USDTUSD (🔒 Stablecoin Flow) — USDT accumulation signals capital waiting for entry. Rising USDT on exchanges = dry powder ready to deploy into altcoins like ETH.
Capital Flow Blueprint: When BTC holds above support AND USDT shows inflow, altcoins like ETH enter "hunter mode."
🔑 KEY TRADING PRINCIPLES (Thief OG Edition)
✨ Patience — Wait for pullback confirmation before layering in
✨ Position Sizing — Risk only 1-2% per trade; 3% absolute maximum
✨ Confluence — Entry + Support + Volume + Correlation = Green Light
✨ Discipline — Exit at target or stop loss; no emotional HODL mode
✨ Adaptation — Markets evolve; update bias if structure breaks
If you find value in my analysis, a 👍 and 🚀 boost is much appreciated — it helps me share more setups with the community!
#ETH #ETHUSD #Ethereum #CryptoTrading #TechnicalAnalysis #SwingTrading #CryptoDCA #TradingStrategy #LayerEntry #LiquidityZones #AltSeason #CryptoAnalysis #TradeSetup #RiskManagement #Thief #CommunityDriven
Ethusdanalysis

ETH Momentum Fades — Pullback Toward 3245 Expected📉 Ethereum Analysis — Pullback Setup Triggered
Ethereum has completed a sharp breakout above the previous consolidation range, pushing into the 3,350–3,365 resistance zone, but momentum has now slowed. Price is forming a potential M-top rejection, signaling a short-term reversal.
🔍 What the Chart Shows
Breakout from major accumulation range (left box).
Rising wedge / steep channel showing exhaustion at the top.
Current sideways mini-range showing loss of bullish pressure.
Ichimoku cloud below, aligning with the retest zone.
Arrow points toward the 3,245 support, which is the next high-probability retracement level.
📉 Short-Term Bias: Bearish Retracement
If ETH continues rejecting around 3,350–3,360, a clean drop into the 3,245 zone is likely as price fills the imbalance and retests cloud support.
📌 Key Levels
Resistance: 3,350 – 3,365
Immediate Support: 3,300
Main Target: 3,245
Breakout Origin: 3,110 zone
🎯 Overview
Momentum has cooled, buyers are losing strength, and structure hints at a corrective move. Expect ETH to dip before any fresh bullish continuation.

DeGRAM | ETHUSD is preparing to continue its rebound📊 Technical Analysis
● ETH broke out of a multi-week descending wedge and is now trending inside an ascending channel, confirming a structural reversal. A clean retest near 3,200 holds, opening room toward the 3,750–3,800 resistance zone.
● Rising swing lows and sustained momentum support continuation toward the upper boundary of the channel.
💡 Fundamental Analysis
● Recent ETF-driven inflows and improving risk appetite continue to support large-cap altcoins.
✨ Summary
● Long bias: holding 3,200 → targets 3,450 and 3,780.
-------------------
Share your opinion in the comments and support the idea with a like. Thanks for your support!

DeGRAM | ETHUSD will rebound from the $2800 level📊 Technical Analysis
● ETH/USD has broken above the long-term descending resistance line and is now retesting it while holding the higher-low structure near the 2,600–2,700 zone. This confirms a potential reversal from the extended corrective phase.
● Price is also rebounding from the lower boundary of the falling channel, with consolidation clusters suggesting accumulation before a move toward 3,300–3,400.
💡 Fundamental Analysis
● ETH sentiment strengthens as staking inflows rise and developers finalize key upgrades for 2026, while improved risk appetite supports large-cap crypto recovery.
✨ Summary
● Bullish bias above 2,650. Targets: 3,300 → 3,400. Support: 2,600. Resistance: 3,350.
-------------------
Share your opinion in the comments and support the idea with a like. Thanks for your support!

Ethereum Hits Demand Zone – Smart Money Reaction Begins1. Major Breakdown Completed
ETH formed a sharp sell-off leg, moving along the long diagonal trendline you drew.
This indicates strong downside momentum that has now reached exhaustion near the bottom zone.
2. Price Tapped a Key Demand Zone
The lower green/grey area marks a high-volume demand block.
ETH reacted strongly from this zone, showing:
A wick rejection
Shift in market structure
Buyers absorbing the remaining liquidity
This confirms the zone is valid.
3. Liquidity Grab at the Lows
That spike below the structure (where you marked the “M-shaped” dip) looks like a classic stop-hunt / liquidity sweep.
After grabbing liquidity, ETH bounced aggressively.
This is usually a sign of smart-money accumulation.
4. Early Trend Reversal Signals
The small bullish rally forming now suggests:
Momentum is shifting
Bears are losing control
ETH might build a new short-term uptrend from this area

Ethereum Outlook: Divergence + MA Breakout = Bearish Swing Bias🔍 ETH/USD – “Ethereum vs U.S. Dollar” Market-Capital-Flow Blueprint (Swing Trade) 💼💥
🧭 Overview
Hey Thief Tribe 👋, here’s the game plan for Ethereum (ETH/USD) in the crypto arena!
We’ve spotted a confirmed bearish breakout, with momentum fading on the downside.
This setup blends technical precision with layered stealth entries, built the Thief way 🕶️
Let’s stay sharp, swing smart, and rob those pips — professionally, of course! 😎
⚙️ Plan (Bearish Blueprint)
Two strong confirmations back the downside setup:
🔻 Moving Average Breakout – price sliced below key dynamic support (MA line).
🔻 MACD Divergence – momentum fading with lower highs on MACD.
📉 This combo confirms a short bias, preparing us for controlled, layered entries.
💰 Entry (Thief Style – Layering Strategy Explained)
This isn’t a one-shot entry — it’s a strategic ambush plan 😏
We’ll use multiple sell limit orders, spacing them for precision & flexibility:
🧩 Example Layer Setup:
1️⃣ Sell Limit – $3 900.0 → Top layer, catching early weakness near resistance.
2️⃣ Sell Limit – $3 800.0 → Second layer, adding position as momentum confirms.
3️⃣ Sell Limit – $3 700.0 → Sweet zone: aligns with MA retest area.
4️⃣ Sell Limit – $3 600.0 → Deep layer for confirmation or fake-out retrace.
💡 You can expand or tighten your layers based on volatility or personal risk tolerance.
This “scaling-in method” helps manage risk while improving average entry.
🧨 Stop Loss (Defensive Shield)
🛑 Thief’s SL: $4 000.0 — aligned with the previous Higher-High structure.
🔸 This level invalidates the bearish setup if broken with strong volume.
⚠️ Note to all Thief OG’s:
I’m not recommending you use only my SL — trade smart, adapt your protection.
Your capital, your call, your responsibility. 💼
🎯 Target (Profit Escape Zone)
💎 Target: $3 200.0 — key support confluence zone where:
Moving average = police barricade 🧱
RSI likely hits oversold region 📊
Smart money may reverse from here 🔄
So once price nears that trap-reversal area, it’s time to secure profits & vanish gracefully 🏃♂️💨
⚠️ Note to all Thief OG’s:
You’re free to adjust your take profit. When you see green, take your gain! 💰
🔗 Correlated Pairs & Market Flow Watchlist
Stay alert with cross-checks 👇
🔹 BINANCE:ETHBTC → if ETH weakens vs BTC, bearish setup strengthens.
🔹 BITSTAMP:BTCUSD → if BTC falls too, it amplifies crypto market pressure.
🔹 TOTAL / TOTAL2 (Crypto Market Cap Charts) → confirm capital flow rotation.
📊 Correlations help validate or cancel our bias. Always zoom out before striking.
✨ If you find value in my analysis, a 👍 and 🚀 boost is much appreciated — it helps me share more setups with the community!
#ETHUSD #Ethereum #CryptoSwing #BearSetup #LayeringStrategy #ThiefTrader #LimitOrders #MACDDivergence #MovingAverageBreakout #CryptoFlow #SwingTrading #CryptoMarket

Can ETHUSDT Sustain Momentum After LSMA Breakout?🔥 ETHUSDT BULLISH BLUEPRINT: LSMA Confirmed, Awaiting WMA Breakout for Range Escape! 🚀
Description:
👑 ATTENTION, LADIES & GENTLEMEN – THE THIEF OGs! 👑
Welcome to a clear, actionable blueprint for $ETHUSDT. This isn't just a signal; it's an educational opportunity to understand confluence and manage your own risk like a pro.
📈 THE BIG PICTURE (Market Context):
Ethereum is showing strength within a defined range. A critical LSMA breakout has already confirmed the underlying bullish bias. We are now waiting for the final confirmation to trigger a potential swing move UP.
⚙️ TRADE PLAN (Bullish Confluence):
Direction: Bullish 🐂
Style: Day Trade / Swing Trade
Phase: Range-Bound, awaiting bullish breakout confirmation.
Key Levels: Range resistance is the key hurdle.
🎯 KEY LEVELS & LOGIC:
🟢 TRIGGER ZONE (Entry): $3,200.00
Wait for a decisive candle close ABOVE the Weighted Moving Average (WMA) at this zone.
This WMA breakout is our awaited confirmation to join the LSMA's bullish bias.
"YOU CAN ENTRY AT ANY PRICE LEVEL AFTER THE WMA BREAKOUT" – but the $3,200 zone is optimal for confirmation.
🔴 RISK DEFINITION (Stop Loss): $2,900.00
This is MY "Thief SL" – a level that invalidates the setup.
CRITICAL NOTE: 📢 I am NOT recommending you use only my SL. ADJUST based on YOUR strategy & risk tolerance. Place your SL AFTER the MA breakout confirmation. Protect your capital first!
🟡 PROFIT TARGET (Take Profit): $3,500.00
This target aligns with a historical resistance zone where moving averages may converge.
WARNING: Be aware of potential overbought traps and resistance. "Escape with profits."
CRITICAL NOTE: 📢 I am NOT recommending you use only my TP. Manage your trade actively. "Take money at your own risk." Scale out partials or trail your stop!
💎 THE THIEF OG's GOLDEN RULES:
This is a BLUEPRINT, not financial advice.
YOU are responsible for your own trades, risk, and money management.
Confirmation > Impulse. Wait for the WMA breakout.
Always use a stop-loss. No excuses.
🔍 RELATED PAIRS TO WATCH (Correlation & Key Insights)
Monitoring correlated assets strengthens confirmation and trend accuracy.
Here are the most relevant ETH-linked market movers:
1️⃣ BINANCE:BTCUSDT – Bitcoin vs Tether
Correlation: High
Why it matters:
Bitcoin leads overall crypto sentiment.
ETH breakouts are stronger when BTC breaks key resistance zones.
If BTC rejects from MA levels, ETH often loses momentum too.
What to track:
BTC Daily MA structure
BTC dominance (BTC.D)
Volatility cycles
2️⃣ BINANCE:ETHBTC – Ethereum vs Bitcoin
Correlation: Medium–High (Relative Strength Pair)
Why it matters:
Shows whether ETH is outperforming or lagging against BTC.
A breakout in ETH/BTC gives early confirmation of strong ETH upside.
If ETH/BTC drops, ETHUSDT upside can slow even if USDT charts look bullish.
Key levels:
ETH/BTC horizontal range
MA crossovers
Relative strength slope
3️⃣ BINANCE:SOLUSDT – Solana vs Tether
Correlation: Moderate
Why it matters:
Competes with Ethereum in Layer-1 dominance.
Solana pumps often trigger temporary liquidity rotation away from ETH.
If SOL rallies aggressively, ETH may consolidate longer.
Watch for:
Layer-1 sentiment shifts
Capital rotation between SOL & ETH
4️⃣ BITTREX:MATICUSDT – Polygon vs Tether
Correlation: Medium
Why it matters:
Ethereum Layer-2 ecosystems influence ETH network usage & fees.
MATIC strong moves can signal increased demand for ETH’s ecosystem indirectly.
5️⃣ COINBASE:XTZUSD (or) BINANCE:AVAXUSDT (or) BINANCE:BNBUSDT
Correlation: Low–Moderate
Why it matters:
Any strong L1 competitor rally can pull temporary liquidity from ETH.
Helps judge broader altcoin sector strength.
🧭 KEY CORRELATION SUMMARY
BTCUSDT → Drives crypto trend direction
ETH/BTC → Determines whether ETH has relative strength
SOL, MATIC, BNB, AVAX → Track liquidity rotation
Stronger confirmations = safer ETH entry after WMA breakout

Ethereum - Another -30% correction!🥊Ethereum ( CRYPTO:ETHUSD ) continues the bearmarket:
🔎Analysis summary:
Just over the past couple of weeks, Ethereum has already been correcting about -40%. This happened due to another failed all time high breakout sending prices lower. And Ethereum can drop another -30% before it will then retest a major confluence of support.
📝Levels to watch:
$2,500 and $ 2,000
SwingTraderPhil
SwingTrading.Simplified. | Investing.Simplified. | #LONGTERMVISION

ETHUSD | Don’t get fooled...Understand the chartTL;DR: This chart looks like what happened in 2021 in a ridiculous way. A breakout, a rejection, a relief rally, then a painful descent through layered support zones.
I really don’t want to be the guy who says “I told you so” but charts teach with loss as often as profit.
Look at what happened when ETH reached ATH in 2021. A clear breakout and immediate rejection. Price then collapsed with multiple spikes to trick HODLers and bull for life traders.
----------------------------------------------
The lesson the chart here to offer
If our analysis is correct, we’ll see a short-lived manipulation into resistance ($3.6–$4.0k) that will suck in all longs.
What happens next you may ask? Straight down to support zones.
Breaking one support usually leads to the next.
----------------------------------------------
Practical rules to survive this (educational only):
Assume rallies are traps until proven otherwise. Wait for structure (higher lows + higher highs) on higher timeframes before adding long positions.
Manage size. If you trade this, keep position sizing small and protect capital with stops and trailing stops when in a winning trade.
Use multi-timeframe confirmation. Don’t buy solely on daily candles. Micro structure of a daily candle forms on smaller timeframes.
If you want to accumulate, always scale. Don’t all-in. That way you better position yourself, increase your profit and decrease your loss
As always...Stay disciplined.
----------------------------------------------
Good Luck!
P.S: Check the linked idea for a better understanding.

DeGRAM | ETHUSD held the $2800 level📊 Technical Analysis
● ETH/USD broke out of the falling channel after defending the major $2,700–$2,800 support zone, signalling a shift from corrective structure to early bullish momentum.
● Price is forming higher lows after the breakout and is positioned to retest the upper trendline near $3,100–$3,200 as long as the support zone continues to hold.
💡 Fundamental Analysis
● Crypto sentiment is stabilizing as risk assets rebound, while ETH benefits from renewed inflows into staking platforms and improving network activity, supporting a medium-term bullish outlook.
✨ Summary
● Bullish bias above $2,780. Targets: $3,050 → $3,180. Support: $2,700.
-------------------
Share your opinion in the comments and support the idea with a like. Thanks for your support!

ETHUSD – You have been warnedImagine you are on a high way speeding with a Porche 911 and running kinda low on gas, and you spot a station where you could get gas for free. You would fill 3 tanks right away, right?
That is exactly why market makers love this repeating pattern in a bearish market. Why?! Because its free "gas"...free liquidity.
descending channel → fake breakout → long manipulation → deeper bleed.
---------------------------------------------------
Look at what happened in 2024
Price broke above structure swing high, dragged liquidity, faked strength…
and instantly got rejected back down
That’s not bullish momentum. That’s a liquidity fuel for the market.
Markets do this right before a bigger move down.
---------------------------------------------------
To be honest, ETH chart is full of F U moves all over the place. But, the basic principles kinda remain intact.
In 2024 after the long manipulation, price fully respected the previous swing low.
And that should be the same case now with our swing low.
We are in a bearish trend, don't ego fight the market.
However, if price broke our previous swing low its literally free fall to $800~$1k
---------------------------------------------------
Your chart’s projection is clear:
Sweep the lows, Trap the late shorts, Send ETH flying back to $4k+
But not before the pain.
---------------------------------------------------
Good Luck!

ETH Chart doesn't look prettyI see Ethereum’s chart not looking pretty for long nor hold positions at these prices.
Price Action
ETH continues to make lower highs and lower lows inside a descending wedge.
Price is moving toward two major demand zones, and the momentum is really weak. Just minor price hiccups.
I'm expecting some choppy or even consolidation movements before a possible test of the lower demand blocks.
OBV is such an underrated indicator!
Look at OBV, this is where the things gets interesting..
OBV is breaking its trendline downward, even while price hasn’t fully broken structure yet.
This is a classic sign of volume distribution. Smart money is exiting positions quietly.
When OBV breaks direction before price, it often predicts the next major move.
At the moment, ETHUSD is looking heavily bearish. Given the fact that BTC is also giving early signs of a bearish trend, I don't think buying ETH is a good idea here. I'll wait for a deeper correction.
Good Luck!

EthereumETHUSD
- Completed " 12345 " Impulsive Waves
- Consolidation Phase as an corrective pattern in Short Time Frame
- Break of Structure
- RSI - Divergence
- Change of Characteristics

ETHUSD – Bearish Channel Respect, Flag Breakdown SetupHi
The chart illustrates a clean, structured bearish trend where price continues to respect a broad descending channel. Each major reaction level and pattern aligns well with the larger downtrend, indicating that sellers are still in control.
Price recently tapped a key flip area near the upper boundary of the channel, a crucial zone where previous support has turned into resistance. The rejection from this area confirmed a strong supply and initiated a sharp decline, marked on the chart as the flagpole.
Following the impulse drop, the market entered a consolidation range, forming a classic bear flag structure. Price corrected roughly one-third of the flagpole; a typical retracement depth before continuation in a downtrend.
The drawn projection suggests a bearish continuation from the consolidation box, with the price expected to break lower. If momentum follows the channel’s trajectory, ETH could descend toward the first S&D zone, which aligns with the lower boundary of the macro channel. The marked target around 2848 sits near a liquidity and demand cluster, making it a logical tap point before any significant reversal or larger breakout attempt.
Disclaimer: As part of ThinkMarkets’ Influencer Program, I am sponsored to share and publish their charts in my analysis.

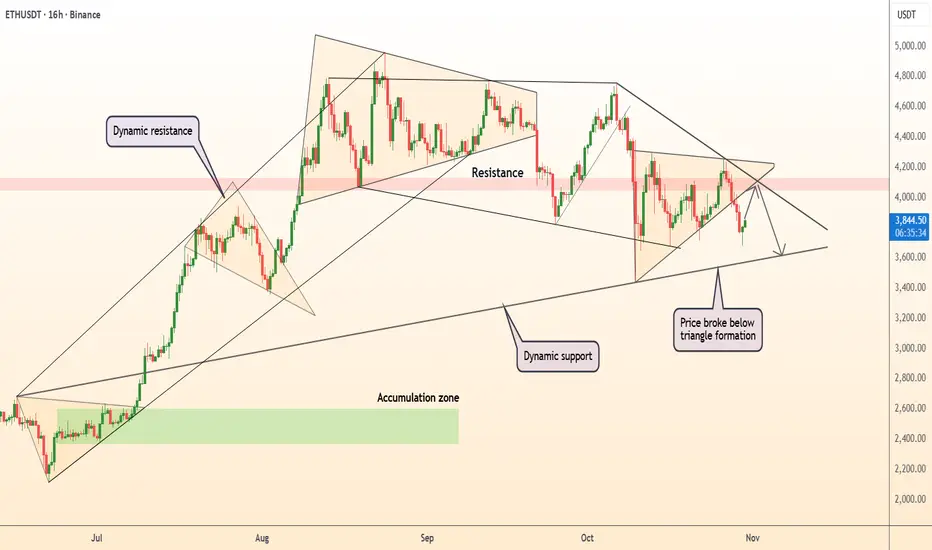
DeGRAM | ETHUSD will rebound from the support area📊 TECHNICAL ANALYSIS
● The chart shows Ethereum forming a broad symmetrical triangle (from June to Nov), with price currently near the lower trend-line support (approx $3 000) and facing a descending dynamic resistance line. A bounce at the support zone suggests buyers are stepping in.
● Price action indicates a test of the key accumulation zone around $3 000–$3 100 (green area). A successful rebound toward the descending resistance (~$3 600-3 800) and subsequent break could signal the start of the next upward leg (wave count suggesting completion of corrective triangle).
💡 FUNDAMENTAL ANALYSIS
● Despite recent weak sessions, the upcoming Fusaka upgrade (early Dec 2025) brings network improvements for Ethereum (lower fees, better scalability), which supports long-term bullish structure.
● Major institutional accumulation is shown by growing net supply increase (+18 262 ETH over one week) and large investors building positions, signalling underlying conviction even amid market pullback.
✨ SUMMARY
● Long bias: expect rebound from ~$3 000–$3 100 support zone.
● Key trigger: hold support + break above ~$3 600 resistance for continuation.
● Targets: initial move toward ~$3 600-$3 800, with broader potential beyond thereafter given upgrade tailwinds.
● Risk: if support fails (~$3 000), downside opens.
-------------------
Share your opinion in the comments and support the idea with a like. Thanks for your support!

ETH Trend: 3000→2820→3400ETH has staged a minor rebound but is set for another sharp pullback.
Focus on the support at 3000 – a break below this level will lead to a further decline to around 2820, where strong support is anticipated.
It will then rebound and break above 3400 to resume the uptrend.
Accurate signals updated daily. They serve as a reliable guide for trading issues – feel free to refer to them. Hope they help!

ETH Support Bounce With Target at 3250Ethereum is trading above a key support level after a strong downward move. Price is showing early signs of a potential bullish correction, with projections pointing toward a possible recovery target around $3250. A break above minor resistance could confirm upward momentum.

DeGRAM | ETHUSD has consolidated below the mirror📊 Technical Analysis
● ETH/USD is testing the broken dynamic support line, which now acts as resistance near $3,600. This retest aligns with the descending channel structure, confirming the dominance of sellers.
● A rejection from this level could lead to a continuation toward the $3,200–$3,100 support zone, coinciding with the previous accumulation area visible from July.
💡 Fundamental Analysis
● Ethereum faces mild pressure as risk appetite fades amid uncertainty over upcoming U.S. economic data and delayed ETF approvals, dampening short-term demand.
✨ Summary
● Resistance: $3,600. Support: $3,200. ETH remains bearish while below resistance, with potential continuation toward the next support zone.
-------------------
Share your opinion in the comments and support the idea with a like. Thanks for your support!

ETHUSDT – Reclaiming Liquidity Zone, Eyeing Supply TestETH successfully closed above the $3,350 liquidity area on both the 3D and weekly timeframe, confirming a clean liquidity sweep and reclaim. This type of move often signals the start of a bullish rebound, which we’ve already seen with ETH recovering strongly over the weekend.
Currently, price is likely heading toward the supply zone between $3,930 – $3,795, where we should monitor the reaction closely. A rejection from this zone could trigger a short-term pullback, potentially revisiting the $3,350 support area once again. However, if ETH manages to break and close above this supply, the next major challenge will be the key resistance near $4,089, a crucial level before retesting the All-Time High (ATH) region.
On the flip side, the bearish scenario would be a weekly close below $3,350, opening the door for a deeper retracement toward the Monthly Order Block (OB) zone around $2,878 – $2,125. This could unfold if Bitcoin also drops below the $100K level, reinforcing broader market weakness.

DeGRAM | ETHUSD held the $3000 level📊 Technical Analysis
● ETH/USD broke out of a consolidation range and is now testing the dynamic resistance line, indicating a potential retest of the $3,500 resistance level. The market recently rebounded from $3,000 support, showing signs of upward momentum.
● The price action respects a rising channel, which could suggest further bullish continuation if the dynamic support holds.
💡 Fundamental Analysis
● The broader crypto market sentiment remains positive, with growing institutional adoption and decreasing selling pressure.
✨ Summary
● Watch for resistance around $3,500 and support at $3,000. A breakout above $3,500 could target $3,800.
-------------------
Share your opinion in the comments and support the idea with a like. Thanks for your support!

DeGRAM | ETHUSD formed a triangle📊 Technical Analysis
● ETH/USD broke below a triangle formation, confirming a bearish continuation from the dynamic resistance area near $4,200.
● Price action suggests a potential move toward the $3,600–$3,500 zone, aligning with the next dynamic support and continuation of the corrective structure from September highs.
💡 Fundamental Analysis
● Ethereum faces downside pressure as on-chain activity slows and ETF speculation cools amid risk-off sentiment in broader markets.
✨ Summary
● Short bias below $4,200; targets $3,600–$3,500. Breakout and weakening fundamentals support medium-term bearish momentum.
-------------------
Share your opinion in the comments and support the idea with a like. Thanks for your support!
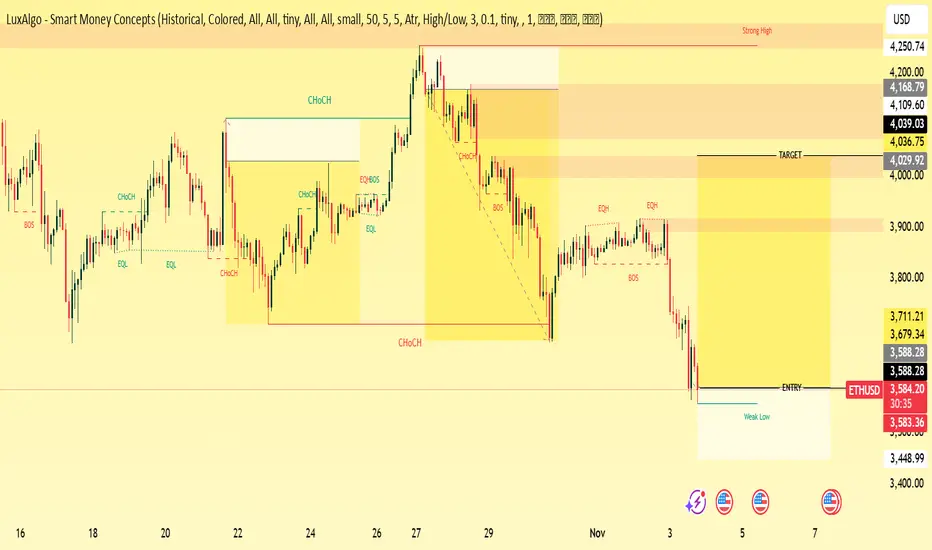
ETH/USD TECHNICAL ANALYSIS BULLISH SETUP1. Market Structure Overview
The chart has shown multiple Change of Character (CHoCH) and Break of Structure (BOS) points, confirming shifts between bullish and bearish phases.
After forming a strong high near 4,250, ETH has been in a bearish market structure, with lower highs and lower lows.
2. Liquidity & Key Levels
Equal Highs (EQH) and Equal Lows (EQL) mark liquidity pools.
The most recent EQH near 3,900 was swept, indicating liquidity grab before price continuation down.
Weak low identified around 3,579–3,550, suggesting potential liquidity inducement for a bullish reversal soon.
3. Current Zone & Entry Area
Price has tapped into the entry zone (3,579–3,588) after a sharp decline, aligning with a discounted price zone within the previous bearish leg.
This area could serve as an accumulation point before a reversal if demand is confirmed.
4. Possible Scenarios
Bullish Scenario:
Price holds above the weak low and forms a BOS to the upside.
Upside target zones:
3,711.21 (first internal structure)
3,900 (EQH region / liquidity zone)
4,029–4,039 (major target & imbalance fill zone)
ETH/USD Short Setup: Bearish Reversal Toward $3,830 TargetA short (sell) trade setup for Ethereum (ETH/USD).
The entry zone is around $3,870–$3,880.
The stop loss is set at $3,909.71, protecting against upside breakouts.
The target is $3,830.85, suggesting a downside move of about $40.
The price action and drawn arrow indicate expectations of a bearish move after a small consolidation
