Ethereum outflows point to bullish setup above $4KEthereum outflows point to bullish setup above $4K
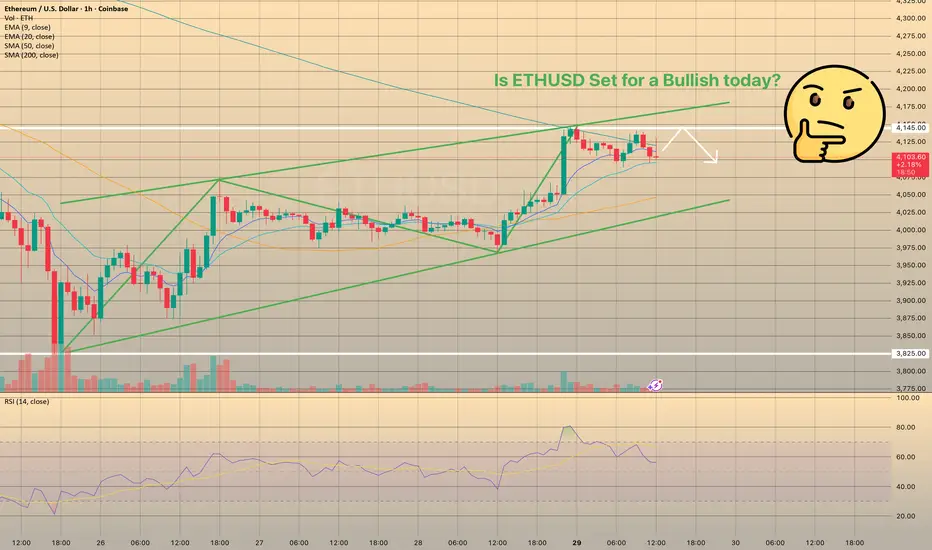
Altcoins are surging, and Ethereum has reclaimed the spotlight after crossing the key $4,000 mark. Trading volume is rising, and ETH is holding steady near $4,100 after a relatively calm weekend, suggesting stability following last week’s volatility. Analysts view $4,000 as a crucial support level—if bulls defend it, ETH could soon retest higher levels.
One factor supporting this outlook is a steady decline in Ethereum balances on spot exchanges. A CryptoQuant report shows coins are being withdrawn into self-custody and staking, reducing sell-side liquidity. Historically, such outflows have set the stage for rallies as demand absorbs limited supply.
Short positioning also adds fuel: more than $11 billion in shorts could be forced to cover if ETH breaks above $4,200, potentially accelerating gains.
Still, analysts warn that supply constraints alone aren’t enough—strong buyer inflows are needed to sustain momentum. The next few days will be key, with ETH’s ability to hold above $4,000 serving as a test for the next leg of the rally.
Ethusdanalysis
ETH: Short-Term Retracement, Long-Term BullishAfter a strong upward rally, ETH’s price is currently in a phase of retracement and consolidation. Short-term upward momentum has weakened somewhat, leaving it under pressure to pull back. However, the MA20 and MA60 continue to maintain a solid upward trend, providing medium-term support for the price. That said, the MACD histogram has shown short-term contraction, indicating a slowdown in the upward momentum.
Overall, ETH’s price action today is characterized by short-term retracement but sustained upward potential in the medium to long term.
Nevertheless, the cryptocurrency market is highly volatile, so investors should closely monitor market developments and relevant news to adjust their investment strategies in a timely manner

Ethereum (ETH/USD) Bullish Reversal Setup from Key Support Zone Chart Analysis
Trend
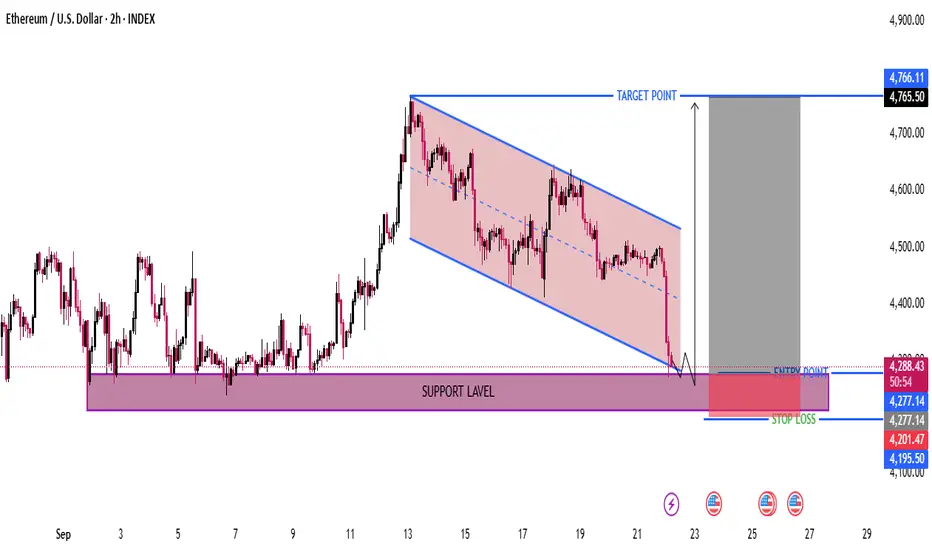
The price has been moving inside a descending channel (marked in red).
Recently, it has reached the lower boundary of the channel, showing potential for a reversal.
Support Level
A strong support zone is highlighted around $4,200 – $4,277 (purple box).
Price has tested this zone multiple times, confirming it as a key demand area.
Entry Zone
The suggested entry point is just above support, around $4,277 – $4,300.
Idea: Wait for bullish confirmation (bounce / reversal candle) before entering.
Stop Loss
Marked below the support zone, around $4,195 – $4,200.
This protects against breakdowns if ETH falls below support.
Target Point
The projected target is $4,765 (top of the channel breakout).
This aligns with the recent swing high before the downtrend began.
📊 Risk-to-Reward (Approximate)
Entry: ~ $4,277
Stop Loss: ~ $4,200 → Risk ~ $77
Target: ~ $4,765 → Reward ~ $488
RR Ratio: ~ 1 : 6.3 (very favorable)
⚠️ Key Notes
Confirmation needed: A strong bullish candle or breakout from the descending channel.
If price breaks below $4,200 support, bearish continuation likely.
Market conditions (BTC movement, macro news) can affect ETH’s reaction.
✅ Overall Setup: This is a bullish reversal setup at major support with high RR. Best strategy → wait for confirmation of bounce before entering long.
ETHER HIGH PROBABILITY SETUP SOON!!!🚨 ETHUSD HIGH PROBABILITY BUY SETUP 🚨
* Here We Can See Clearly The Next Potential Move For Ethereum Coming Hours/Days.
* Keep Your Eyes Close On Your Trading Positions.
* Happy PIP Hunting Traders.
FXKILLA.

ETH/USD Bullish Reversal Setup – Breakout from Descending ChanneTrend/Pattern
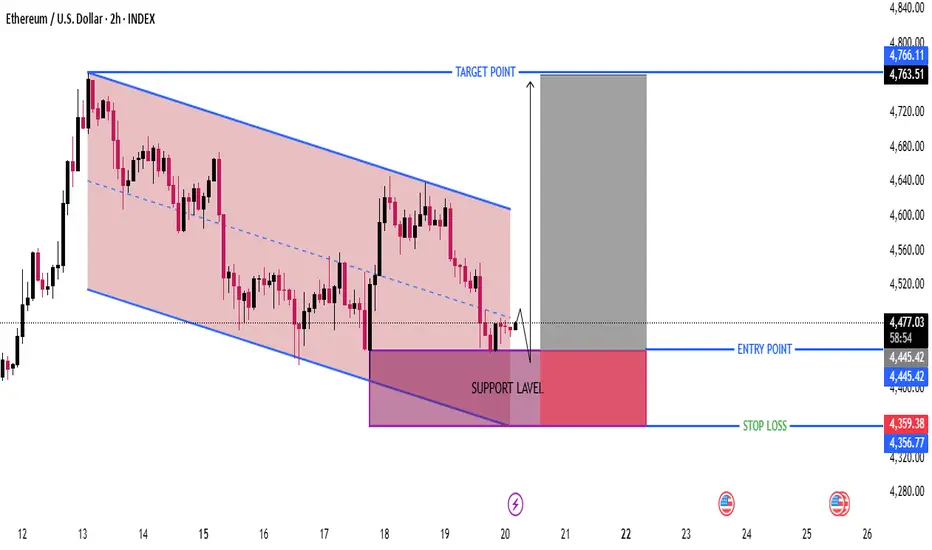
The price has been trading within a descending channel, shown by the red zone and two parallel blue trend lines.
Currently, price action is near the lower boundary of the channel, indicating potential trend exhaustion and a reversal zone.
🟣 Support Level
Marked clearly in the purple shaded region (~$4,356 to $4,445).
Price has tested this support multiple times, showing strong buying interest.
This zone acts as a demand area, and the chart suggests it might hold for a bounce back.
📈 Entry Point
$4,445.42 is the suggested long entry.
This is slightly above the current price ($4,477.92), meaning the setup might already be in play or close to triggering.
The logic: Wait for confirmation above the support before entering.
🛑 Stop Loss
$4,359.38 is the suggested stop loss (below the support).
This gives a tight risk margin, minimizing losses if the setup fails.
It's placed just under the recent lows to avoid stop hunts.
🎯 Target Point
$4,766.11 is the profit target, based on the previous resistance and top of the descending channel.
Represents a return to the upper boundary of the larger trend.
This implies a Risk:Reward Ratio (RRR) of approximately 3:1, which is favorable.
⚖️ Risk-Reward Evaluation
Entry: $4,445.42
Stop Loss: $4,359.38 → Risk = $86.04
Target: $4,766.11 → Reward = $320.69
Risk/Reward Ratio: ~3.7:1 — Excellent RRR
📊 Summary: Trading Idea
Element Value
Trade Type Long (Buy)
Entry Point $4,445.42
Stop Loss $4,359.38
Target Point $4,766.11
Risk/Reward ~3.7:1
Confirmation Needed? Yes – Watch for break and close above $4,445
✅ Pros of the Setup
Strong demand zone bounce
Clean descending channel structure
Tight stop loss, good RRR
Potential breakout from the channel
⚠️ Risks
If price breaks below support, pattern fails.
Short-term volatility could fake out breakout.
Wait for volume confirmation and/or a bullish candlestick pattern for safer entry.
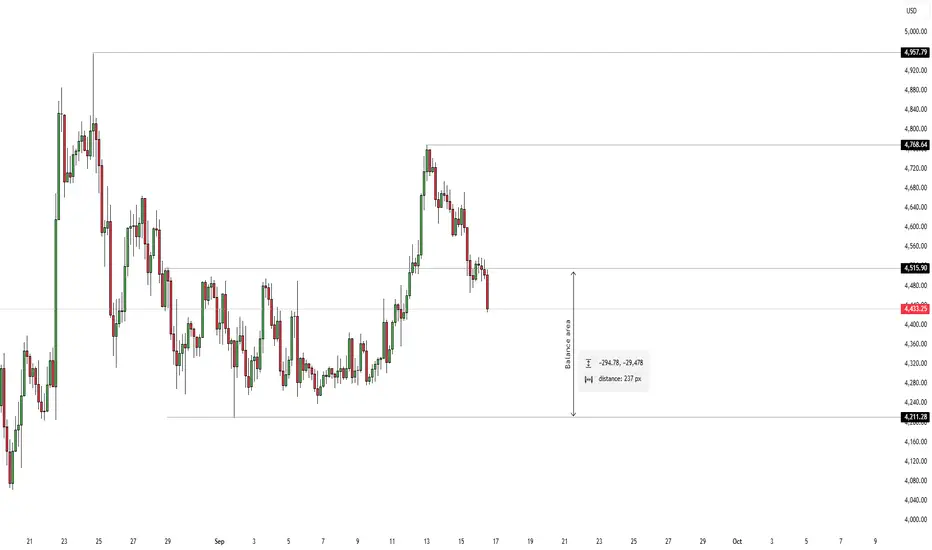
ETHUSD 4H HOURLY PROJECTION AND IDEA.The second in command in the crypto market is Eth, just broke a structure back into a previous Balance Area, which may mean price could be static for sometime and the Pair takes its lead and direction from its Head BTC, which is also on a downward move, but the overall direction of the market is Bullish, and currently price is within a previous range i expect price to stay within this range (Balance) lets see what price would do next.
Market opens Llower as Ethereum holds steady; Analysts eye $5,00Market opens Llower as Ethereum holds steady; Analysts eye $5,000
The market opened lower on Tuesday, with Ethereum trading around $4,500. While bears are applying pressure ahead of a potential rate cut, ETH remains relatively stable compared to more volatile altcoins.
Recent analysis indicates a significant cooling in Ethereum trading activity. The market has entered a neutral but nervous phase, characterized by a decline in perpetual futures trading—suggesting reduced leveraged speculation and a shift toward more organic spot trading. However, spot market volumes have also failed to impress, consistently staying low and reflecting limited investor participation.
This combination points to a indecisive market. Ethereum has managed to maintain a moderate upward trend but lacks strong bullish momentum, leaving it in a semi-bullish range.
Analysts suggest that a clear break above the key psychological level of $5,000 is crucial to avoid sideways movement and could trigger a rally toward $6,000 by year-end.
In institutional news, Standard Chartered’s venture arm, SC Ventures, is planning to launch a $250 million crypto-focused investment fund in 2026. The fund will target digital assets in financial services and signals growing institutional interest. The bank is also launching a separate $100 million Africa investment fund.

Ethereum eyes $5,000 – but will bulls deliver?Ethereum eyes $5,000 – but will bulls deliver?
Ethereum trades near $4,356, holding above the 50-day EMA at $4,164, signaling strong support. Consolidation above $4,000 keeps the path open toward $4,600–$4,800, with a breakout potentially targeting $5,000.
On-chain activity and RSI at 52 suggest stability, while Bitcoin lags behind. Key supports: $4,164, $3,865, $3,213.
However, falling institutional inflows and weaker volumes pose risks. ETH saw $912M in outflows last week, erasing recent gains in investment products.
Bottom line: Technicals favor upside, but sustained buying is critical for a move to $5K.

ETHEREUM HIGH PROBABILITY SETUP SOON!!!🚨 ETHUSD HIGH PROBABILITY BUY SETUP 🚨
* Here We Can See Clearly The Next Potential Moves For ETH Coming Hours/Days.
* Keep Your Eyes Close On Your Trading Positions.
* Happy PIP Hunting Traders.
FXKILLA.

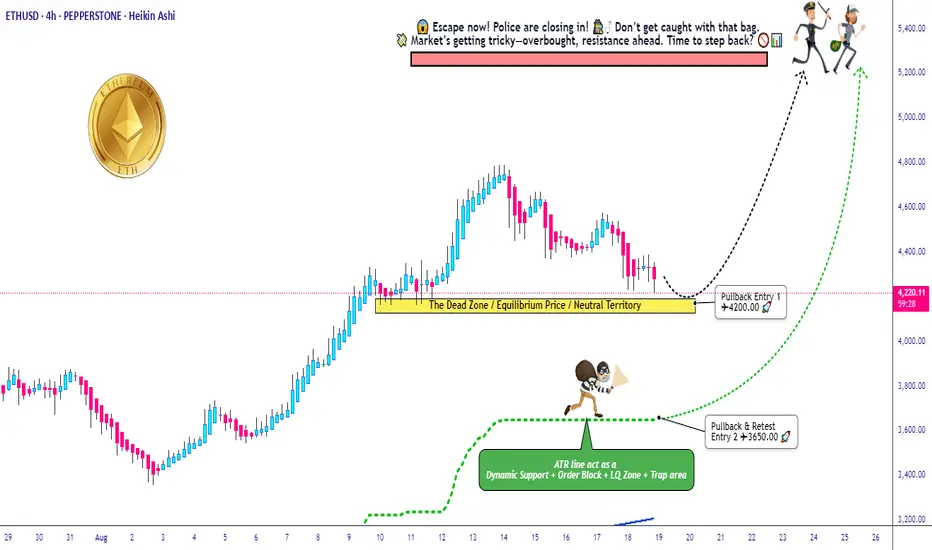
Big Crypto Heist: ETH/USD Swing Plan Targeting 5200 Exit!🚨💎ETH/USD “Ethereum vs U.S Dollar” Crypto Heist Plan (Swing Trade)💎🚨
Dear Ladies & Gentlemen… my Thief OG’s 🕶️💰, the vault is open and the police are distracted — time for the Ethereum Heist Plan!
Entry Plan (Pullback Loot Zones)
Pullback Entry 1: 💵 4200.00
Pullback Entry 2: 💵 3650.00
Load your bags in layers (Thief layering strategy – multiple buy limit orders). Patience is the key, we strike when guards are weakest.
🛑 Stop Loss (Escape Route)
Entry 1 SL: 3850.00
Entry 2 SL: 3300.00
👉 Adjust your SL according to your risk appetite & strategy — every thief has their own escape route.
🎯 Target (Cash-Out Point)
Police barricade ahead! 🚔💨 Secure your loot & exit before capture:
Take Profit @ 5200.00 🤑💸
📜 Thief Note:
This ETH/USD setup is a bullish robbery mission 🕵️♂️. Market guards (bears) are getting weaker, giving us the opening. Our layered pullback entries ensure we don’t rush the vault — we strike smart, not desperate.
⚡ Always remember: news releases = alarm triggers 🚨. Stay sharp, use trailing stops, and never get too greedy.
💖 If this plan helps your heist bag grow — Hit the Boost Button 💥 and power up our robbery crew. Together, we raid the markets daily with the Thief Trading Style. 🏆💪💰
🚀 Stay ready, stay sneaky… The next target is always around the corner.
DeGRAM | ETHUSD is consolidating📊 Technical Analysis
● ETH/USD is consolidating near $4,450 inside a rising channel, with support anchored at $4,187; holding this zone keeps bullish structure intact.
● The price is coiling below resistance at $5,131, and sustained momentum could trigger an upside breakout targeting $5,500 in the medium term.
💡 Fundamental Analysis
● Recent ETH ETF inflows surpassed $1.2B in August, while Ethereum’s staking ratio hit record highs above 27%, reducing liquid supply and reinforcing long-term bullish pressure.
✨ Summary
Bullish above $4,187; targets $5,131 → $5,500. Invalidation below $4,100.
-------------------
Share your opinion in the comments and support the idea with like. Thanks for your support!

ETH/USD Bullish Breakout & FVG Buying Zone StrategyETH/USD Chart Analysis (30m TF)
🔹 Trend & Structure
Price was moving inside a descending channel (support & rejection lines).
Recently broke above the channel, showing bullish momentum.
🔹 Key Levels & Zones
FVG Buying Zone: $4,283 – $4,353 (potential entry zone).
EMA70 ($4,393) acting as immediate support/resistance.
EMA200 ($4,468) is the next strong resistance.
Target Point: $4,667 (upside target after breakout).
🔹 Strategy
📈 Look for buy entries inside the FVG zone ($4,283 – $4,353).
🎯 Target: $4,667
🛑 Stop-loss: Below $4,283 to protect capital.
⚡ Setup suggests a bullish continuation if the buying zone holds.

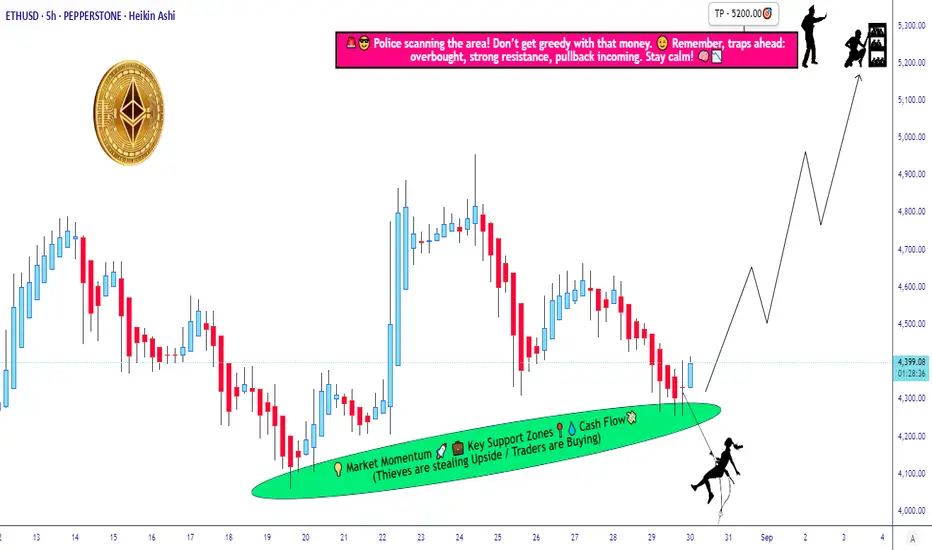
Stealing Profits from ETH! Bullish Layer Strategy Activated🔓💰 ETH/USD "Ethereum vs. Dollar" Money Heist Plan 💰🔓
🎯 Plan: Bullish Robbery | Swing/Day Trade
💎 Layered Entries | Precision Loot | Multi-Bag Grab
🚀 Target: 5200.00 | 🛑 Stop Loss: 4060.00
🚨👀 Attention Traders, Crypto Bandits & Market Looters! 👀🚨
The Ethereum vault is wide open – and Thief Trader is here with the LAYERED ENTRY STRATEGY. Stack those buy limits like gold bars in a secret vault. 🏦💎
💥 ENTRY: Any Price is a Good Price 💥
Thief style means we don’t chase – we LAYER.
⚔️ Multiple limit entries:
4400.00
4300.00
4200.00
(Add more layers if you’re savage enough.)
Every dip is a robbery opportunity – we’re not here to beg, we’re here to loot.
🔐 STOP LOSS: 4060.00 🔐
This is Thief’s SL Zone – where the cops show up.
OG Thieves know: adjust your SL to your own heist plan & risk appetite.
💸 TARGET: 5200.00 💸
That’s the police barricade – take the cash and escape before the sirens.
Secure the bag, don’t get greedy.
🧠 Thief Trader Secrets:
📊 Layered entries = survival + sniper precision.
⚡ Swing traders ride it, day traders loot it, investors just chill & count.
🔔 Trail your SL – don’t let profits get hijacked.
⚠️ HEIST PROTOCOL:
✅ No panic entries.
✅ Risk small, layer smart.
✅ Remember: patience = payday.
❤️🔥 Smash that 💥 BOOST BUTTON 💥 if you’re rolling with the Thief Squad.
Follow for the next Market Heist Plan – we rob, we layer, we escape with bags full. 💼💰
“Markets pay the disciplined thieves, not the desperate gamblers.” – Thief Trader
🤑📈🐂 #ETHUSD #CryptoHeist #ThiefTrader #EthereumHeist #LayeredEntries #CryptoTrading #RobTheMarket #MoneyHeistETH
Ethereum - Here comes the final breakout!🚀Ethereum ( CRYPTO:ETHUSD ) breaks the all time high:
🔎Analysis summary:
Finally, after a consolidation of about four years, Ethereum is back at the previous all time high. With the recent rally of more than +200%, bulls are flexing their muscles, preparing the breakout. So far, everything is playing out according to plan with new all time highs soon.
📝Levels to watch:
$5.000
SwingTraderPhil
SwingTrading.Simplified. | Investing.Simplified. | #LONGTERMVISION

ETHUSD marks the universal Strong Buy signalMarket Picture — Technical Overview
Investing.com notes a universal Strong Buy signal on all key timeframes (1 day, 1 week, 1 month). MA indicators: Buy 12 / Sell 0; indicators: Buy 9 / Sell 0.
RSI ≈ 55.6 (Buy)
STOCH ≈ 71 (Buy)
MACD ≈ 11.7 (Buy)
ADX ≈ 31 (Buy)
TipRanks also gives an overall Buy rating, with an overweight MA (8 Buy, 4 Bearish) and indicators (3 Buy, 1 Bearish).
Binance points out that the price is trading above all key EMAs — EMA7 ($4,542) acts as support, EMA25 ($4,309) confirms the medium-term trend.
Short-Term Forecast
According to LiteFinance (Elliott analytics), the final wave of the impulse is forming on the H4 chart, with a forecasted end around $5,523.99. Strategy: entry around $4,581, with a target above $5,500.
Current market dynamics and forecasts
The market is testing the key support of $4,600 amid institutional accumulation and an inflow into ETF products. If it consolidates above, a subsequent impulse to $5,000 is possible.
There are optimistic forecasts:
Tom Lee (Fundstrat) expects ETH to grow to $5,500 in the near future and to $12,000 by the end of the year.
Market valuations point to a new ATH of around $5,000, with Myriad forecasts showing up to 80% probability.
ETH recently hit a new all-time high of $4,945, with a market cap of nearly $600 billion.
Despite recent consolidation, analysts remain optimistic and see potential for $7,000 by year-end amid favorable macro and regulatory conditions.

ETH slides post-ATH, Network fundamentals stay strongETH Slides Post-ATH, Network Fundamentals Stay Strong
Altcoins slid as Bitcoin and Ethereum retreated, with ETH dropping 7% to $4,313 despite recent highs and strong inflows. Market cap fell by $200B.
BitMine Immersion Technologies seized the dip, buying 4,871 ETH for $21.3M, boosting its holdings to 1.72M ETH (~$7.5B), about 40% of all corporate ETH reserves. Its crypto assets rose by $2.2B in a week, with NAV per share hitting $39.84, reinforcing its lead in ETH treasuries.
Ethereum surged 200% since April lows, but network activity tells the bigger story. On-chain metrics show strong fundamentals: 75% of revenue from priority fees and MEV, $156B in stablecoins (+14% since July), and ~$6B daily L1 settlements. L2 adoption is also accelerating, led by Coinbase’s Base.
Despite structural growth, volatility persists: ETH plunged $550 after a new ATH, liquidating $110M in leveraged positions. Currently at $4,445 (-5.5% daily, +5.3% weekly), ETH still outperforms the broader market.
The Ethereum Foundation is pushing its Trillion Dollar Security initiative to enhance wallet and contract safety, aiming for long-term sustainability.
DeGRAM | ETHUSD seeks to the $5200📊 Technical Analysis
● ETHUSD is climbing inside a rising channel, holding above $4,500 after confirming the breakout zone as fresh support.
● Price structure shows higher lows and renewed momentum, projecting an advance toward the $5,200 resistance, with breakout geometry favoring continuation.
💡 Fundamental Analysis
● Institutional flows remain strong: August inflows into ETH ETFs exceeded $1.1 B, while CME futures volumes expanded to multi-month highs, signaling persistent institutional confidence.
✨ Summary
Buy above $4,500; targets $5,200 in medium term. Invalidation below $4,400.
-------------------
Share your opinion in the comments and support the idea with like. Thanks for your support!

DeGRAM | ETHUSD above the resistance line📊 Technical Analysis
● ETHUSD broke above the long-term resistance at ~$4,027, confirming a bullish continuation from the rising purple trend channel.
● Price retested that breakout as support and is setting up for a measured move toward the key $4,926 supply zone, with on‑chart channel geometry and breakout structure supporting further upside.
💡 Fundamental Analysis
● Spot Ethereum ETFs surged with record trading volume of $2.725 B on August 11, signaling strong institutional and retail demand.
● Derivatives market is deepening—Ethereum futures open interest exceeded $30 B, while CME futures hit a record $7.85 B—as institutional flows fuel momentum.
● Corporate treasury adoption jumped sharply: small public companies now hold 966,000 ETH ($3.5 B), underscoring real‑asset confidence.
✨ Summary
Buy above $4,027; target $4,926. Setup remains valid while holding above $4,000.
-------------------
Share your opinion in the comments and support the idea with like. Thanks for your support!

Ethereum Remains Technically Solid Bullish Background ConfirmedOverall Market Sentiment
Looking at TipRanks data, ETH is receiving Strong Buy signals on the daily, weekly and monthly timeframes, with a strong dominance of "Buy" on the moving averages (12 Buy) and moderately positive dynamics on the oscillators
Price indicators (EMA20, EMA50, EMA100, EMA200) are significantly below the current price, which confirms a stable uptrend.
Key support and resistance levels
Support:
around $4,030-4,100, where an important foundation has been built in case of a reverse movement.
Resistance:
The previous zone of $4,300-4,350, where the price has repeatedly encountered difficulties.
A confident breakout is a possible path to $4,576 (the maximum of the 24-hour range) and further up.
Technical indicators and signals
Daily and weekly timeframes — "Strong Buy".
RSI ~55–56 (Buy), MACD — Buy. Other oscillators give a neutral signal.
Trade Plan from Binance (ETH/USDT):
Current price is around $4,336, below EMA7 ($4,398), but above EMA25 ($4,044) — confirms the medium-term bullish trend.
Possible rebound from support $4,278–4,300, targets — $4,398, $4,576 and then $4,781 upon breakout. Risk — fall to $4,043 upon breakout of EMA25.

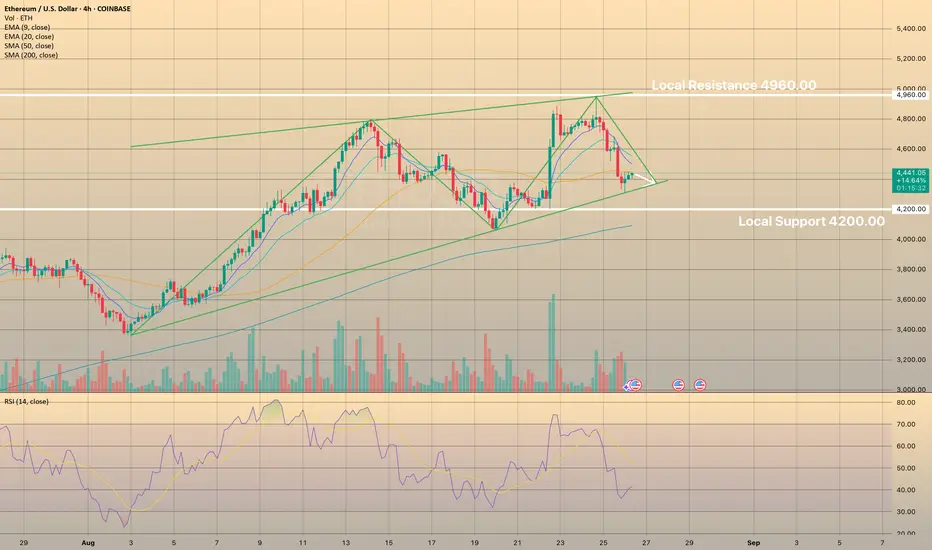
ETHUSD develops new bullish impulseETHUSD develops new bullish impulse
Ethereum is surpassing Bitcoin due to the anticipated approval by the SEC for spot ETFs, the increased adoption by companies, and the positive stance of the SEC regarding liquid staking tokens, which has sparked institutional interest.
Recently the asset managed to hold above the 4,200.00 level. Right now, ethereum is developing a new bullish momentum heading towards 4,600.00 local resistance. MACD has crossed and is in the green zone currently on 4-hour timeframe.
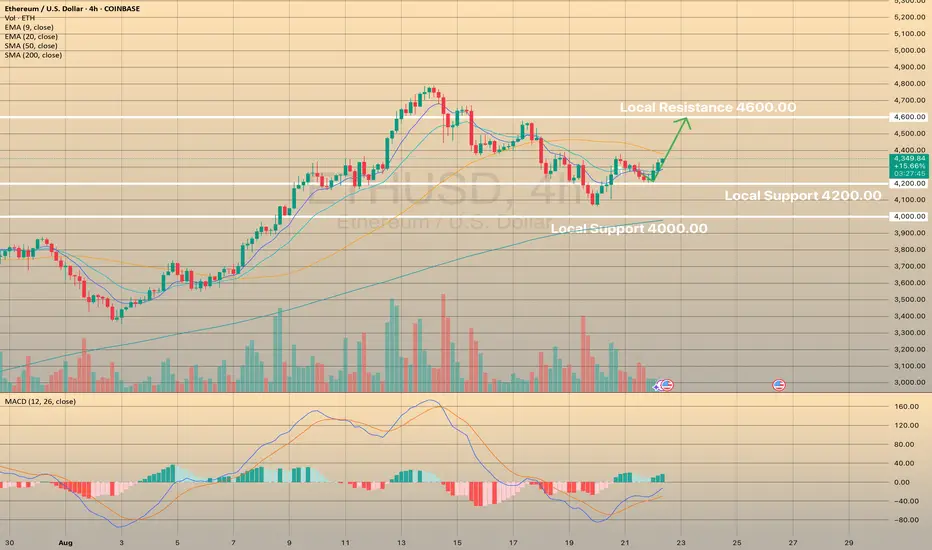
ETHUSD tries to develop another bullish impulseETHUSD tries to develop another bullish impulse
Fed Governor on DeFi: At the Wyoming Blockchain Symposium on August 20, Fed Governor Christopher Waller called DeFi and crypto payments "nothing to be afraid of," pushing for payment infrastructure collaboration. His pro-crypto stance, as a potential Fed chair, gains traction. Lummis on Crypto Bill: Senator Cynthia Lummis said the CLARITY Act, House-approved in July, could reach Trump by year-end with Senate tweaks, aiming for 2026 rollout. China’s Yuan-Backed Stablecoins: China may allow yuan-backed stablecoins to boost global use, reversing its 2021 ban. A late August roadmap review targets cross-border trade, with Hong Kong and Shanghai as hubs, to be discussed at the SCO Summit.
Technically, ETHUSD trades above the EMA20, trying to hold above this moving average. The MACD is in the green zone. The price may pullback towards 4,200.00 with a further bullish impulse towards 4,600.00 level.

ETHUSD dropped below the support level of 4,200.00ETHUSD dropped below the support level of 4,200.00
On August 19 the asset dropped below 4,200.00 support level on an extremely high volume losing 5.55% as traders braced for Federal Reserve Chair Jerome Powell’s address at Jackson Hole. The drop follows a period of heavy profit-taking that gathered momentum after Ethereum’s sharp rally earlier this month. Liquidations also intensified during the downturn in the last 24 hours. Data from showed that more than 128,000 traders were wiped out in the past 24 hours, with total losses amounting to $450.7m.
The asset has been growing during Asian and early European trading hours today. If the asset fails to break through the 4,200.00 and hold above, the price may decline to the major support level of 4,000.00. Otherwise, the upside range is limited by the upper border of the descending channel.
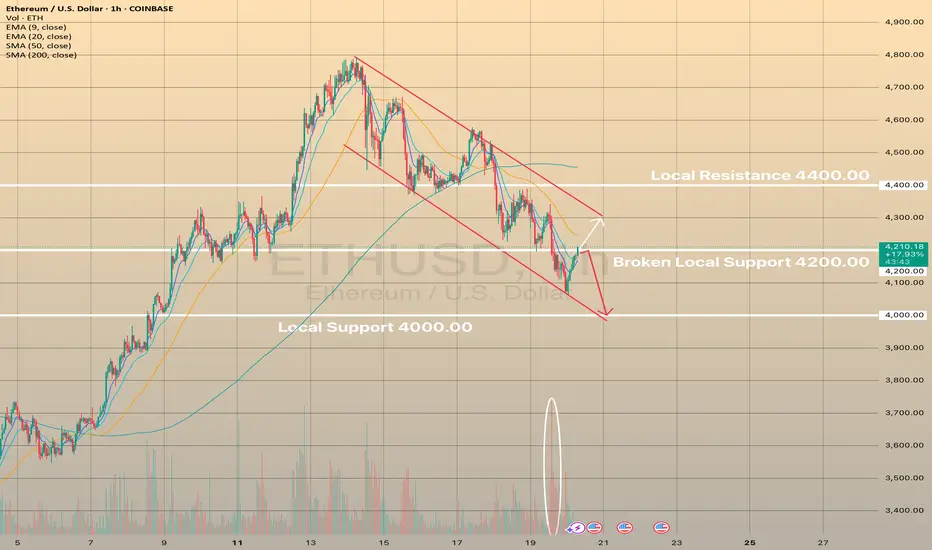
ETHUSD formed a bullish wedge, ready to reverseETHUSD formed a bullish wedge, ready to reverse
ETHUSD has been declining since August 14. During the last 2 days the asset started to trade within a narrow declining range, eventually forming a bullish wedge. Price came to an intermediate support level of 4,200.00, showing bullish divergence on the RSI on 30-m chart. Price is expected to rise towards local resistance of 4,400.00 and the upper border of the descending channel (highlighted with red).
