ETH Trend: 3000→2820→3400ETH has staged a minor rebound but is set for another sharp pullback.
Focus on the support at 3000 – a break below this level will lead to a further decline to around 2820, where strong support is anticipated.
It will then rebound and break above 3400 to resume the uptrend.
Accurate signals updated daily. They serve as a reliable guide for trading issues – feel free to refer to them. Hope they help!
Ethusdbuy

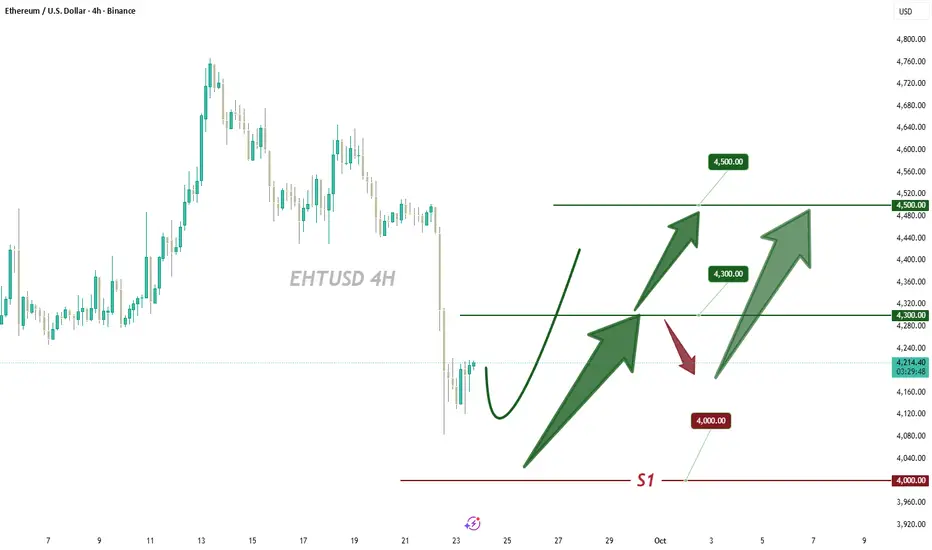
ETHEREUM HIGH PROBABILITY SETUP SOON!!!🚨 ETHER HIGH PROBABILITY SELL/BUY SETUP 🚨
* Here We Can See Clearly The Next Potential Moves For ETHUSD Coming Hours/Days.
* Keep Your Eyes Close On Your Trading Positions.
* Happy PIP Hunting Traders.
FXKILLA.

Ethereum (ETH/USD) Technical Analysis and Trade SetupOverview
Timeframe: 1 Hour (1H)
Current Price: ≈ $4,675
Structure: Upward ascending channel
Trend Bias: Bullish (short-term), but potential retracement expected.
🧭 Key Levels
Resistance Level: Around $4,700–$4,720 (upper boundary of the channel)
Demand Zone (Support): $4,440 – $4,510
Target Point: $4,776 – $4,780
📊 Technical Interpretation
Price Movement:
ETH has been moving steadily in an upward channel. It recently hit the upper resistance of the channel and faced minor rejection — indicating a potential short-term pullback.
Expected Correction:
A retracement toward the demand zone (around $4,440–$4,510) is likely.
This area coincides with previous consolidation and aligns with the lower trendline support.
Possible Reversal Zone:
Once price retests the demand zone, bullish pressure may return, targeting the upper resistance and the target level near $4,776.
Trend Continuation Scenario:
If ETH holds above $4,440, the bullish structure remains valid and price could retest $4,776 and potentially break higher.
Invalidation:
A 4H candle close below $4,438 would break the structure and suggest deeper downside toward $4,350.
🎯 Trading Plan (Conceptual)
Buy Zone: $4,440 – $4,510
Take Profit: $4,770 – $4,800
Stop Loss: Below $4,430
Risk–Reward Ratio: ≈ 1:3 (favorable setup)
📈 Summary
Short-term: Possible correction to demand zone
Mid-term: Bullish continuation toward $4,776
Bias: Bullish above $4,440 / Bearish below $4,430

Hold 4000 Support, ETH Awaits ReboundETH has stabilized its downward trend . If the 4000 support level remains unbroken , we can continue to wait for a rebound 📈
Buy 4100 - 4150
TP 4250 - 4350 - 4450
Accurate signals are updated every day 📈 If you encounter any problems during trading, these signals can serve as your reliable guide 🧭 Feel free to refer to them! I sincerely hope they'll be of great help to you 🌟 👇
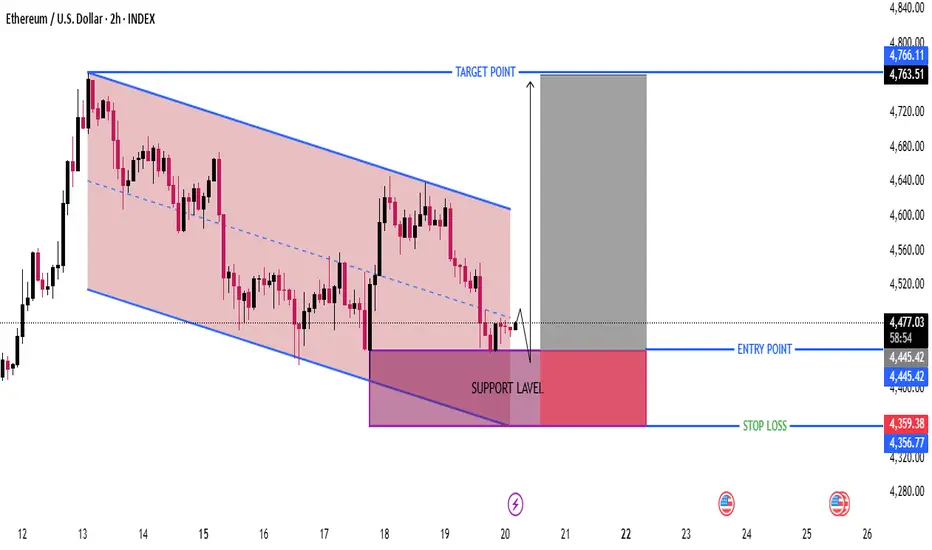
ETH/USD Bullish Reversal Setup – Breakout from Descending ChanneTrend/Pattern
The price has been trading within a descending channel, shown by the red zone and two parallel blue trend lines.
Currently, price action is near the lower boundary of the channel, indicating potential trend exhaustion and a reversal zone.
🟣 Support Level
Marked clearly in the purple shaded region (~$4,356 to $4,445).
Price has tested this support multiple times, showing strong buying interest.
This zone acts as a demand area, and the chart suggests it might hold for a bounce back.
📈 Entry Point
$4,445.42 is the suggested long entry.
This is slightly above the current price ($4,477.92), meaning the setup might already be in play or close to triggering.
The logic: Wait for confirmation above the support before entering.
🛑 Stop Loss
$4,359.38 is the suggested stop loss (below the support).
This gives a tight risk margin, minimizing losses if the setup fails.
It's placed just under the recent lows to avoid stop hunts.
🎯 Target Point
$4,766.11 is the profit target, based on the previous resistance and top of the descending channel.
Represents a return to the upper boundary of the larger trend.
This implies a Risk:Reward Ratio (RRR) of approximately 3:1, which is favorable.
⚖️ Risk-Reward Evaluation
Entry: $4,445.42
Stop Loss: $4,359.38 → Risk = $86.04
Target: $4,766.11 → Reward = $320.69
Risk/Reward Ratio: ~3.7:1 — Excellent RRR
📊 Summary: Trading Idea
Element Value
Trade Type Long (Buy)
Entry Point $4,445.42
Stop Loss $4,359.38
Target Point $4,766.11
Risk/Reward ~3.7:1
Confirmation Needed? Yes – Watch for break and close above $4,445
✅ Pros of the Setup
Strong demand zone bounce
Clean descending channel structure
Tight stop loss, good RRR
Potential breakout from the channel
⚠️ Risks
If price breaks below support, pattern fails.
Short-term volatility could fake out breakout.
Wait for volume confirmation and/or a bullish candlestick pattern for safer entry.
Accumulate for uptrend ! ETH September 01💎 ETH WEEKLY PLAN UPDATE (09/01 )
Medium-term ETH Plan & Trend Outlook
ETH has completed the test of the resistance zone at 4,800 (4k8 resistance DONE) and is currently in a corrective move.
The price is still holding above the 4,200 – 4,215 support zone, which coincides with EMA89, showing that this is an important medium-term demand area.
As long as ETH stays above 4,200, the main trend remains bullish, with the next target aiming toward 6,000 (Fib 2.618 resistance + strong supply zone).
Key Support Zones:
• 4,200 – 4,215 → short-term demand, main support pillar.
• 3,600 – 3,620 → medium-term support (EMA200 + previous breakout).
• 3,200 – 3,216 → deeper support if 4,200 breaks.
• 2,500 – 2,520 → long-term support, major base zone.
Key Resistance Zones:
• 4,800 – 4,825 → short-term resistance, recently tested.
• 6,000 – 6,050 → medium-term bullish target, strong supply zone.
Trend Outlook:
ETH is currently undergoing a healthy correction after a 5-wave rally.
• The positive scenario: price holds above 4,200, then rebounds to retest 4,800, and if it breaks, the uptrend could extend to 6,000.
• The negative scenario: if 4,200 breaks, the market could retrace to deeper support levels at 3,600 or 3,200 before forming the next bullish wave.

ETH/USD Bullish Breakout & FVG Buying Zone StrategyETH/USD Chart Analysis (30m TF)
🔹 Trend & Structure
Price was moving inside a descending channel (support & rejection lines).
Recently broke above the channel, showing bullish momentum.
🔹 Key Levels & Zones
FVG Buying Zone: $4,283 – $4,353 (potential entry zone).
EMA70 ($4,393) acting as immediate support/resistance.
EMA200 ($4,468) is the next strong resistance.
Target Point: $4,667 (upside target after breakout).
🔹 Strategy
📈 Look for buy entries inside the FVG zone ($4,283 – $4,353).
🎯 Target: $4,667
🛑 Stop-loss: Below $4,283 to protect capital.
⚡ Setup suggests a bullish continuation if the buying zone holds.

(ETH/USD) Bullish Setup: Entry at $2,422 with Target at $2,521 a1. Entry Point: ~2,422.2
This is the suggested buy area based on a recent bounce from the support zone
2. Support Zone (Purple Box):
Bottom boundary: ~2,392.4
Top boundary: ~2,408.4
Price has bounced multiple times here, showing strong buying interest.
3. Resistance Point: ~2,463.9
A clear horizontal resistance line, previously tested.
4. EA Target Point: ~2,522.1
A bullish target if the price breaks above the resistance level.
🔶 Highlighted Patterns / Markers
Orange Circles: Indicate key swing highs and lows — possibly used to identify double tops/bottoms or rejection/wick zones.
Blue Arrows: Illustrate the anticipated move from:
Entry (2,408.1) → Resistance (2,463.9) → Target (2,521.2)
Target gain = +111.7 USD (+4.64%)
🔻 Stop Loss Level
Set just below the support box at ~2,392.4
Protects from false breakouts or deeper pullbacks.
📈 Strategy Outlook
Bullish Bias: The setup expects a breakout from the current price range.
Risk-Reward Ratio: Appears favorable — tight stop and wide target.
Confirmation Needed: A solid breakout and hold above 2,423–2,425 may be the early confirmation signal.
📌 Summary
Element Value
Entry Point ~2,422.2
Stop Loss ~2,392.4
Resistance ~2,463.9
Target (TP) ~2,521.2
R:R Ratio Approx. 3:1
Bias Bullish

ETHUSD Market Analysis: Technical Indicators and Bearish SentimeAs of now, ETHUSD has dropped to $1,961, registering a daily decline of $94.9. Earlier, it exhibited robust upward momentum, surging past the $2,000 threshold. However, it has since experienced a pronounced downturn.
In terms of technical analysis, although the MACD doesn't clearly indicate a trend, its histogram has transitioned from positive to negative and is shrinking, suggesting that bullish strength is waning. The KDJ indicator, with a reading of 90, is in overbought territory. The 4 - hour candlestick chart reveals a substantial price drop relative to earlier levels. Even though the last candlestick is bullish, the overall market sentiment remains bearish.
Recently, trading volume has dwindled. The phenomenon of prices rising while volume falls indicates a significant weakening of upward momentum.
The market may be influenced by profit - taking from the previous rally, which has triggered a selling frenzy. Moreover, external factors like macroeconomic conditions and regulatory policies could also be at play. If key support levels, such as $1,874, fail to be reclaimed, bears are likely to retain their dominance. Investors should vigilantly monitor these support levels and prudently adjust their investment strategies.
ETHUSD
sell@1980-2000
tp:1900
buy@1850-1870
1930-1950
I will share trading signals every day. All the signals have been accurate for a whole month in a row. If you also need them, please click on the link below the article to obtain them.

The Forecast of ETHUSD TrendETH is currently hovering around $1,900. There is obvious resistance at $1,920 above, and $1,870 below is a key support level. If it breaks through the resistance, it is expected to reach for $2,000; if it falls below the support, it may drop to $1,850.
ETHUSD
sell@1920-1940
buy@1850-1870
I have been engaged in the trading field for nine years.
Up to now, the profit I have made has exceeded one million US dollars.
If you want to obtain professional guidance on trading trend analysis, trading strategy formulation, and risk management, please click on my profile.

LONG ON ETHEREUMEthereum is starting to rise from a key demand area after providing a nice pullback off a change of character from down to up.
I expect Ethereum to rise to $2700
I am buying eth and actually holding it long term as I feel crypto is ready to rise again and break new highs.

Eth scenario 1.1.2025At the moment I have this on eth that since the market is probably looking for some place of reaction from where the price could fly to a new ATH on the way up, we have a lot of unselected liquidity so we'll see, I'm waiting for confirmation for now

Ethereum - Looking To Buy Pullbacks In The Short TermH1 - Bullish trend pattern
Currently it looks like a pullback is happening
Until the strong support zone holds my short term view remains bullish.

Ethereum - Looking To Buy Pullbacks In The Short TermH4 - Strong bullish momentum
Higher highs
No opposite signs
Until the strong support zone holds I expect the price to move higher further after pullbacks

ETHUSD TRENDLINE ANALYSIS BUYHere on ETHUSD price has moving uptrend and is likely to rise again after touching the trendline so is expected to go LONG and profit target should around 3207.74

ETHUSD Investment Plan - 05/May/2024Hello Traders,
Hope you all are doing good!!
I expect ETHUSD to go Up after completing this correction.
Look for your BUY setups around the marked zone.
Please follow me and like if you agree or this idea helps you out in your trading plan.
Disclaimer: This is just an idea. Please do your own analysis before opening a position. Always use SL & proper risk management.
Market can evolve anytime, hence, always do your analysis and learn trade management before following any idea.

ETHUSD / Long Trade Active ✅💡Hello Traders!
This is my idea for ETHUSD. I expect a bullish breakout as the price liquidates the old lows.
My expectation is to see the price to close the FVG and also to set a new PWH as we are in a bullish trend.
Please LIKE 👍, FOLLOW ✅, SHARE 🙌, and COMMENT ✍ if you enjoy this idea! Also, share your ideas and charts in the comments section below! This is the best way to keep it relevant, support us, keep the content here free, and allow the idea to reach as many people as possible.
____________________________________
www.tradingview.com

Ethereum - Looking To Buy Pullbacks In The Short TermH4 - Bullish trend pattern.
Higher highs.
No opposite signs.
Until the strong support zone holds I expect the price to move higher further after pullbacks.

#ETHUSD-BULLISH AS PREDICTED IN PREVIOUS SETUP!Hey Traders, as we had predicted in our reversal zone price exactly rejected and now we are targeting the 2000 region.
Please like and follow!!

ETH/USDT :: Everything is ready for a purchase !?ETH/USDT :::
The resistance line (orange line) has been broken and there is a possibility of returning to stabilize itself (price).
The middle line of the channel plays the role of the current resistance, so the possibility of corrective movements increases.
The price has had appropriate collisions in the channel, and the last collision occurred at the bottom of the channel, which determines the next destination in the upper range of the middle line .
<<<< Analyze simply with The_Best_Trader_1991 >>>>

$ETH BullMarket has BEGUN!Just like 2019 Ethereum started the Bullmarket ahead of bitcoin.
Today for the 1st time in over 1 year Ethereum passes all rules in the 2 day candle bull system.
Price above 20 MA and 10 EMA has crossed 20 EMA (so thats both)
StochRSI and MACD bullish momentum and much to grow.
Lets hope these are not fake outs!
The next week is telling
happy new year!

ETHUSD Idea H1Here is my view for ETHUSD on H1. The price could go up, you can put a pending order on the Order block or find an entry on LTF within OB Zone. Trade Safe!

ETHUSD Idea H1Here is my view for ETHUSD on H1. The price could go up, you can put a pending order on the Order block or find an entry on LTF within OB Zone. Trade Safe!
