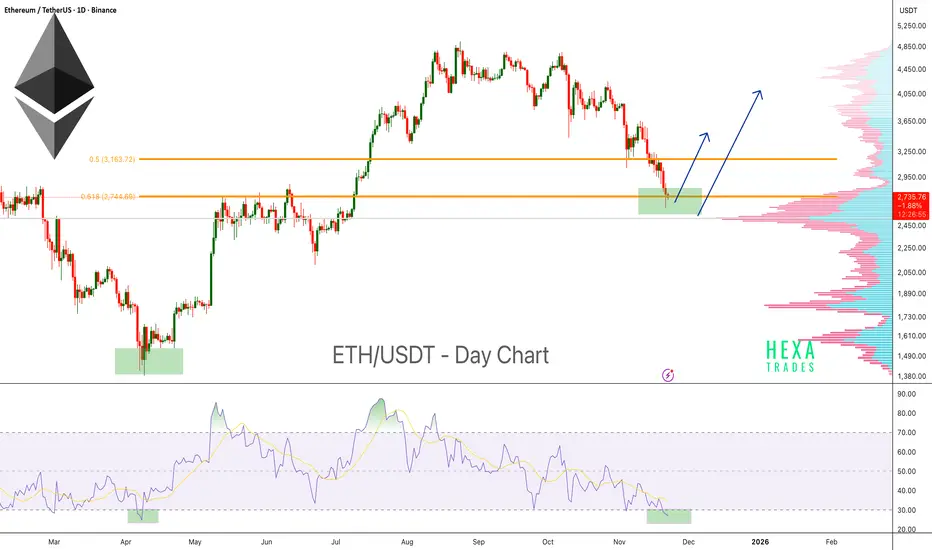
Ethereum Approaching Reversal Zone!Ethereum is currently trading at a major support zone, an area where price has historically shown strong reactions and multiple bounces. This demand zone has acted as a key reversal region several times, and ETH is once again testing it.
Price is also sitting near the 0.618 Fibonacci retracement (Golden Zone), which is commonly used to identify potential reversal points during market corrections.
The Volume Profile shows a high-volume node exactly at the current support area, indicating strong interest and previous accumulation. This increases the probability that this zone will act as a strong support.
On the momentum side, the RSI has entered oversold territory once again. Historically, whenever ETH’s daily RSI dipped below 30, it marked strong bottom areas followed by significant bounces.
Key Highlights
- ETH retesting a major historical support zone.
- Trading inside the 0.618 Fibonacci Golden Zone.
- Daily RSI oversold (<30) — historically a strong bounce region.
- Volume Profile high-volume node aligns with support, increasing the strength of the zone.
- Potential for a short-term reversal if the support continues to hold.
Cheers
Hexa
ETHUSDC
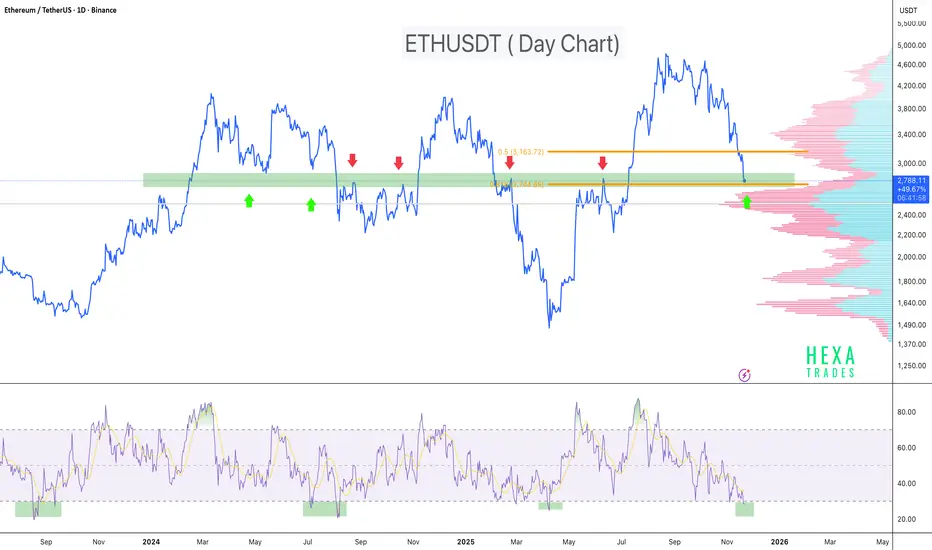
ETH : Oversold RSI + Fib Golden Zone = High-Probability ReversalETH is currently trading inside a major historical support zone, an area where price has repeatedly been rejected and bounced in the past. This level has acted as a strong demand zone multiple times, and the price is once again testing it.
On the momentum side, the RSI has dipped below 30 on the daily chart. Historically, every time ETH’s RSI dropped into the oversold region, it marked a strong bottom formation followed by a notable bounce.
Price is also sitting inside the Fibonacci golden zone, adding further confluence that this area could act as a potential reversal point.
Key Points:
- Strong multi-tested support zone
- Price reacting inside the Fib golden pocket
- Daily RSI oversold (<30) - historically reliable bottom signal for ETH
- High probability bounce zone if the support holds
- This is a critical level to watch for bullish reactions or early reversal signals.
Cheers
Hex
Spot idea for Ethereum (Nov 9, 2025)CRYPTOCAP:ETH / #Ethereum Spot idea for Ethereum (Nov 9, 2025)
On October 29, 2025, I posted an update saying it's worth waiting for Ethereum to drop into the $3,100 - $3,400 range, since that's where the nearest long trader liquidations are sitting, along with some big limit orders on exchanges like Binance and Coinbase.
We've hit those levels now.
Update:
So, it's time for a new update aimed at traders hunting for a better entry point on Spot (no leverage involved).
There are fresh large limit orders set by market makers and major whales.
➖ On Binance: $3,055, $3,000, $2,900, $2,800, $2,700, $2,500.
➖ On Coinbase: $3,000, $2,500.
If you check the Liquidation Heatmap on the Bybit crypto exchange through the Coinglass platform, the biggest pain point for traders is around $2,500 - $2,700, where big players will scoop up Ethereum more cheaply after those liquidations hit.
To sum it up:
The crypto market and the US stock market are both in correction mode right now, so you need to be extra cautious when looking for entry points and try to avoid using leverage on futures positions—otherwise, you could wipe out your trading deposit.
I think it's smart to hold off a bit longer and enter positions right where the big players are waiting, and where those trader liquidations are clustered.
That way, you'll have an edge on your entry and can hold the trade through Ethereum's distribution zone all the way up to $10,000.
Charts:
Looks like 2026–2027 could hit peak cycle vibes, right alongside the highs for stocks and crypto.
Altseason on deck?

Growth ahead of the Trump-Xi Jinping meeting in South Korea.CRYPTOCAP:ETH / #Ethereum 🔹 Donald Trump and Xi Jinping (October 19, 2025)
A positive outlook is shaping up for Ethereum, and it sure looks like a classic W reversal is in the works.
There's a ton of negativity swirling right now, with a lot of folks expecting prices to dip even lower (I was bracing for that final flush-out myself, but it looks like they scooped up the dip and are busy forming this reversal setup).
During that Ethereum drop on October 10-11, BitMine Immersion Technologies beefed up its reserves with 104,336 ETH worth $417 million.
As of this writing, the company's sitting on 3.03 million ETH valued at $12.18 billion, making it the biggest corporate whale holding Ethereum.
Whales and public companies are aggressively snapping up Ethereum and stacking their bags.
All that's left is to speculate where Ethereum's gonna top out and where they'll start dumping all this volume 8k? 10k?
I've pulled together some screenshots that back up the bullish signal:
1️⃣ Liquidations on the Hyperliquid exchange: As you can see on the chart above, once we break $5,000, a massive wave of short traders are gonna get wrecked that could spark another leg up in price momentum.
2️⃣ Coinbase order book: Check it out—above $5,000, there are limit orders lined up for profit-taking, so Ethereum might follow a similar path straight up to $8,000.
3️⃣ Current big orders on Binance and Coinbase exchanges.
4️⃣ OKX ETH/USDC liquidation heatmap.
Wrapping it up: On the daily chart, we're seeing a reversal pattern forming as a W (I call it the "pirate reversal" myself), and keep in mind that after the chaos on October 10-11, more than 1.6 million traders got absolutely rekt.
I doubt everyone's gonna pile back in buying or flipping to long positions anytime soon that plays right into the hands of the big market puppeteers and market makers.
They'll pump the price higher, whip up the hype, and offload their Ethereum stacks at the top.
Snapshot:

ETH 4H Analysis | Day 4🥳 Hey everyone! Hope you’re doing great! Welcome to SatoshiFrame channel .
✨ Today we’re diving into the 4-Hour Ethereum analysis. Stay tuned and follow along!
👀 Ethereum, the best and largest altcoin in our market, has also broken its descending trendline just like Bitcoin, and the long position scenario we discussed earlier has pretty much played out — I hope you took advantage of it.
🔍 After breaking through its previous resistances, Ethereum is now facing a new resistance area where some sellers have stepped in and some buyers are taking profits. There’s a possibility of a short-term pause in price movement. This zone has created a trigger for us, and the next, more logical long triggers for Ethereum are at $4,252 and $4,723. A breakout above these levels could kick off a strong upward move.
🧮 Looking at the RSI oscillator, it’s approaching the 70 zone but has been rejected near that level. For a confirmed breakout above $4,078, RSI needs to enter the overbought region. There’s also a support zone around 50, which could act as a rebound area for oscillatory movement. Right now, RSI has two key zones — 50 and 70 — that define its structure.
🕯 Notice the Ethereum volume behavior: to break through both static and dynamic resistance zones, the volume increased — this happened because a large number of sell orders were stacked in that area, and those orders needed to be filled before price could move upward smoothly. After that breakout, buying volume started to decline slightly, meaning both price and volume are now resting. For Ethereum to break this resistance zone, we either need sell orders to be absorbed or short positions to get squeezed by trapped traders.
🧠 We can outline a few possible scenarios for Ethereum’s position — some of them might be slightly more complex to manage:
🟢 Long Position Scenario 1
We need patience and a price cooldown. Wait for Ethereum to touch its nearest support zone, then rise with increasing volume. If during this move we see setup candles along with a resistance breakout, we can enter the position with a tight stop size.
🟢 Long Position Scenario 2
We can use an order-book stop-buy setup at Ethereum’s resistance and place a wider stop to catch any breakout spike. This allows participation in a potential price surge and can yield solid profit — though these setups usually take longer to reach an ideal risk-to-reward ratio.
🟢 Long Position Scenario 3
This one’s less likely but still worth noting: Ethereum could break its resistance with rising volume, then pull back to retest that same resistance (now turned support). Afterward, if we see volume increase, setup candles, and a confirmed pullback breakout, we can enter with a small stop size.
🔴 Short Position Scenario
A short setup would only make sense if the micro-buyer zone fails, accompanied by heavy whale candles, strong selling pressure, and an overall market crash.
❤️ Disclaimer : This analysis is purely based on my personal opinion and I only trade if the stated triggers are activated .

ETH/USDT — Critical Retest at 3950–3520 Before Next Major Move?Ethereum has once again faced strong rejection from the key supply zone between 4,940–5,272 (Fib 0.5–0.618), signaling heavy selling pressure at this multi-year resistance area.
Price action now points toward a potential retracement into the major demand zone (yellow block) between 3,950–3,520, where the next directional move is likely to be decided.
---
📊 Key Technical Structure
Major Supply Zone: 4,940 – 5,272 (Fib 0.5–0.618)
Minor Support: 4,120
Primary Demand Zone (Yellow Block): 3,950 – 3,520
Next Supports (if broken): 3,210 → 2,132
Bullish Fibonacci Targets: 6,345 → 8,082 → 10,891
---
📈 Bullish Scenario — “Reclaim & Expansion”
ETH still maintains a macro structure of higher-highs and higher-lows on the weekly timeframe.
As long as the 3,520 support holds, the broader trend remains bullish.
A strong rebound from 3,950–3,520 followed by a weekly close above 5,272 would confirm bullish continuation and open up:
Target 1: 6,345 (Fib 1.0)
Target 2: 8,082 (Fib 1.618)
Target 3: 10,891 (Fib 2.618 — potential cycle top)**
The key confirmation for bulls is a weekly reclaim above 5,272 with volume.
---
📉 Bearish Scenario — “Breakdown & Deeper Retracement”
If the selling pressure continues and ETH closes below 3,520, the bullish structure will be invalidated.
Such a breakdown could trigger a deeper retracement toward:
3,210 (Fib 0.618 confluence)
2,132–1,955 (deeper structural retracement)
Failure to defend the yellow block would shift ETH into a lower-high / lower-low structure, signaling a medium-term trend reversal.
---
🔍 Market Context
ETH is currently retesting the same macro resistance zone that marked the all-time high area in 2021.
The rejection at 5K highlights that supply remains dominant in this region, while the 3,950–3,520 demand block now serves as the key battlefield for bulls and bears.
As long as the yellow block holds, this pullback can still be considered a healthy correction within a macro uptrend.
But if it breaks, the market may enter a prolonged consolidation phase before the next cycle begins.
---
📍 Summary
Ethereum stands at a major inflection point:
Bullish Case: Bounce from 3,950–3,520 and reclaim 5,272 → targets 6.3K – 8K – 10.8K
Bearish Case: Breakdown below 3,520 → deeper correction to 3.21K or even 2.13K
The 3,950–3,520 demand zone is the final defense for ETH’s mid-term bullish structure — hold it, and the trend continues; lose it, and momentum fades.
---
#Ethereum #ETHUSDT #Crypto #TechnicalAnalysis #Fibonacci #PriceAction #CryptoMarket #WeeklyChart #ETHAnalysis #MarketStructure

ETH 15M Analysis - Key Triggers Ahead | Day 33☃️ Welcome to the cryptos winter , I hope you’ve started your day well.
⏰ We’re analyzing ETH on the 15-Minutes timeframe .
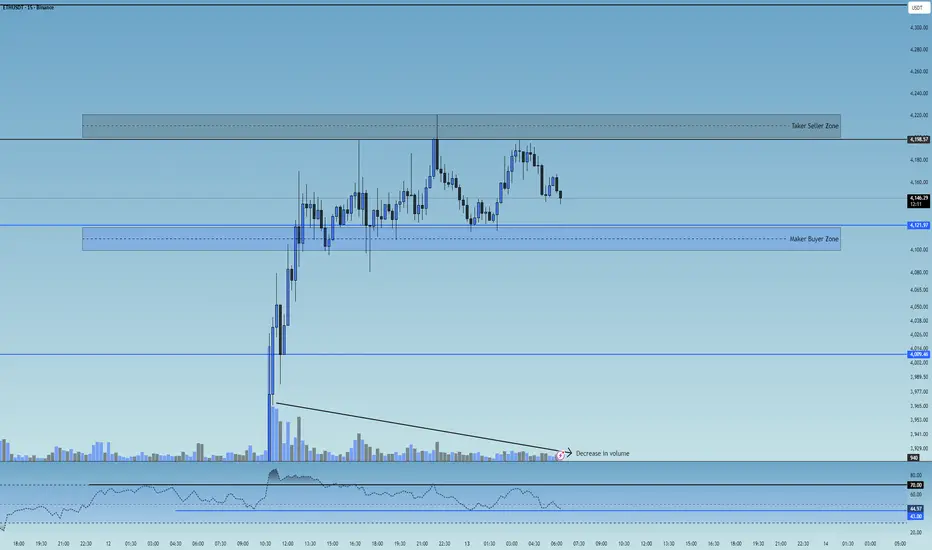
👀 On the 15-minute timeframe for Ethereum, we can see that after an impressive 10% rally, ETH showed one of the strongest recoveries in the market compared to other major coins — managing to climb above $4,100 and form a new trading range early in the week. Currently, Ethereum is consolidating within a range between $4,200 (top) and $4,121 (bottom). A breakout from this range could create either a long or short setup. Keep in mind that following this strong bullish move, trading volume has started to decline inside this range.
🧮 Looking at the RSI oscillator, we can see that after the recent surge, ETH’s momentum is now fluctuating between 43 and 70. A breakout above or below this RSI range would likely increase volatility and accelerate Ethereum’s next move — potentially with fewer candles but stronger momentum.
🕯 The size and volume of recent candles during Ethereum’s rally have been exceptional. Major buyers and institutional players have added substantial ETH positions to their portfolios. The large, high-volume bullish candles leading up to the current range reflect Ethereum’s strong momentum. Now, while the price is oscillating inside the range with reduced volume, a clear volume expansion is expected once the range breaks.
🧠 As Ethereum remains trapped inside this trading range, a breakout will require increased volume and RSI confirmation beyond the defined thresholds. This setup gives us two potential scenarios:
↗️ Long scenario: If Ethereum breaks above $4,200, which acts as a taker-seller resistance, and RSI pushes above 70 (Overbought zone), ETH could launch another bullish leg early in the week — showing an even stronger recovery compared to the rest of the market.
📉 Short scenario: If Ethereum breaks below $4,121, which is a maker-buyer support, and RSI drops under 43 toward the Oversold zone, it could continue its downward correction. However, given ETH’s strong bullish momentum, this bearish scenario would likely require negative market fundamentals to fully play out.
❤️ Disclaimer : This analysis is purely based on my personal opinion and I only trade if the stated triggers are activated .
ETH 1D Analysis - Key Triggers Ahead | Day 32☃️ Welcome to the cryptos winter , I hope you’ve started your day well.
⏰ We’re analyzing ETH on the 1-Day timeframe .
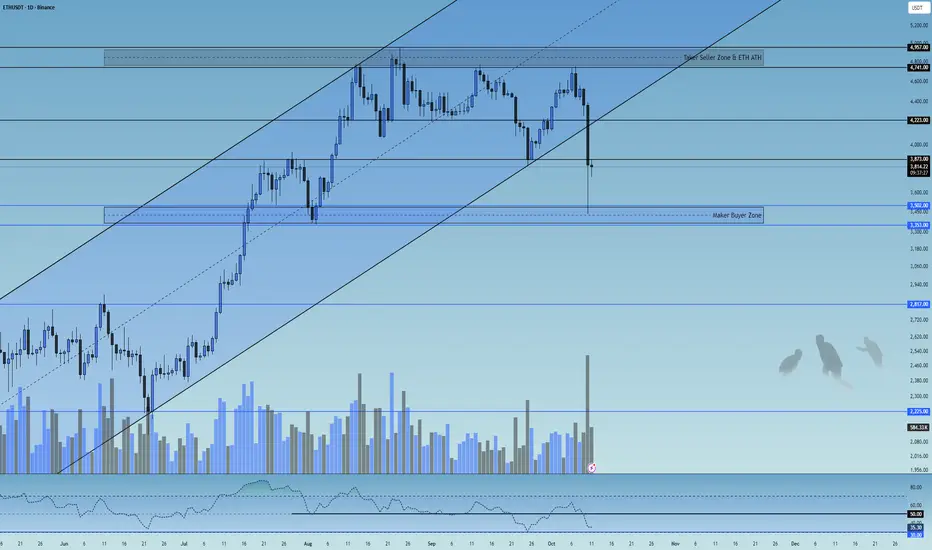
👀 On the Ethereum daily timeframe, we can see that after the historic economic war between the U.S. and China, Ethereum broke its ascending channel with a high-volume whale candle and has now managed to stabilize below this channel. Currently, Ethereum is in a critical decision-making zone, with two key resistance levels at $3,873 and $4,223.
A break and confirmation above these zones, especially $4,223, could lead to a bullish continuation; otherwise, a breakdown below the channel support may trigger a deep correction and cause Ethereum to enter a risk-off phase on the higher timeframe (weekly).
🧮 Looking at the RSI oscillator, after crossing down from the 50 level, it is now heading toward the 30 and oversold region. These two zones — 50 and 30 — are our key RSI levels, and when volatility crosses these zones, it can be accompanied by a significant increase in trading volume.
🕯 The recent daily candle of Ethereum has shown a massive amount of sell volume, with an open around $4,400 and a close below $3,900 (ignoring the shadow). This indicates strong selling pressure — if buyers fail to hold Ethereum above $4,200, we could see further correction and selling pressure ahead.
🧠 Currently, there’s no specific trigger for Ethereum, but a trading range will likely form in this zone until the end of the week.
A break of either the top or bottom of this range across multiple timeframes could give us a potential long or short position.
❤️ Disclaimer : This analysis is purely based on my personal opinion and I only trade if the stated triggers are activated .
$ETH Market OutlookCRYPTOCAP:ETH Market Outlook
Ethereum is currently consolidating, with a critical downside level at $4,000.
If $4,000 does not hold, the next supports are $3,500 and $2,400.
The $2,400 scenario remains highly unlikely, as it would imply a full retracement of the previous rally. In contrast, a pullback to $3,500 represents a 50% correction of the last upward move—a realistic outcome that would signal a temporary setback rather than a trend reversal, potentially setting the stage for continued upside momentum.
At present, CRYPTOCAP:ETH is trading within a range and sitting near the midpoint. Should this level break, the bottom of the range becomes the next logical target.
⚠️ Always DYOR.

Ethereum — The Big Wave Towards New Highs, Bullish 10k?📝 Full Analysis
Ethereum (ETH/USDT) on the 1W timeframe is showing a clear 5-wave Elliott Impulse structure. Currently, price is assumed to be in the (4) corrective phase after wave (3) peaked around the 4.9k–5k zone.
Wave (4) is now retesting the critical support zone between 3.21k – 3.54k, which perfectly aligns with the Fibonacci retracement 0.5–0.618 levels. This area also acts as a key demand zone (previous resistance now flipping into support).
If this zone holds, ETH is well-positioned to start wave (5), targeting new all-time highs. But if this level breaks, ETH could fall into a much deeper corrective scenario.
---
🔑 Key Levels on the Chart
Main Support (yellow zone):
0.5 = 3,541
0.618 = 3,210
Bullish Extension Targets (Wave 5):
0.5 = 4,940
0.618 = 5,272
1.0 = 6,345
1.618 = 8,082
2.618 = 10,891
These are not just Fibonacci levels, but psychological points where the market often decides whether to continue or reverse.
---
📈 Bullish Scenario
1. Support 3.21k–3.54k holds → confirms wave (4) completion.
2. ETH prints a weekly rejection candle or bullish engulfing → buyer strength confirmed.
3. Breakout above 4.95k activates bullish momentum with staged targets:
Target 1 → 5.27k (0.618 extension)
Target 2 → 6.34k (1.0 extension)
Extended Target → 8.08k (1.618 extension)
Maximal Target → 10.9k (2.618 extension, potential new ATH)
4. Wave (5) is often accompanied by volume surge & market euphoria → a prime opportunity for swing traders and mid-term investors.
---
📉 Bearish Scenario
1. ETH closes below 3.21k weekly → weakens bullish wave structure.
2. Possible deeper retracement:
2.13k (0.5 retracement from macro impulse)
1.95k (0.618 retracement)
3. If ETH breaks below ~1.95k, the 5-wave Elliott structure becomes invalid, and the market could enter a prolonged accumulation/sideways phase similar to 2018–2019.
---
🔍 Pattern Breakdown
Elliott Impulse Wave (1–5) with strong extended wave (3).
Fibonacci retracement & extension for precise S/R validation.
Resistance → Support Flip Zone (3.2k–3.5k).
Potential Bullish Flag Structure (macro) if wave (4) is confirmed as a healthy correction.
---
🎯 Extra Insights
Wave (5) is usually shorter than wave (3) if wave (3) was already extended → realistic target sits around 6.3k–8k.
If crypto market euphoria (ETH ETF narrative, altseason) kicks in, then 10k+ ETH becomes a valid macro target.
Caution: wave (4) often forms complex corrections (flat/triangle), meaning sideways consolidation before the breakout.
---
🛡️ Trading Notes
Conservative entry: wait for weekly rejection confirmation at 3.2k–3.5k.
Aggressive entry: buy the dip in support zone with tight stop below 3.2k.
Breakout entry: wait for breakout + retest above 4.95k.
Take profit progressively: 5.2k → 6.3k → 8k.
---
Ethereum Weekly is forming a 5-wave Elliott Impulse. Currently, price is testing the critical support zone at 3.21k–3.54k.
If this zone holds → ETH is ready for wave (5) rally targeting 5.2k → 6.3k → 8k → even 10.9k.
If this zone fails → ETH risks a deeper correction towards 2.1k–1.95k.
This is the decisive moment for ETH: either break into new ATHs or enter a prolonged correction.
Not financial advice — manage your risk.
---
#Ethereum #ETHUSDT #CryptoAnalysis #ElliottWave #Fibonacci #CryptoTrading #SwingTrading #WeeklyChart #PricePrediction #AltcoinSeason

ETH Oversold Again – Is a Bounce Coming?Ethereum (ETHUSDT) on the 4H chart is showing signs of oversold conditions as the RSI once again dips below the 30 level. This setup has historically aligned with local bottoms, where ETH tends to bounce back shortly after reaching such extreme levels of selling pressure. The current price action around $4,170 highlights a critical zone to monitor for potential reversal.
If ETH can hold this level and buying momentum steps in, a relief rally could follow in the short term. However, if weakness persists, further downside retests cannot be ruled out. Traders should closely watch RSI recovery and volume confirmation for signals of a stronger rebound.

$ETH doesn’t look done pumping yetCRYPTOCAP:ETH doesn’t look done pumping yet. While it’s screaming for consolidation, past cycles suggest another leg up toward $5,200–$5,400 or even higher at $6,000 before hitting critical overbought levels.
The likely scenario, if history repeats, is a sharp correction back to the EMA 50. However, strong institutional inflows could front-run this, pushing CRYPTOCAP:ETH higher without ever revisiting $4,000.
MACD and RSI are extended, but price action remains resilient. CRYPTOCAP:ETH can stay overbought longer than expected before finally flipping bearish.
No bearish divergeance, just a nice pump.
Bottom line: CRYPTOCAP:ETH still looks bullish, with 20–50% upside from here likely. But momentum is heating up, so it may be wise to gradually secure profits before the inevitable pullback.
DYOR

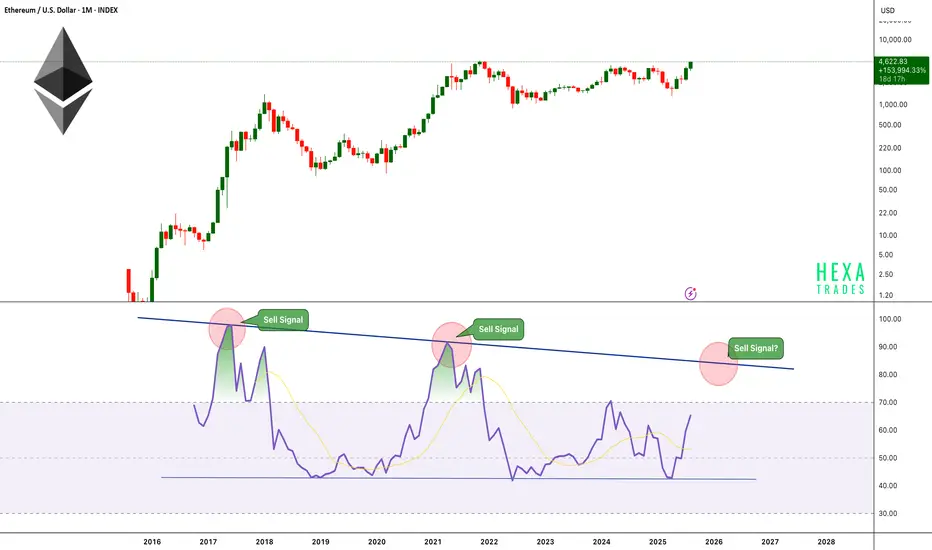
Ethereum Peak Incoming!The above ETH chart highlights the historical relationship between Ethereum’s weekly RSI and major cycle peaks. The red sell zone (RSI above 80) has consistently marked high-risk areas where ETH price eventually topped out.
📜Historical Patterns
🔷 2017 Bull Run
- RSI reached 98 (extreme overbought).
- ETH price peaked soon after.
- A bearish divergence followed, where ETH made higher highs while RSI made lower highs — signaling exhaustion before the major correction.
🔷 2021 Bull Run
- RSI peaked at 92, lower than the 2017 cycle.
- ETH price again topped within this red sell zone.
-A clear bearish divergence formed as ETH pushed to new highs while RSI declined. This preceded the end of the cycle.
🔷 Current Cycle (2025)
-RSI is trending higher and approaching the 80+ sell zone once again.
- Based on the cycle-to-cycle decline (98 → 92 → projected 85), this run could see its RSI peak around 85.
- If ETH price enters the 80+ RSI zone while forming a bearish divergence, ETH could be trading in the $6K–$7K range.
- The projected timing for this peak is late Q4 2025 or early Q1 2026.
📉 Declining RSI Peaks Show Market Maturity
-Each bull run has shown a lower RSI peak compared to the last (2017: 98 → 2021: 92 → projected 2025: 85).
-This reflects ETH’s market maturity: price continues to grow, but volatility and overbought extremes decline cycle by cycle.
🐻 Bearish Divergence Watch
- After previous RSI peaks, ETH displayed a consistent bearish divergence:
Price → higher highs
RSI → lower highs
- This pattern has historically signaled weakening momentum before a macro top.
- We could see a similar divergence formation in the current cycle, marking a potential exhaustion phase.
🎯 Trading Implications
- RSI above 80 = high-risk sell zone.
- A projected RSI peak near 85 could align with ETH’s cycle high.
- ETH may trade in the $6K–$7K range if this setup plays out.\
- Expected peak timing: end of Q4 2025 or beginning of Q1 2026.
- Monitoring RSI and divergence signals will be key in spotting the top.
Conclusion: In 2017, ETH peaked with the RSI hitting 98, while in 2021 the RSI topped at 92. For the current 2025 cycle, the projected RSI peak is around 85. This consistent decline in RSI peaks across cycles highlights ETH’s market maturity, with reduced volatility as the asset grows. Historically, each major top has also been preceded by a bearish divergence, and a similar setup could form again. Traders should remain cautious as ETH approaches the red sell zone above 80 RSI.
Cheers
Hexa
CRYPTOCAP:ETH BITSTAMP:ETHUSD BINANCE:ETHUSDT

ETH Monthly RSI Approaches Cycle Top? Ethereum is showing strong momentum on the monthly timeframe, pushing toward levels not seen since its previous all-time highs. However, a critical technical indicator, the Monthly RSI is currently at 65 and steadily approaching its historically reliable sell zone between 83–85.
Key Observations:
-The monthly RSI has been capped by a descending trendline resistance since 2017.
-Each time RSI touched this resistance — in 2017 and 2021 — ETH reached a cycle peak, followed by a significant multi-month correction.
-Price is rallying strongly, but RSI still has room to rise before hitting the critical 83–85 zone.
Historical Pattern:
-2017: RSI rejection led to a ~90% decline.
-2021: RSI rejection triggered a ~75% drawdown.
-Now (2025): RSI is climbing toward this zone for the third time, potentially signaling a major profit-taking window once reached.
When the RSI reaches the trend resistance level of 83–85, the price could potentially touch the $7,500–$9,000 range.
Cheers
Hexa
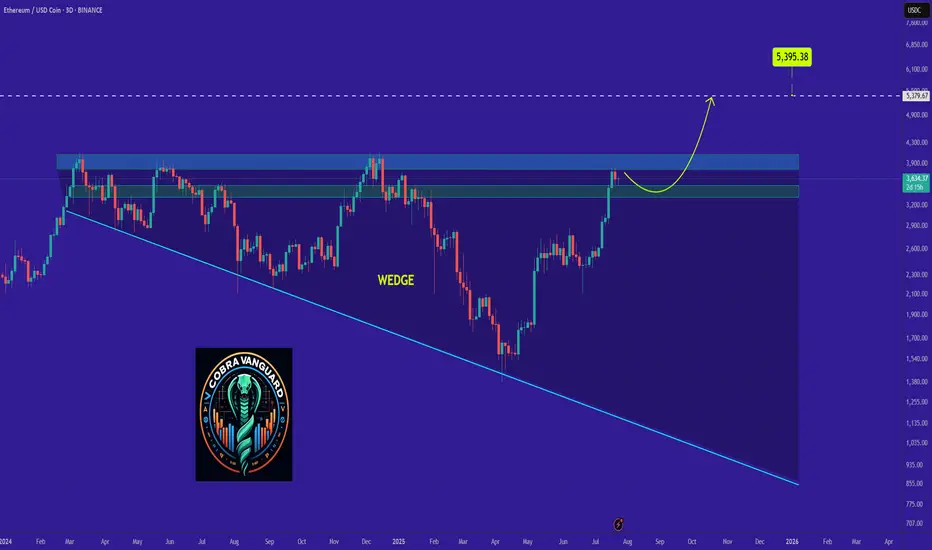
Why ETH Remains Bullish and Its Next Potential Move !It appears that the price is forming a cup and handle pattern, and if this occurs, it could push the price above $4K.
Best regards CobraVanguard.💚

ETH's situation+ Target PredictionThe price has reached the upper boundary of the wedge, which could lead to a slight price drop. We can be hopeful that after breaking out of the wedge, we will see significant price growth.
Give me some energy !!
✨We spend hours finding potential opportunities and writing useful ideas, we would be happy if you support us.
Best regards CobraVanguard.💚
_ _ _ _ __ _ _ _ _ _ _ _ _ _ _ _ _ _ _ _ _ _ _ _ _ _ _ _ _ _ _ _
✅Thank you, and for more ideas, hit ❤️Like❤️ and 🌟Follow🌟!
⚠️Things can change...
The markets are always changing and even with all these signals, the market changes tend to be strong and fast!!
Ethusdt buy / long setupEth has a good pullback yesterday. Eth showing strong momentum against all the market. Long at cmp 3641, first tp is 3960 the next is 4.1k. must use sl.

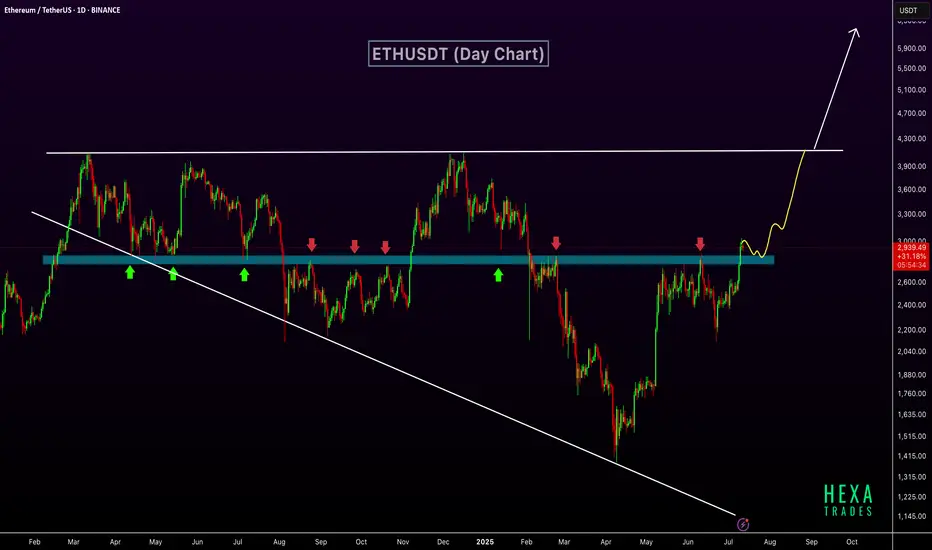
ETH Breaks Key Resistance – $6K Possible if Wedge BreaksETHUSDT has broken out above a key horizontal resistance zone that has historically acted as a strong support and resistance level. This zone, marked in blue, has seen multiple rejections and bounces over the past year, confirming its significance.
The recent breakout above this zone indicates a shift in market structure and suggests growing bullish momentum. The price action shows a clean move above resistance, with potential for a retest before continuing higher. The market is also forming a long-term broadening wedge pattern. The next target lies near the upper resistance of the wedge, around $4,000. If the price breaks above this broadening wedge, it could open the path toward the $6,000 level.
Regards
Hexa
$ETH: The 1-week chart is an absolute disaster!Once again, I want to make it clear: I’m naturally a bull. But I live in Thailand, far from the noise of influencers shouting "buy, buy, buy!" I’ve learned my lesson—when they scream buy, you get rekt. That’s why I rely solely on the charts.
Charts are just mathematics—they don’t lie. So here’s my honest interpretation of what I’m seeing for Ethereum:
🕐 Daily Outlook
Yes, we might see a few nice bounces in the short term. But if your plan is to hold ETH, you should be paying attention to higher timeframes, especially the weekly.
📉 Weekly Chart — It's Ugly
We’re clearly in a descending wedge, and overall, ETH is bearish. Don’t be fooled by the hype or the people trying to take your money.
- RSI is bearish, with a strong bearish divergence still unfolding.
- MACD is on the verge of a bearish crossover, and what’s worse, it’s doing that without even touching the neutral zone—a major red flag.
The last time we saw this setup? November 2021. The price crashed below $1,000.
🔍 Where’s the Support?
This cycle, the support zone looks closer to $1,500, mainly due to institutional interest and the ETF narrative. A full retracement seems unlikely, but technically speaking—it’s still a possibility.
🤔 Why Is This Happening Despite Institutional FOMO?
Here’s the key: ETH has staking, and every month, new CRYPTOCAP:ETH is minted to pay stakers. This creates constant inflation. On top of that, many stakers compound their rewards, accelerating the inflation. And guess what? These same stakers are selling as soon as ETH pumps.
So fundamentally, Ethereum is under pressure because of its own staking mechanics—a system flaw that creates long-term selling pressure.
Do your own research (DYOR). I could be wrong—but at least I’m not trying to sell you a course.

Anti-bart in July for ETHWherever it bottoms, this is THE dip to buy. Analogue forecasting with fractals similar to the ones I make for Bitcoin. Let's try this.

Ethereum Swing Trade: Short Setup with 2.2 R:R PotentialEthereum is approaching a potential breakdown from its current channel. A short swing trade setup with a 2.2 risk-to-reward ratio is forming. Wait for a confirmed break below the channel before entering.
Entry: $2,553
Stop Loss: $2,680
Target: $2,266
This is for educational purposes only.

Be careful with ETH !!!Currently, ETH is forming an ascending triangle, indicating a potential price increase. It is anticipated that the price could rise, aligning with the projected price movement (AB=CD).
However, it is crucial to wait for the triangle to break before taking any action.
Give me some energy !!
✨We spend hours finding potential opportunities and writing useful ideas, we would be happy if you support us.
Best regards CobraVanguard.💚
_ _ _ _ __ _ _ _ _ _ _ _ _ _ _ _ _ _ _ _ _ _ _ _ _ _ _ _ _ _ _ _
✅Thank you, and for more ideas, hit ❤️Like❤️ and 🌟Follow🌟!
⚠️Things can change...
The markets are always changing and even with all these signals, the market changes tend to be strong and fast!!

ETH/BTC bear market since 2021.. bounce time ?ETH / BTC
If you checked this chart you will notice that ETH was in downtrend and bear market against BTC since 2021 !
Now we have reached a very important multi years support (price action on 2020 - 2019 - 2016 )
Time for bounce soon ?
