ETHUSD: Ethereum Wave Structure Awaits ImpulseETHUSD: Ethereum Wave Structure Awaits Impulse
ETHUSD Wave Overview (D1 and H4)
As a trader who has been practicing wave analysis for over ten years, I note that the current picture for Ethereum shows the completion of an extended corrective formation and the potential for a new move.
Chart D1: The global structure indicates that the market is gradually breaking out of its sideways range. The wave formation looks like the end of a correction, which is laying the foundation for the next impulse.
Chart H4: Local dynamics confirm the first signs of an impulse. Key entry points are forming here, which could mark the beginning of a larger wave.
Main Scenario
After the completion of the corrective phase, a downward impulse sequence is expected to develop. This movement may be accompanied by increased seller activity and a shift in focus to the downside.
Alternative Scenario
If the price holds above local peaks and forms a stable upward impulse structure, the focus will shift to continued growth. In this case, the correction will be considered incomplete, and Ethereum may experience an additional rebound.
Trading Idea
Conservative approach: wait for confirmation of a breakout of key levels and enter with the trend.
Aggressive approach: use local impulses on H4 for earlier entries, but with short stops.
In both cases, it is important to maintain strict risk management and adjust the plan as new impulses emerge.
Results
ETHUSD is at a crossroads between the end of the correction and the beginning of a new impulse. The wave structure on D1 and H4 provides clear guidelines for action: watch for confirmation of the scenario and act with discipline.
Ethusdcrypto

ETH/USD: Is Ethereum Entering Wave V or Preparing for a ReversalETH/USD: Is Ethereum Entering Wave V or Preparing for a Reversal?
Weekly Scenarios
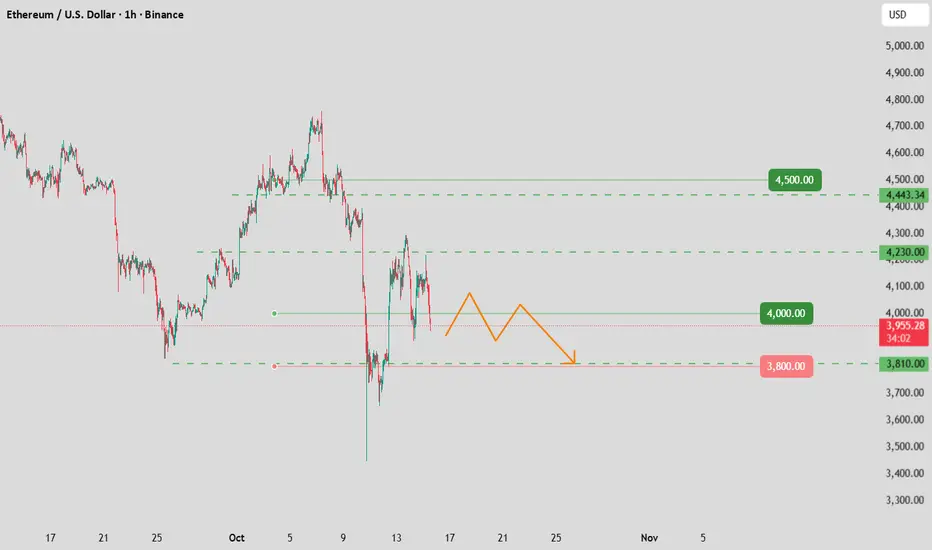
Bullish scenario: ETH holds the $3,800 level, breaks $4,500 → target near $5,000.
Consolidation: The price fluctuates between $3,800 and $4,500, preparing for the next move.
Bearish scenario: Break of support at $3,800 with volume → possible decline to $3,400–$3,600.
✅ Conclusion
The weekly analysis of ETH/USD shows that the market is at a key point: either the final uptrend is starting, or a correction is forming.
Holding support near $3,800 is the main bullish signal.
Break of resistance at $4,500 is the start of a rally.
A break below $3,800 is a signal for caution and a possible decline.

ETHUSD: Last Wave of Impulse or Start of a Big Correction?Weekly Scenarios
Bullish scenario:
ETH holds above ~$3,800 and breaks resistance at ~$4,500 → wave factor (5) intensifies → possible rise to ~$5,000.
Consolidation:
The price remains between ~$3,800 and ~$4,500, forming a sideways range, accumulating energy for the next move.
Bearish scenario:
Breakdown of support at ~$3,800 with volume confirmation → corrective wave A-B-C begins → test of ~$3,400–3,600.
✅ Conclusion
ETH/USD is at a key point for the coming week: either the bullish upward momentum ends, or a significant correction begins.
Watch for support at ~$3,800 to hold—a breakout could very well change the direction of the movement.
If the resistance at ~$4,500 is broken, the upward momentum will activate.
Primary targets: ~$5,000 if up, ~$3,400–$3,600 if corrected.

ETH: Still be a need for a pullback📈The closing price yesterday failed to hold above 3,950. There will still be a need for a pullback.
♦Market sentiment remains cautious, with long and short sides locked in a stalemate. From a technical pattern perspective, there is a trend of lower highs and lower lows in prices. If the current structure cannot be broken, market risks will persist.
💎
Buy 3855 - 3860 TP 3870 - 3890 - 3910 SL 3845
Sell 3900 - 3910 TP 3890 - 3870 - 3850 SL 3920
Daily-updated accurate signals are at your disposal. If you run into any problems while trading, these signals serve as a reliable reference—don’t hesitate to use them! I truly hope they bring you significant assistance

ETH: Pulled back under pressure📝ETH has recently broken through an important downward trend line, but then experienced a pullback.
📈Currently, the price is facing greater pressure near 3950. If the closing price can be above 3950, the weekend recovery may continue, and it may even challenge the 3970 - 4000 area. If it can break through this area, it may further rise; if it fails to close above 3950, there will still be a need for a pullback.The key support level below is near 3650.
💡If this position cannot provide effective support, the price may further decline to around 3550, or even near 3370.
💡The resistance level above is in the 3970 - 4000 area. This area is an important pressure level. If the price can effectively break through it, it may indicate that the structure has stopped falling and a rising opportunity will come.
♦Market sentiment remains cautious, with long and short sides locked in a stalemate. From a technical pattern perspective, there is a trend of lower highs and lower lows in prices. If the current structure cannot be broken, market risks will persist.
💎
Buy 3835 - 3840 TP 3850 - 3860 - 3870 SL 3825
Sell 3920 - 3910 TP 3900 - 3890 - 3880 SL 3930
Daily-updated accurate signals are at your disposal. If you run into any problems while trading, these signals serve as a reliable reference—don’t hesitate to use them! I truly hope they bring you significant assistance

Ethereum's pullback is not yet over.From a technical standpoint, Ethereum’s previous strong upward structure has been notably disrupted amid this pullback. The 1-hour K-line chart shows that after failing to break through the 4,788 high, ETH closed multiple consecutive long-bodied bearish candles. Its price has sequentially breached the MA5, MA20, and MA60 moving averages, marking a reversal in the short-term trend.
After the MACD indicator formed a "death cross" at a high level, the fast line has crossed below the zero line and entered the bearish zone. The green bearish momentum bars continue to expand, indicating that the short-term adjustment is not yet complete.
Today, Ethereum’s price is struggling to hold above the medium-term moving average. A break below this level could trigger a deeper decline.
BTH: Support Above 3800Today, after experiencing a sharp drop at the opening, the price of Ethereum found support above 3,800 and rebounded. Both attempts to test the bottom failed to break through the support at 3,800, which proves that the support here is solid. Then it entered a trend of slight oscillation and rebound. The long-short game is still relatively fierce. The subsequent trend needs to pay attention to the breakthrough of the key level of 4,000 and the effectiveness of the upper and lower support and resistance.
Buy 3930 - 3940 TP 3955 - 3965 - 3975 SL 3925
Sell 4015 - 4020 TP 3990 - 3980 - 3970 SL 4025
Daily-updated accurate signals are at your disposal. If you run into any problems while trading, these signals serve as a reliable reference—don’t hesitate to use them! I truly hope they bring you significant assistance

ETH: high-level consolidationAfter last week's sharp decline, the price began to rebound over the weekend and broke above 4,000. Today, it entered a high-level consolidation phase. This indicates that bullish forces have strengthened recently and are trying to push the price higher. Overall, today's trend shows that the bulls have started to counterattack, but the overall situation is still uncertain. Given the market's uncertainty, it is essential to set strict stop-losses and control positions when trading to guard against risks from sharp price fluctuations.
Buy 4020 - 4030
TP 4040 - 4050 - 4060
SL 4010
Daily-updated accurate signals are at your disposal. If you run into any problems while trading, these signals serve as a reliable reference—don’t hesitate to use them! I truly hope they bring you significant assistance

ETH:Plummeting sharplySince October, Ethereum has exhibited an extreme price trend of "rallying and then pulling back – plummeting sharply", reflecting violent swings in market sentiment between "optimism over technological prospects" and "macro-driven risk aversion".
The psychological levels of 3,400 and 4,000 serve as crucial short-term support. If the price breaks below 3,400, a flood of stop-loss orders may be triggered. Resistance is concentrated around 4,500 , and an effective breakout will require confirmation from increased trading volume.
In the short term, affected by lingering panic and insufficient trading volume, Ethereum is likely to consolidate within the 3,400–4,500 range. Close attention should be paid to the validity of the 3,400 support level.

ETH: Oscillated around the 3850Affected by the aftershocks of the global financial market turbulence in the previous two days, ETH rebounded slightly today and oscillated around the 3,850 level after a correction. This indicates that bullish sentiment in the market has not completely faded, but high leverage risks still persist.
Today's ETH trend also shows a tug-of-war between "long-term technical positives" and "short-term market volatility". Investors need to balance expectations for upgrades and macro risks, remain vigilant against the risk of a sell-off triggered by high-leverage trading, and at the same time pay attention to marginal changes in the Layer 2 ecosystem and upgrade adaptation progress.
Buy 3830 - 3840
TP 3850 - 3860 - 3870
SL 3825
Daily-updated accurate signals are at your disposal. If you run into any problems while trading, these signals serve as a reliable reference—don’t hesitate to use them! I truly hope they bring you significant assistance

ETHEREUM HIGH PROBABILITY SETUP SOON!!!🚨 ETHUSD HIGH PROBABILITY BUY SETUP 🚨
* Here We Can See Clearly The Next Potential Moves For ETH Coming Hours/Days.
* Keep Your Eyes Close On Your Trading Positions.
* Happy PIP Hunting Traders.
FXKILLA.

ETHUSD - Technical picture The long-term trend remains bullish: Technical picture
The long-term trend remains bullish: The price is confidently holding above the 20-, 50-, 100- and 200-day moving averages, which indicates a stable uptrend.
TipRanks indicators:
Almost all key MAs (5-200 days) are showing a “Buy” signal, with the exception of MA20 (Sell).
The current price of Ethereum (~$4,188) is significantly above all MAs, which confirms growth.
RSI (14) — 58.75 (neutral), MACD — Buy, ADX — neutral, ROC — Buy.
Result — “Strong Buy”.
TipRanks
Price levels
ETH previously relied on EMA50 (support zone), and demonstrates a continuation of the uptrend on short-term timeframes.
Economies.com
Support and resistance levels
Resistance: Near the psychological mark of $4,000 — an important barrier, the breakout of which can trigger another growth round.
Support: The standard of the ongoing bullish trend is the EMA50, as well as the levels of $3,700–$3,800, where ETH demonstrated stability.
Result
The trend remains positive: ETH is confidently above all key MAs, MACD and other signals confirm the strength of the bulls.
The key level is $4,000: breaking it can return ETH to the growth zone.
RSI at 58.8 and MACD in the Buy zone confirm the potential. However, given the overbought conditions, a small correction or consolidation is possible.
Recommendation: long positions on a rebound from support with a target of $4,000+, or entry upon a confident breakout of the resistance level.

ETHUSD Market Structure and TrendMarket Structure and Trend
ETH has risen from around $2900 to around $3800 in July, breaking the important $4000 resistance level that has previously failed to be broken three times in 2024
ETH is trading in a tight price range of $3650–$3704, with the price above the EMA(25) ($3460), confirming the medium-term bullish trend
Indicators and Signals
EMA(7): $3739 — price below → short-term weakness signal; but above EMA(25) and EMA(99) (~$2832) → trend remains bullish
Stochastic RSI (6): ~1.6 — oversold level, signaling a possible rebound
RSI (according to TipRanks): around 76.7 — overbought, partially limits growth
ADX (14-day) on Barchart: around 17–23 — weak trend and consolidation
Support and resistance levels
Support:
$3616 — 3650 zone (lower boundary of the range and EMA(25)),
then $3460 (EMA25) and then $3460–$3300 if broken below
Resistance:
$3739 (EMA7),
above $3800,
key level $4000 — psychological and technical barrier,
further — historical maximum around $4800
Possible scenarios
Bulls
If the price holds above $3650 and stochastic RSI bounces up — growth to $3739 → $3780–$3800 is expected.
Breakthrough and holding above $3800 will open the way to $4000–$4100, and potentially higher, up to $4800+ if the market turns in favor of ETH
Bears
Consolidation below $3616 → possible movement to $3460 and lower to $3300+ with increased selling and weak volume
RSI above 70 may foreshadow a correction in the absence of further momentum.

ETHUSD hourly trend analysis for April 11, 2025ETHUSD is bullish for the day. I foresee a Resistance at 1668 and if breaks and closes above 1668 then it may move further to 1714. The support is at 1467. If you are trading this pair, make sure to follow the stop-loss to avoid any potential risk.

ETH/USD "Ethereum" Crypto Market Heist Plan on Bearish Side🌟Hi! Hola! Ola! Bonjour! Hallo!🌟
Dear Money Makers & Robbers, 🤑 💰
Based on 🔥Thief Trading style technical analysis🔥, here is our master plan to heist the ETH/USD "Ethereum" Crypto market. Please adhere to the strategy I've outlined in the chart, which emphasizes short entry. Our aim is the high-risk Green Zone. Risky level, oversold market, consolidation, trend reversal, trap at the level where traders and bullish robbers are stronger. 👀 So Be Careful, wealthy and safe trade.💪🏆🎉
Entry 📉 : You can enter a short trade at any point,
however I advise placing sell limit orders within a 15 or 30 minute timeframe. Entry from the most recent or closest high level should be in retest.
Stop Loss 🛑: Using the 4H period, the recent / nearest high level.
Goal 🎯: 3000.0
Scalpers, take note : only scalp on the Short side. If you have a lot of money, you can go straight away; if not, you can join swing traders and carry out the robbery plan. Use trailing SL to safeguard your money 💰.
Warning⚠️ : Our heist strategy is incompatible with Fundamental Analysis news 📰 🗞️. We'll wreck our plan by smashing the Stop Loss 🚫🚏. Avoid entering the market right after the news release.
Take advantage of the target and get away 🎯 Swing Traders Please reserve the half amount of money and watch for the next dynamic level or order block breakout. Once it is resolved, we can go on to the next new target in our heist plan.
💖Supporting our robbery plan will enable us to effortlessly make and steal money 💰💵 Tell your friends, Colleagues and family to follow, like, and share. Boost the strength of our robbery team. Every day in this market make money with ease by using the Thief Trading Style.🏆💪🤝❤️🎉🚀
I'll see you soon with another heist plan, so stay tuned 🫂

#ETHUSD 4HETHUSD (4H Timeframe) Analysis
Market Structure:
Double Top Pattern: A classic reversal pattern has formed, with the price testing a key resistance level twice and failing to break higher, signaling potential bearish pressure.
Forecast:
Sell Opportunity: The formation of the double top suggests a possible reversal, with a move to the downside expected once the price confirms a break below the neckline.
Key Levels to Watch:
Entry Zone: Upon the break below the neckline of the double top pattern or after a retest of the neckline as resistance.
- **Risk Management:**
- **Stop Loss:** Placed above the recent high or the top of the double top pattern to manage risk.
Take Profit Zones: Target the next support levels or Fibonacci retracement zones for potential downside movement.
Market Sentiment:
Bearish Bias: A double top typically signals a reversal from an uptrend to a downtrend, with increased selling pressure expected once the neckline is broken.

Scenario ETH 11.12.24I see it with ethereum, so at the moment we still have bullish scenarios, but the moment I break through the support at the level of 3500-3400, a deeper correction may occur here, at least to the price of 3000, we are currently waiting for the formation to be completed.

ETHUSD Intraday (Day Trade) trendforecast for December 5th, 2024ETHUSD intraday or Day Trade trend forecast for December 5th, 2024. The intraday trend may begin with a bearish note and move upward. The day may close on a negative note. The forecast is based on the Timing points extracted from the previous data. The timing stamps used in the forecast are based on India Standard Time (IST).

ETH/USD "ETHEREUM" Crypto Market Heist Plan on Bullish SideHello!! My Dear Robbers / Money Makers & Losers, 🤑 💰
This is our master plan to Heist ETH/USD "ETHEREUM" Crypto Market Market based on Thief Trading style Technical Analysis.. kindly please follow the plan I have mentioned in the chart focus on Long entry. Our target is Red Zone that is High risk Dangerous level, market is overbought / Consolidation / Trend Reversal / Trap at the level Bearish Robbers / Traders gain the strength. Be safe and be careful and Be rich.
Entry 📈 : Can be taken Anywhere, What I suggest you to Place Buy Limit Orders in 15mins Timeframe Recent / Nearest Low Point take entry should be in pullback.
Stop Loss 🛑 : Recent Swing Low using 2H timeframe
Attention for Scalpers : Focus to scalp only on Long side, If you've got a lot of money you can get out right away otherwise you can join with a swing trade robbers and continue the heist plan, Use Trailing SL to protect our money 💰.
Warning : Fundamental Analysis news 📰 🗞️ comes against our robbery plan. our plan will be ruined smash the Stop Loss 🚫🚏. Don't Enter the market at the news update.
Loot and escape on the target 🎯 Swing Traders Plz Book the partial sum of money and wait for next breakout of dynamic level / Order block, Once it is cleared we can continue our heist plan to next new target.
💖Support our Robbery plan we can easily make money & take money 💰💵 Follow, Like & Share with your friends and Lovers. Make our Robbery Team Very Strong Join Ur hands with US. Loot Everything in this market everyday make money easily with Thief Trading Style.
Stay tuned with me and see you again with another Heist Plan..... 🫂

Why ETH is not going up? Dying slow death?ETH has lost its momentum and correlation with BTC for quite some time, even before the ETF announcements. It appears that institutional investors who previously held significant positions in ETH have shifted their focus entirely to BTC.
What are your thoughts about ETH?

ETH/USD "Ethereum" Market Robbery Plan on Bullish SideHola ola My Dear,
Robbers / Money Makers & Losers,
This is our master plan to Heist ETH/USD "Ethereum" Market based on Thief Trading style Technical Analysis.. kindly please follow the plan I have mentioned in the chart focus on Long entry. Our target is Red Zone that is High risk Dangerous level, market is overbought / Consolidation / Trend Reversal at the level Bearish Robbers / Traders gain the strength. Be safe and be careful and Be rich.
Attention for Scalpers : If you've got a lot of money you can get out right away otherwise you can join with a swing trade robbers and continue the heist plan, Use Trailing SL to protect our money.
Note: If you've got a lot of money you can get out right away otherwise you can join with a swing trade robbers and continue the heist plan, Use Trailing SL to protect our money.
Entry : Can be taken Anywhere, What I suggest you to Place Buy Limit Orders in 15mins Timeframe Recent / Nearest Swing Low
Stop Loss : Recent Swing Low using 2h timeframe
Warning : Fundamental Analysis comes against our robbery plan. our plan will be ruined smash the Stop Loss. Don't Enter the market at the news update.
Loot and escape on the target 🎯 Swing Traders Plz Book the partial sum of money and wait for next breakout of dynamic level / Order block, Once it is cleared we can continue our heist plan to next new target.
Support our Robbery plan we can easily make money & take money 💰💵 Follow, Like & Share with your friends and Lovers. Make our Robbery Team Very Strong Join Ur hands with US. Loot Everything in this market everyday make money easily with Thief Trading Style.
Stay tuned with me and see you again with another Heist Plan.....

Based on ETH/USD chart, here's a potential approach Based on your ETH/USD chart, here's a potential approach for deciding when to execute trades:
1. Support and Resistance Levels:
- Resistance: Around 3,491 - 3,446.
- Support: Around 3,385 - 3,202.
2. Chart Patterns:
- The price is currently in a descending channel, indicating a bearish trend.
- Look for potential breakouts above or below the channel to signal a possible change in trend.
### Trading Strategies:
1. Short Position:
- If the price continues to respect the descending channel and breaks below the current support level around 3,385, consider entering a short position.
- Set a stop loss above the recent resistance level around 3,446 to manage risk.
- Potential take profit levels could be at the next major support around 3,202.
2. Long Position:
- If the price breaks above the descending channel and the resistance level around 3,491 with significant volume, it might indicate a bullish reversal.
- Enter a long position on the breakout.
- Set a stop loss below the breakout point to manage risk.
- Potential take profit levels could be around 3,600 and 3,700, where previous resistance levels lie.
### Additional Considerations:
- Volume: Pay attention to trading volume. Higher volume during a breakout can indicate a stronger and more reliable move.
- Candlestick Patterns: Look for reversal or continuation patterns around key support and resistance levels.
- Market Sentiment: Keep an eye on overall market sentiment and news that could impact Ethereum prices.
### Execution Plan:
1. Monitor the Price Action: Keep a close watch on the price action around the key levels mentioned.
2. Set Alerts: Set alerts for when the price approaches key support and resistance levels or when there’s a potential breakout from the descending channel.
3. Confirm the Breakout: Wait for a confirmed breakout with volume before entering the trade to avoid false breakouts.
Remember, always manage your risk and have a clear plan for entry, stop loss, and take profit levels before executing any trade.

ETHUSDT Breakout TradeETHUSDT is moving in range, wait for the breakout to get trade or place your buy and sell stop with given Tp's.
Mange your risk according to account size!
