Ethereum Forecast: Navigating Market VolatilityAnticipating an upward trajectory towards $2,500 to $2,750, caution remains key amidst the cryptocurrency market's inherent volatility. Each downturn appears as a potential buying window, yet prudence in position sizing is advised. Institutional maneuvers and U.S. interest rate fluctuations may impact Ethereum. While declining rates could enhance crypto appeal, be prepared for the market's characteristic volatility amid potential buying opportunities during dips.
Ethusdcrypto

Ethereum's Dilemma: Surge to $2,500 or Face Decline?Ethereum traders are at a pivotal point as $2,300 proves to be a crucial battleground. Sustaining upward momentum here could lead to a significant rally towards the coveted $2,500 resistance, instilling renewed market confidence. Conversely, bears aim to breach the $2,200 support, potentially triggering a notable downturn with $2,000 as a possible target. The increasing availability of Ethereum on exchanges adds complexity, highlighting the delicate balance between market sentiment and technical factors shaping Ethereum's future path.

"Ethereum Price Targets a 5% Increase, Testing $2,141 High"The price of Ethereum (ETH) is poised for a 5% increase, aiming to test the highest level within the $2,141 range before a potential correction. The trend-breaking tool continues to play a supportive role as a key level, with immediate support standing at $2,029, maintaining its position above the ETH peaks. Similar to Bitcoin, the RSI indicator is on the verge of crossing above the signal line, indicating the potential for an upward move.
However, if sellers take control, Ethereum's price could fall into the supply zone, acting as a trend-breaking tool, confirming a continuation of the southward movement by breaking and closing below the midpoint of this order block at $1,935.
The downturn may extrapolate, causing Ethereum's price to bring the trend-breaking tool back into the supply zone below the support level of $1,864.

Ethereum Price Struggles to Maintain $1,935 Support LevelThe price of Ethereum (ETH) is at risk of losing a crucial support level at $1,935, marking the midpoint of the supply zone that has become a breaking point for the extended bullish trend ranging from $1,864 to $2,004. If the $1,935 level fails to hold firm, it could spell disaster for token holders, with ETH potentially sliding down to the psychological level of $1,800 or, in severe cases, rendering the bullish argument ineffective below $1,753.
Both the RSI and AO indicators support this outlook, trending southward as momentum continues to weaken. On the flip side, increasing buying pressure is substantial enough to demonstrate Ethereum's ability to overcome the supply barrier mentioned above at $2,009, fostering optimism and potentially propelling ETH back onto the upward trend. This could result in a price increase to $2,136, representing a 10% gain from the current level.

Ethereum Price Signals Potential 60% Surge Ethereum is showing signs of a significant breakout, forming an ascending triangle pattern with three higher lows and three nearly equal highs since June 2022. A decisive weekly close above the $2,000 horizontal resistance could trigger a 43% surge to $2,943.
Currently, Ethereum is holding above the support of the Momentum Reversal Indicator (MRI) at $1,936, indicating potential strength. If Bitcoin's price remains stable, Ethereum is expected to rally towards $2,943, facing resistance at $2,539.
While the target is theoretically $2,943, Ethereum could surpass this and reach $3,186, implying a 60% increase. Conversely, a failure to maintain support above $1,936 may lead to a correction towards $1,795. A weekly close below $1,547 would invalidate the bullish scenario, potentially pushing Ethereum down to $1,309.

"Ethereum Maintains Strong Position Above $1,935 Support Level" Ethereum's price maintains its position above the crucial $1,935 support level, which could spell doom for ETH if breached. With the RSI tilting upwards and AO staying in the positive zone, ETH may extend its upward trajectory, recovering above the $2,029 support to follow the upward trend. This could propel the second-largest cryptocurrency by market capitalization to reach its highest point at $2,136. However, in the face of increased selling pressure, Ethereum's price might dip below the $1,935 support. A decisive move below this level would confirm a downtrend, with ETH potentially testing the 25-day or 50-day EMA at $1,892 and $1,806, respectively.
In a more bearish scenario, Ethereum's price could target the 100-day EMA at $1,763, and breaking and closing below this level would invalidate the bullish argument below the $1,753 support.
Read also: Ethereum Price Prediction: Ascending Triangle Pattern Evaluates $4,000 Target for ETH in 18 Months.

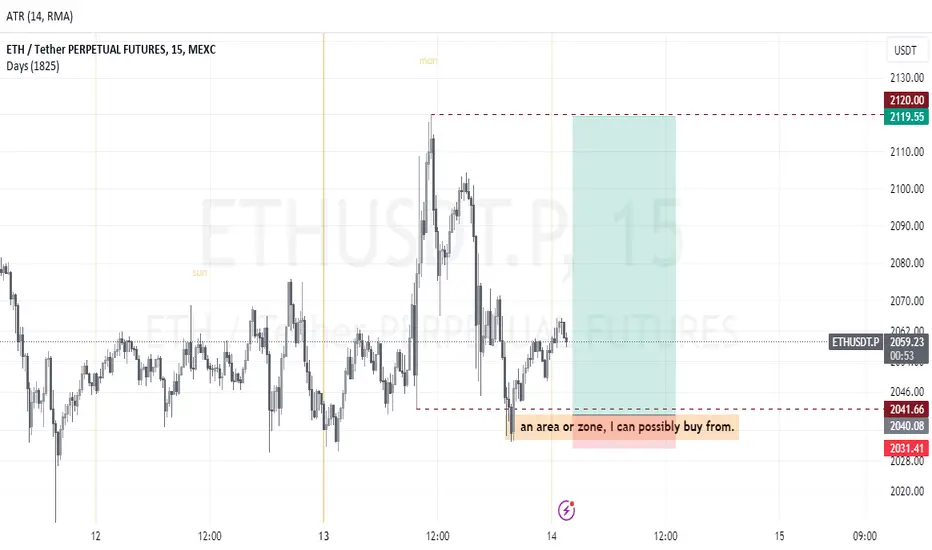
ETH Trade setup for 14th Nov 2023Eth has been bullish compared to BTC, so for me to trade this pair because it refused to make lower low but it also still took out some lows as an inducement to go short however, that's not the actually direction. It's direction is bullish to offset short traders. My possible scenario is for the market to trade into my zone at about 9:30am NY time today, then I can see what price is doing. If there be reasons to go long or short.
ETHUSD Analysis H1Here is my analysis for ETHUSD on H1 using Order Block. The price could go bullish, you can put a pending order on the Order block or find an entry on LTF within OB Zone. Trade Safe!

ETHUSD Analysis H1Here is my analysis for ETHUSD on H1 using Order Block. The price could go bearish, you can put a pending order on the Order block or find an entry on LTF within OB Zone. Trade Safe!

ETHUSD: $1880 IS THE NEW TARGET! For the short term view, we think price will be bullish up until $1880 region. At that point price will drop for the last time before it the trend changes.

Ethereum Short Term Buy IdeaH4 - Bullish divergence
Most recent downtrend line breakout.
Expecting short term bullish moves to happen here.
H1 - Higher highs.
No opposite signs.
Until the two strong support zones hold my short term view remains bullish here.

ETHUSDT Potential Breakout TradeBTCUSD moving in range now wait for breakout to trade or place your buy stop and sell stop.
Manage risk according to your account size.


ETHUSD- NEXT TARGET 2719$Dear Traders, our latest update on ETHUSD is here, we are noticing that price is preparing for another bull move upwards to 2700 which will fill up the gaps in the market. We will be closely looking at this crypto pair and will update you as we move.

ETHUSD SMC Concepts - Potential Move to 1573 LevelThe following analysis shows potential scenarios of what can occur but some of these will be key levels for price to hold if were to continue bullish or potentially buy back after price has moved down.

#ETHUSD- $2000 NEXT!! Hey Everyone, ETHUSD have been bullish and it will continue doing it so, crypto outlook remain stable throughout this year began, expecting price to fall first once it comes to our' equal lows' area we expect price to bounce from there and create another bullish impulse.

ETHUSD POTENTIAL LONGSETHUSD broke out of a corrective pattern with impulse and is currently creating a lower degree corrective pattern. looking forward to trading the breakout to the upside

ETHUSD GOING TO COMPLETE 5th WAVE.Etherrem looking to complete the 5th wave i am seeing a long upside of Ethusd but now my target will be the nearest resistence to make a new HH. Be careful about the the resistence we will be witness a retest of the the current price again.

WAVES appealing Risk Reward from $1.40its an Ethereum killer generation 1. So as risk concerns increase related to the ETH PoS merge coin unlock selling. Alt-Ethereum networks will regain interest.
Waves is well-known and has demonstrated strong pumpamentals in the past. Buy soon and remain patient, take profit whenever the pump happens.

#eth 300 bucks on deck its coming. been waiting on her....
1850 or die
what you want me to say? im not the one that struggles spotting these "useless pattern"
:)

#ETHUSD-BULLISH AS PREDICTED IN PREVIOUS SETUP!Hey Traders, as we had predicted in our reversal zone price exactly rejected and now we are targeting the 2000 region.
Please like and follow!!

#ETHUSD- PROBABLY THE BEST TIME TO INVEST!!ETHEREUM long term bias is bullish due to many reason one of the crucial reason is price momentum have changed, already touched the lowest level as crypto crashed, price is currently in process of making big bullish impulses so let's not miss it out on it!!
Good Luck and Show support by Following and Liking our Ideas!!

ETHUSDT heading to support in order to bounce backThe price currently struggling to break through the 4h resistance 1 zone. It seems likely that the price will come down to the 4h support 1 level and gain the required momentum to break through the 4h resistance 1 zone.
If it breaks through that, it will face the next resistance at 4h resistance 2 zone. Lets watch this price action to develop and we will assess it again after the price follows this path.
