Ethereum - Still a textbook chart!📌Ethereum ( CRYPTO:ETHUSD ) will first drop, then rally more:
🔎Analysis summary:
Over the course of the past couple of weeks, Ethereum has just been consolidating. But actually looking at the higher timeframe, Ethereum remains overall bullish. But first, we have to see another short term drop of about -20% back to the major support trendline.
📝Levels to watch:
$2,000
SwingTraderPhil
SwingTrading.Simplified. | Investing.Simplified. | #LONGTERMVISION
Ethusdlong

ETH/USD – Bearish Trend with Corrective Bullish Rally 🧱 Key Levels
🔴 Resistance Zones
2,100 – 2,150 → immediate intraday resistance
2,380 – 2,450 → major supply zone (your marked Target)
2,650 – 2,720 → higher-timeframe resistance
🟢 Support Zones
1,980 – 2,000 → short-term support
1,880 – 1,800 → strong demand (previous liquidity grab)
📐 Fibonacci Context
Price reacted around 0.86 Fib retracement, which often acts as a deep correction zone
This supports the idea of a relief rally, not instant trend flip
🔮 Projection (Based on Your Path)
Short-term:
➝ Sideways / small dip possible around 2,000
If 2,150 breaks & holds, price can move toward
🎯 2,380 – 2,450 target
Rejection below 2,100 could send price back to 1,950–1,980

ETH to 30K by 2027If we use logarithmic chart and fibonacci. We may see 30K for ethereum next year. As long as our support is not broken

Here is why I updated my Ethereum target to 30K instead of 15KYes you have read it right. I believe Ethereum will be 30K in around 18 months. Ma advice will be buy one or 0.5 Ethereum and forget about it and come back in 2027.
Disclaimer: Not financial advice. Do your own analysis

ETHUSD | This is ALARMING in a bad wayHello traders,
ETH is starting to look uncomfortably similar .
The higher timeframe structure resemblance to 2021 is actually hard to ignore.
- A sharp selloff
- A relief rally into the golden fib zone, that convinced everyone the bull market was resuming
And then… reality hit.
Fast forward to 2025:
- ETH has already put in a major high @$3500.
- Then a sell off
- Now price action is grinding higher into the same 0.5–0.618 retracement zone.
If the market continues to rhyme with the 2021 fractal, ETH could still push enough to reignite confidence in the market. Before starting a deeper corrective leg.
No doom posting. No moon talking.
Just a reminder that not every bounce is a reversal, and history has a habit of repeating itself when sentiment resets too slowly.
I think swing exposure here carries much risk. You can scalp LTF trades.
Short-term bullish. Long-term bearish.
Good Luck!
All our analysis is shared with honesty, care, and real effort. If you find value in it, a like or comment means a lot to show your support🙏📊

ETHUSDT Poised for Breakout: Triangle + Golden Fib Support AlignEthereum is currently compressing inside a triangle pattern on the daily timeframe, following a corrective move from recent highs. Price is building higher lows while facing descending resistance, suggesting volatility compression ahead of a potential expansion.
The yellow horizontal level marks the Fibonacci golden retracement zone, which has acted as a strong reaction level and is currently providing structural support. Price is also interacting with the 50, 100, and 200 EMAs, indicating a key decision area where trend direction is likely to be resolved.
Key technical points:
- Triangle pattern signaling imminent breakout
- Golden Fib retracement zone acting as support
- Price reclaiming / challenging the 50, 100 & 200 EMAs
Clear upside objective into the green target zone, a historical resistance area where price has been rejected multiple times over the past years
A confirmed daily breakout from the triangle, especially with strength above the EMAs, could open the path toward the green resistance zone. Failure to hold the Fib support would invalidate the setup and increase downside risk.
Cheers
Hexa

#ETH/USDT : Rebound Setup from ascending channel Support
#ETH
The price is moving within a descending channel on the hourly timeframe. It has reached the lower boundary and is heading towards a breakout, with a retest of the upper boundary expected.
The Relative Strength Index (RSI) is showing a downward trend, approaching the lower boundary, and an upward bounce is anticipated.
There is a key support zone in green at 3073, and the price has bounced from this level several times. Another bounce is expected.
The indicator is showing a trend towards consolidation above the 100-period moving average, which we are approaching, supporting the upward move.
Entry Price: 3139
First Target: 3152
Second Target: 3195
Third Target: 3240
Stop Loss: Below the green support zone.
Don't forget one simple thing: Money Management.
For inquiries, please leave a comment.
Thank you.

ETHUSD: Ethereum Wave Structure Awaits ImpulseETHUSD: Ethereum Wave Structure Awaits Impulse
ETHUSD Wave Overview (D1 and H4)
As a trader who has been practicing wave analysis for over ten years, I note that the current picture for Ethereum shows the completion of an extended corrective formation and the potential for a new move.
Chart D1: The global structure indicates that the market is gradually breaking out of its sideways range. The wave formation looks like the end of a correction, which is laying the foundation for the next impulse.
Chart H4: Local dynamics confirm the first signs of an impulse. Key entry points are forming here, which could mark the beginning of a larger wave.
Main Scenario
After the completion of the corrective phase, a downward impulse sequence is expected to develop. This movement may be accompanied by increased seller activity and a shift in focus to the downside.
Alternative Scenario
If the price holds above local peaks and forms a stable upward impulse structure, the focus will shift to continued growth. In this case, the correction will be considered incomplete, and Ethereum may experience an additional rebound.
Trading Idea
Conservative approach: wait for confirmation of a breakout of key levels and enter with the trend.
Aggressive approach: use local impulses on H4 for earlier entries, but with short stops.
In both cases, it is important to maintain strict risk management and adjust the plan as new impulses emerge.
Results
ETHUSD is at a crossroads between the end of the correction and the beginning of a new impulse. The wave structure on D1 and H4 provides clear guidelines for action: watch for confirmation of the scenario and act with discipline.

ETHUSD - Are Bears Ready for the Fall?ETHUSD on the 4H timeframe is clearly in a corrective downtrend, not a healthy bullish structure. The price action fits an Elliott Wave decline where wave 3 already completed near 2620 , followed by a weak and overlapping recovery that looks like wave 4. That recovery stayed inside a falling channel and never showed impulsive strength, which already tells you buyers are weak. More importantly, wave 4 is flirting with wave 1 territory, which puts the entire bullish hope on thin ice.
Right now, ETH is at a make or break zone. If this move is just a fake breakdown, price must quickly reclaim the channel and hold above recent highs. If not, then this is likely wave 5 of C, and downside continuation becomes the dominant scenario. The structure favors a final flush toward the 2380 to 2350 area, where wave 5 projection and channel support align. Anyone blindly bullish here is ignoring structure. This is not a buy the dip market, it is a wait for confirmation or respect the downtrend market.

ETHUSD Bull Trap? - Final Breakdown Setup Is Almost Locked InETH is still stuck inside a clear falling channel, and the entire pattern is behaving like a corrective downtrend. The recent bounce from 2620 looks sharp, but it’s still just a counter-trend move. Nothing here screams trend reversal yet.
Wave 3 ending at 2620 , and now the price is rising for a Wave 4 retracement. Wave 4 usually moves back toward the mid-channel and tests previous breakdown zones.
The red box around 3200–3300 is the key trap zone. This is where sellers can return because Wave 4 must not enter Wave 1 territory, which sits higher. As long as ETH stays under that invalidation level, the bearish structure remains fully intact.
The move looks like a classic (a)-(b)-(c) correction inside Wave 4. Once this corrective bounce completes, the chart suggests ETH will resume the downward path. The channel alignment and wave symmetry both support a final Wave 5 drop.
If the bearish count plays out, ETH could slide toward 2400 – 2300 in Wave 5 before a major bottom forms. That’s the zone where sellers exhaust and buyers take control again. Until ETH breaks the invalidation level with strength, downside remains the more probable outcome.
Stay Tuned!
@Money_Dictators

ETH Sharp Drop: Watching the Retracement Trap Zone📉 ETH Analysis – Breakdown, Retest Incoming
ETH has broken down sharply from the previous consolidation block, confirming a bearish continuation structure. The price has dropped cleanly below the range and is now forming a temporary bounce from the 3,060–3,090 zone.
Your chart highlights a potential retest zone around 3,220–3,250, aligned with:
The bottom of the previous range
The cloud resistance
The breakdown retest zone
A typical liquidity sweep level before continuation
This suggests the market may produce a ** corrective pullback** toward that marked area before sellers step in again.
---
🔍 Key Points
Trend: Bearish after breaking the ascending structure.
Current Move: Relief bounce from oversold region.
Main Target: Retest toward 3,220–3,250.
Expectation: From that zone, ETH likely faces selling pressure and resumes downside.
Invalidation: Break and hold above 3,260.

Will Ethereum’s Market Flow Signal a New Bullish Phase?🎯 ETH/USD: The "Thief Strategy" Blueprint | Layer Your Way to Victory! 💰
📊 Market Overview
Asset: ETH/USD (Ethereum vs US Dollar)
Market: Crypto
Trade Type: Swing Trade
Bias: Bullish (Post-Breakout Setup)
🎭 The Thief's Master Plan
Ladies and gentlemen, gather 'round! 🎩 We're not just trading here—we're executing the legendary "Thief Strategy" where we sneak into multiple price levels like a professional heist crew. No single entry point for us, oh no. We layer up, diversify risk, and wait for the vault to open! 💎
🚀 Entry Strategy: The Layering Technique
Primary Entry Zone: Any price level AFTER a confirmed breakout above $4,200 ✅
The Thief's Layering Method (Multiple Limit Orders):
🥇 Layer 1: $3,900
🥈 Layer 2: $4,000
🥉 Layer 3: $4,100
🏆 Layer 4: $4,200
Pro Tip: Feel free to add more layers based on your capital allocation and risk appetite. The more layers, the smoother your average entry price! Think of it as building a ladder to success.
🛑 Stop Loss: Protect Your Treasure
Thief's Stop Loss: $3,700 🚨
⚠️ Important Disclaimer:
Dear Ladies & Gentlemen (Thief OG's), I'm NOT recommending you blindly follow my stop loss. This is MY risk tolerance. You need to assess YOUR own risk management strategy. Set your stop loss according to your capital size, risk appetite, and sleep-at-night comfort level. Remember: Your money, your rules! 💼
🎯 Take Profit Target: Know When to Exit the Heist
Primary Target: $4,600 🎰
Why This Level?
📈 Moving Average acting as a strong resistance zone (think of it as the police barricade!)
🔴 Overbought conditions on technical indicators
⚠️ Bull trap zone — smart money might be waiting to distribute here
Exit Strategy:
When you see the moving average resistance + overbought signals flashing, it's time to take your profits and vanish into the night! 🌙
⚠️ Important Disclaimer:
Dear Ladies & Gentlemen (Thief OG's), I'm NOT recommending you blindly follow my take profit level. This is MY analysis. Scale out profits at levels that make sense for YOUR trading plan. Partial profits, trailing stops, whatever works for YOU. Make money, then TAKE money—at your own discretion! 💵
🔗 Related Pairs to Watch
Keep an eye on these correlated assets to confirm the broader market direction:
BITSTAMP: BITSTAMP:BTCUSD — The king of crypto. When Bitcoin moves, ETH usually follows. Watch for BTC breakouts above resistance.
BINANCE: BINANCE:ETHBTC — Shows ETH's relative strength against Bitcoin. Rising = ETH outperformance.
TVC: TVC:DXY (US Dollar Index) — Inverse correlation. Weaker dollar = stronger crypto typically.
Total Crypto Market Cap — Confirms if capital is flowing INTO or OUT OF the crypto space.
COINBASE: COINBASE:SOLUSD , COINBASE: COINBASE:ADAUSD — Other major altcoins. If they're pumping too, it confirms alt season momentum.
Key Correlation Point: If Bitcoin is breaking resistance zones and the Dollar Index (DXY) is weakening, our ETH setup gets significantly stronger! 📊✨
🧠 Technical Analysis Breakdown
What We're Watching:
✅ Breakout Confirmation: Price must close above $4,200 with volume
✅ Support Levels: $3,900-$4,100 range acts as accumulation zone
✅ Resistance Zone: $4,600 where moving averages + overbought conditions converge
✅ Risk-Reward Ratio: Solid setup with layered entries minimizing average cost basis
The Thief Strategy Philosophy:
Instead of gambling on ONE entry point, we spread our risk across multiple price levels. This way, we're dollar-cost-averaging into the position BEFORE the breakout confirmation, positioning ourselves ahead of the crowd! 🎯
🎬 Final Words from the Thief
Remember, OG's: The best trades are the ones where you're positioned BEFORE the crowd rushes in. Layer your entries, manage your risk like a professional, and know when to take your profits and disappear! 👻
Stay disciplined, stay profitable, and let's make this heist a success! 🏆
✨ If you find value in my analysis, a 👍 and 🚀 boost is much appreciated — it helps me share more setups with the community!
#ETHUSD #Ethereum #CryptoTrading #SwingTrade #ThiefStrategy #LayeringStrategy #CryptoAnalysis #TechnicalAnalysis #TradingView #CryptoSetup #AltcoinSeason #ETHBreakout #RiskManagement #TradingStrategy #CryptoIdeas

Ethereum Hits Demand Zone – Smart Money Reaction Begins1. Major Breakdown Completed
ETH formed a sharp sell-off leg, moving along the long diagonal trendline you drew.
This indicates strong downside momentum that has now reached exhaustion near the bottom zone.
2. Price Tapped a Key Demand Zone
The lower green/grey area marks a high-volume demand block.
ETH reacted strongly from this zone, showing:
A wick rejection
Shift in market structure
Buyers absorbing the remaining liquidity
This confirms the zone is valid.
3. Liquidity Grab at the Lows
That spike below the structure (where you marked the “M-shaped” dip) looks like a classic stop-hunt / liquidity sweep.
After grabbing liquidity, ETH bounced aggressively.
This is usually a sign of smart-money accumulation.
4. Early Trend Reversal Signals
The small bullish rally forming now suggests:
Momentum is shifting
Bears are losing control
ETH might build a new short-term uptrend from this area

Can ETHUSDT Sustain Momentum After LSMA Breakout?🔥 ETHUSDT BULLISH BLUEPRINT: LSMA Confirmed, Awaiting WMA Breakout for Range Escape! 🚀
Description:
👑 ATTENTION, LADIES & GENTLEMEN – THE THIEF OGs! 👑
Welcome to a clear, actionable blueprint for $ETHUSDT. This isn't just a signal; it's an educational opportunity to understand confluence and manage your own risk like a pro.
📈 THE BIG PICTURE (Market Context):
Ethereum is showing strength within a defined range. A critical LSMA breakout has already confirmed the underlying bullish bias. We are now waiting for the final confirmation to trigger a potential swing move UP.
⚙️ TRADE PLAN (Bullish Confluence):
Direction: Bullish 🐂
Style: Day Trade / Swing Trade
Phase: Range-Bound, awaiting bullish breakout confirmation.
Key Levels: Range resistance is the key hurdle.
🎯 KEY LEVELS & LOGIC:
🟢 TRIGGER ZONE (Entry): $3,200.00
Wait for a decisive candle close ABOVE the Weighted Moving Average (WMA) at this zone.
This WMA breakout is our awaited confirmation to join the LSMA's bullish bias.
"YOU CAN ENTRY AT ANY PRICE LEVEL AFTER THE WMA BREAKOUT" – but the $3,200 zone is optimal for confirmation.
🔴 RISK DEFINITION (Stop Loss): $2,900.00
This is MY "Thief SL" – a level that invalidates the setup.
CRITICAL NOTE: 📢 I am NOT recommending you use only my SL. ADJUST based on YOUR strategy & risk tolerance. Place your SL AFTER the MA breakout confirmation. Protect your capital first!
🟡 PROFIT TARGET (Take Profit): $3,500.00
This target aligns with a historical resistance zone where moving averages may converge.
WARNING: Be aware of potential overbought traps and resistance. "Escape with profits."
CRITICAL NOTE: 📢 I am NOT recommending you use only my TP. Manage your trade actively. "Take money at your own risk." Scale out partials or trail your stop!
💎 THE THIEF OG's GOLDEN RULES:
This is a BLUEPRINT, not financial advice.
YOU are responsible for your own trades, risk, and money management.
Confirmation > Impulse. Wait for the WMA breakout.
Always use a stop-loss. No excuses.
🔍 RELATED PAIRS TO WATCH (Correlation & Key Insights)
Monitoring correlated assets strengthens confirmation and trend accuracy.
Here are the most relevant ETH-linked market movers:
1️⃣ BINANCE:BTCUSDT – Bitcoin vs Tether
Correlation: High
Why it matters:
Bitcoin leads overall crypto sentiment.
ETH breakouts are stronger when BTC breaks key resistance zones.
If BTC rejects from MA levels, ETH often loses momentum too.
What to track:
BTC Daily MA structure
BTC dominance (BTC.D)
Volatility cycles
2️⃣ BINANCE:ETHBTC – Ethereum vs Bitcoin
Correlation: Medium–High (Relative Strength Pair)
Why it matters:
Shows whether ETH is outperforming or lagging against BTC.
A breakout in ETH/BTC gives early confirmation of strong ETH upside.
If ETH/BTC drops, ETHUSDT upside can slow even if USDT charts look bullish.
Key levels:
ETH/BTC horizontal range
MA crossovers
Relative strength slope
3️⃣ BINANCE:SOLUSDT – Solana vs Tether
Correlation: Moderate
Why it matters:
Competes with Ethereum in Layer-1 dominance.
Solana pumps often trigger temporary liquidity rotation away from ETH.
If SOL rallies aggressively, ETH may consolidate longer.
Watch for:
Layer-1 sentiment shifts
Capital rotation between SOL & ETH
4️⃣ BITTREX:MATICUSDT – Polygon vs Tether
Correlation: Medium
Why it matters:
Ethereum Layer-2 ecosystems influence ETH network usage & fees.
MATIC strong moves can signal increased demand for ETH’s ecosystem indirectly.
5️⃣ COINBASE:XTZUSD (or) BINANCE:AVAXUSDT (or) BINANCE:BNBUSDT
Correlation: Low–Moderate
Why it matters:
Any strong L1 competitor rally can pull temporary liquidity from ETH.
Helps judge broader altcoin sector strength.
🧭 KEY CORRELATION SUMMARY
BTCUSDT → Drives crypto trend direction
ETH/BTC → Determines whether ETH has relative strength
SOL, MATIC, BNB, AVAX → Track liquidity rotation
Stronger confirmations = safer ETH entry after WMA breakout

ETHUSD 30m – Bullish Trend Continuation SetupBITSTAMP:ETHUSD
ETH delivered a sharp bullish leg after sweeping the support zone near 2718. Price is now holding above resistance-turned-support (2850.7). As long as the trend channel remains intact, structure favors continuation toward the final target.
Key Scenarios
✅ Bullish Case 🚀
Ideal entry: pullback toward trend support
Confirmation: rejection + bullish candle
🎯 Target 1: 3030
🎯 Final Target: 3095–3100 region
❌ Bearish Case 📉
Failure below 2850 invalidates bullish scenario
Possible drop towards 2780 → 2718 support
Current Levels to Watch
Resistance: 3030 / 3095
Support: 2850 / 2780 / 2718
⚠️ Disclaimer: This analysis is for educational purposes only. Not financial advice.

Ethereum Price Prediction: Can New Holders Fill the LTH Gap?Ethereum is trading at $2,805 at the time of writing, reflecting a 6% daily decline. The asset is sitting just below the $2,814 resistance level after its latest failed attempt to break through $3,000.
Based on current sentiment and market structure, ETH could stabilize and attempt a rebound, but a strong recovery will require consistent investor support. In the near term, Ethereum will likely fluctuate between $2,814 and $3,000 as it searches for direction.
If bullish momentum strengthens and fresh demand remains steady, Ethereum could finally break above the $3,000 barrier. A successful breach would pave the way for a move toward $3,131 and potentially $3,287, invalidating the short-term bearish thesis.

XYZ(BLOCK) HIGH PROBAIBILITY LONG SETUP SOON!!!🚨 XYZ HIGH PROBABILITY BUY SETUP 🚨
* Here We Can See Clearly The Next Potential Moves For BLOCK Coming Hours/Days.
* Keep Your Eyes Close On Your Trading Positions.
* Happy PIP Hunting Traders.
FXKILLA.

ETHUSD | Don’t get fooled...Understand the chartTL;DR: This chart looks like what happened in 2021 in a ridiculous way. A breakout, a rejection, a relief rally, then a painful descent through layered support zones.
I really don’t want to be the guy who says “I told you so” but charts teach with loss as often as profit.
Look at what happened when ETH reached ATH in 2021. A clear breakout and immediate rejection. Price then collapsed with multiple spikes to trick HODLers and bull for life traders.
----------------------------------------------
The lesson the chart here to offer
If our analysis is correct, we’ll see a short-lived manipulation into resistance ($3.6–$4.0k) that will suck in all longs.
What happens next you may ask? Straight down to support zones.
Breaking one support usually leads to the next.
----------------------------------------------
Practical rules to survive this (educational only):
Assume rallies are traps until proven otherwise. Wait for structure (higher lows + higher highs) on higher timeframes before adding long positions.
Manage size. If you trade this, keep position sizing small and protect capital with stops and trailing stops when in a winning trade.
Use multi-timeframe confirmation. Don’t buy solely on daily candles. Micro structure of a daily candle forms on smaller timeframes.
If you want to accumulate, always scale. Don’t all-in. That way you better position yourself, increase your profit and decrease your loss
As always...Stay disciplined.
----------------------------------------------
Good Luck!
P.S: Check the linked idea for a better understanding.

ETHUSD H1 | Bullish Bounce Off SupportMomentum: Bullish
Price is currently above the ichimoku cloud, and is still above the ascending trendline.
Buy entry: 2,982
- Overlap support
- 50% Fib retracement
Stop Loss: 2,896.63
- Swing low support
Take Profit: 3,076.67
- Swing high resistance
High Risk Investment Warning
Stratos Markets Limited (tradu.com/uk ), Stratos Europe Ltd (tradu.com/eu ):
CFDs are complex instruments and come with a high risk of losing money rapidly due to leverage. 70% of retail investor accounts lose money when trading CFDs with this provider. You should consider whether you understand how CFDs work and whether you can afford to take the high risk of losing your money.
Stratos Global LLC (tradu.com/en ): Losses can exceed deposits.
Please be advised that the information presented on TradingView is provided to Tradu (‘Company’, ‘we’) by a third-party provider (‘TFA Global Pte Ltd’). Please be reminded that you are solely responsible for the trading decisions on your account. Any information and/or content is intended entirely for research, educational and informational purposes only and does not constitute investment or consultation advice or investment strategy. The information is not tailored to the investment needs of any specific person and therefore does not involve a consideration of any of the investment objectives, financial situation or needs of any viewer that may receive it. Past performance is not a reliable indicator of future results. Actual results may differ materially from those anticipated in forward-looking or past performance statements. We assume no liability as to the accuracy or completeness of any of the information and/or content provided herein and the Company cannot be held responsible for any omission, mistake nor for any loss or damage including without limitation to any loss of profit which may arise from reliance on any information supplied by TFA Global Pte Ltd.

ETHUSD – You have been warnedImagine you are on a high way speeding with a Porche 911 and running kinda low on gas, and you spot a station where you could get gas for free. You would fill 3 tanks right away, right?
That is exactly why market makers love this repeating pattern in a bearish market. Why?! Because its free "gas"...free liquidity.
descending channel → fake breakout → long manipulation → deeper bleed.
---------------------------------------------------
Look at what happened in 2024
Price broke above structure swing high, dragged liquidity, faked strength…
and instantly got rejected back down
That’s not bullish momentum. That’s a liquidity fuel for the market.
Markets do this right before a bigger move down.
---------------------------------------------------
To be honest, ETH chart is full of F U moves all over the place. But, the basic principles kinda remain intact.
In 2024 after the long manipulation, price fully respected the previous swing low.
And that should be the same case now with our swing low.
We are in a bearish trend, don't ego fight the market.
However, if price broke our previous swing low its literally free fall to $800~$1k
---------------------------------------------------
Your chart’s projection is clear:
Sweep the lows, Trap the late shorts, Send ETH flying back to $4k+
But not before the pain.
---------------------------------------------------
Good Luck!

ETHUSD H1 | Bullish Bounce Off Key SupportMomentum: Bullish
Price is currently above the ichimoku cloud.
Buy entry: 2,867.08
- Pullback support
- 61.8% Fib retracement
- 100% Fib projection
Stop Loss: 2,777.16
- Overlap support
Take Profit: 2,972.69
- Swing high resistance
High Risk Investment Warning
Stratos Markets Limited (tradu.com/uk ), Stratos Europe Ltd (tradu.com/eu ):
CFDs are complex instruments and come with a high risk of losing money rapidly due to leverage. 70% of retail investor accounts lose money when trading CFDs with this provider. You should consider whether you understand how CFDs work and whether you can afford to take the high risk of losing your money.
Stratos Global LLC (tradu.com/en ): Losses can exceed deposits.
Please be advised that the information presented on TradingView is provided to Tradu (‘Company’, ‘we’) by a third-party provider (‘TFA Global Pte Ltd’). Please be reminded that you are solely responsible for the trading decisions on your account. Any information and/or content is intended entirely for research, educational and informational purposes only and does not constitute investment or consultation advice or investment strategy. The information is not tailored to the investment needs of any specific person and therefore does not involve a consideration of any of the investment objectives, financial situation or needs of any viewer that may receive it. Past performance is not a reliable indicator of future results. Actual results may differ materially from those anticipated in forward-looking or past performance statements. We assume no liability as to the accuracy or completeness of any of the information and/or content provided herein and the Company cannot be held responsible for any omission, mistake nor for any loss or damage including without limitation to any loss of profit which may arise from reliance on any information supplied by TFA Global Pte Ltd.

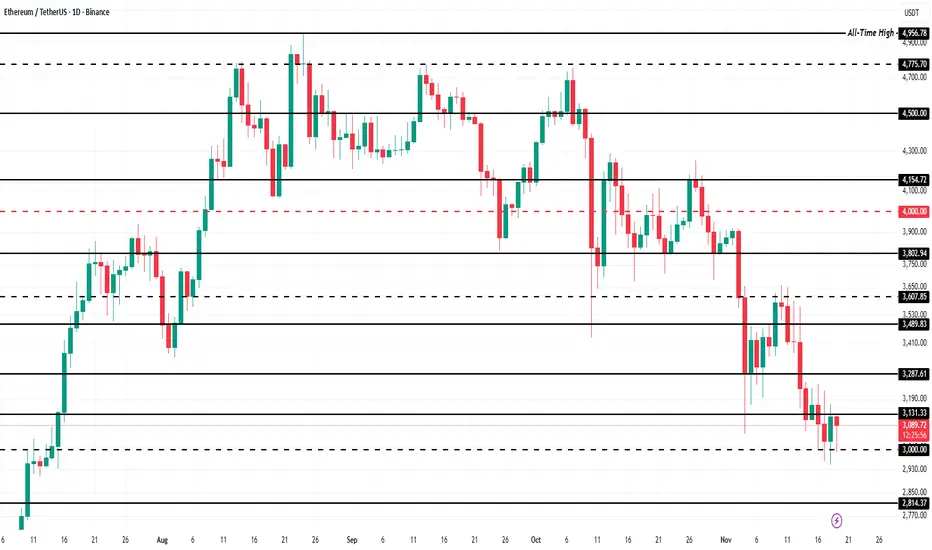
This Is How Ethereum Price Can Avoid A Crash Below $3,000Ethereum trades at $3,094, holding above the critical $3,000 support level after its sharp decline. This marks the first time in two months the asset has fallen this low. Maintaining support will be essential in preventing deeper losses and setting the stage for a potential recovery.
ETH is currently positioned below the $3,131 resistance level and is waiting for a catalyst to move higher. The supportive on-chain signals suggest that a push toward $3,287 is likely. If momentum strengthens, Ethereum could extend the rise and target $3,489 in the coming sessions.
If bearish pressure increases, Ethereum could break below $3,000 and invalidate the current bullish outlook. A fall through support may expose ETH to a decline toward $2,814 as selling intensifies. This scenario would reflect broader weakness and delay any major recovery attempt.
EthereumETHUSD
- Completed " 12345 " Impulsive Waves
- Consolidation Phase as an corrective pattern in Short Time Frame
- Break of Structure
- RSI - Divergence
- Change of Characteristics
