ETH Trend: 3000→2820→3400ETH has staged a minor rebound but is set for another sharp pullback.
Focus on the support at 3000 – a break below this level will lead to a further decline to around 2820, where strong support is anticipated.
It will then rebound and break above 3400 to resume the uptrend.
Accurate signals updated daily. They serve as a reliable guide for trading issues – feel free to refer to them. Hope they help!
Ethusdsell

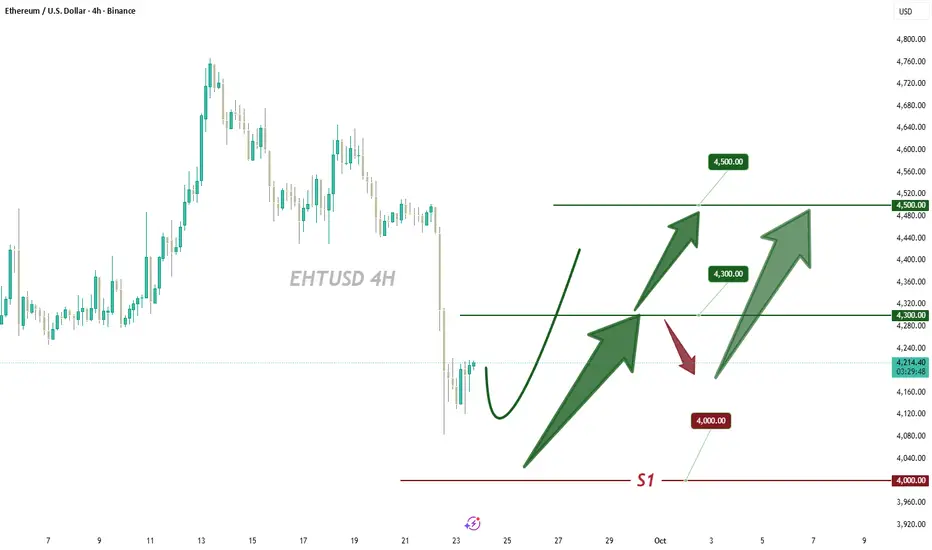
ETHEREUM HIGH PROBABILITY SETUP SOON!!!🚨 ETHER HIGH PROBABILITY SELL/BUY SETUP 🚨
* Here We Can See Clearly The Next Potential Moves For ETHUSD Coming Hours/Days.
* Keep Your Eyes Close On Your Trading Positions.
* Happy PIP Hunting Traders.
FXKILLA.

Ethereum (ETH/USD) – Bearish Rejection Expected from ResistanceHere’s a detailed technical analysis of your Ethereum (ETH/USD) 4H chart 👇
🔹 Chart Overview
Timeframe: 4H
Current Price: ≈ 3,983
Resistance Zone: 4,314 – 4,583
Target Level: 2,766
Pattern: Downward channel (bearish trend continuation)
🔹 Price Structure
Price is moving within a descending channel, meaning the overall trend remains bearish.
After touching the lower trendline, ETH rebounded and is now testing the upper channel resistance zone between 4,314–4,583.
🔹 Key Levels
Resistance Zone:
This zone is critical; it aligns with both the upper channel boundary and a prior supply zone.
If price gets rejected here → confirms continuation of downtrend.
Support / Target:
The projected target level is around 2,766.75, which aligns with the lower boundary extension of the channel.
🔹 Market Bias
As long as ETH stays below 4,314, the bearish sentiment dominates.
A clean break and close above 4,583 would invalidate the bearish setup and could shift sentiment bullish toward 4,800+.
🔹 Possible Scenarios
1. Bearish Scenario (High Probability):
ETH rejects from resistance zone (4,314–4,583).
Downward move continues toward 3,500 → 3,000 → final target 2,766.
2. Bullish Reversal (Low Probability unless breakout):
Strong breakout above 4,583 with volume.
Next resistance near 4,950–5,000.
🔹 Summary
📉 Trend: Bearish
⚠ Watch Zone: 4,314–4,583 (short opportunity if rejection forms)
🎯 Downside Target: 2,766
🔄 Invalidation: Break and close above 4,583

Hold 4000 Support, ETH Awaits ReboundETH has stabilized its downward trend . If the 4000 support level remains unbroken , we can continue to wait for a rebound 📈
Buy 4100 - 4150
TP 4250 - 4350 - 4450
Accurate signals are updated every day 📈 If you encounter any problems during trading, these signals can serve as your reliable guide 🧭 Feel free to refer to them! I sincerely hope they'll be of great help to you 🌟 👇
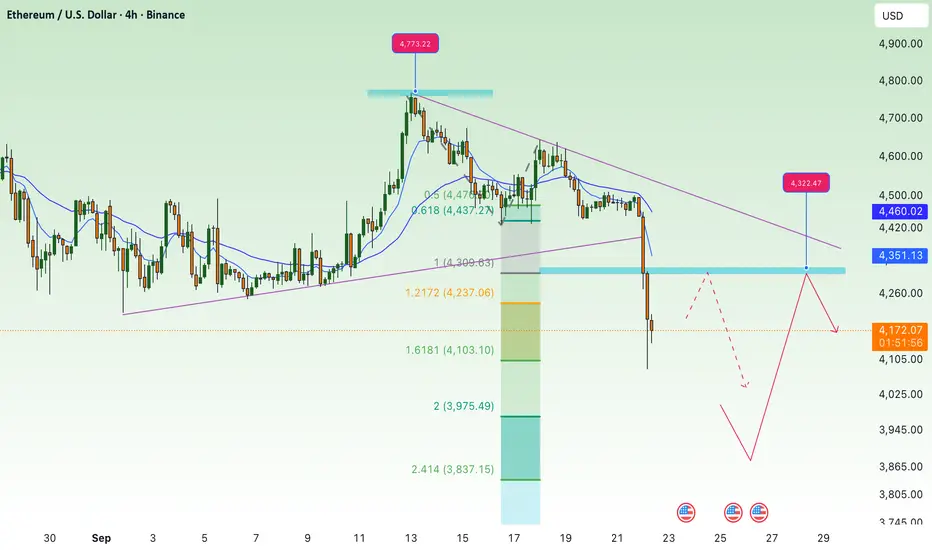
break support, continue to correct downETH 4H Chart Analysis
• Breakout Zone:
ETH has broken below the $4,360 – $4,330 zone (purple box), which previously served as strong support. This signals a shift in sentiment toward bearish momentum.
• Current Price Action:
After a sharp drop, ETH is consolidating around $4,170, hinting at a possible short-term rebound before continuing its downward structure.
• Resistance Levels:
• $4,360 – $4,330: Recently broken support, now acting as strong resistance.
• $4,505: Next resistance above, in line with prior range highs.
• Support Levels:
• $4,166: First Fib extension target, currently being tested.
• $3,880 – $3,900: Major support zone if price declines further (2.618 Fib extension + horizontal demand zone).
• Outlook:
ETH may retest the $4,330 – $4,360 resistance before continuing lower. If bearish pressure persists, the next downside target is around $3,880 – $3,900.
ETH/USD Bearish Reversal Setup – Targeting $1,470 After ResistanPair: Ethereum / U.S. Dollar (ETH/USD)
Exchange: Coinbase
Timeframe: 15 minutes
Indicators:
EMA 30 (red line): ~1635.82
EMA 200 (blue line): ~1585.79
🟣 Key Levels & Zones
Resistance Zone (Purple Rectangle Top): Around $1,647 – previously tested and rejected.
Support Zone (Purple Rectangle Bottom): Around $1,470 – marked as the "EATARGET POINT".
Current Price: ~$1,645
📉 Bearish Breakdown Setup
Chart Pattern: There’s a potential double top or distribution zone forming near the resistance.
Projection: The price is expected to break below the smaller support zone and drop to the target zone around $1,470.67, representing an 11.13% drop.
Measured Move Tool: Indicates a bearish price target if the price breaks down from the current consolidation.
✅ Confluence
Price is currently hovering under resistance.
EMAs show short-term bullish momentum but could flatten if breakdown confirms.
Support near $1,635 is being tested – a break below could trigger the expected drop.
⚠️ Trading Implications
Short Setup: A trader might look to enter short around $1,647 if breakdown confirmation occurs.
Stop Loss: Just above the resistance zone (~$1,650+).
Take Profit: Near $1,470 zone.

ETHUSD Market Analysis: Technical Indicators and Bearish SentimeAs of now, ETHUSD has dropped to $1,961, registering a daily decline of $94.9. Earlier, it exhibited robust upward momentum, surging past the $2,000 threshold. However, it has since experienced a pronounced downturn.
In terms of technical analysis, although the MACD doesn't clearly indicate a trend, its histogram has transitioned from positive to negative and is shrinking, suggesting that bullish strength is waning. The KDJ indicator, with a reading of 90, is in overbought territory. The 4 - hour candlestick chart reveals a substantial price drop relative to earlier levels. Even though the last candlestick is bullish, the overall market sentiment remains bearish.
Recently, trading volume has dwindled. The phenomenon of prices rising while volume falls indicates a significant weakening of upward momentum.
The market may be influenced by profit - taking from the previous rally, which has triggered a selling frenzy. Moreover, external factors like macroeconomic conditions and regulatory policies could also be at play. If key support levels, such as $1,874, fail to be reclaimed, bears are likely to retain their dominance. Investors should vigilantly monitor these support levels and prudently adjust their investment strategies.
ETHUSD
sell@1980-2000
tp:1900
buy@1850-1870
1930-1950
I will share trading signals every day. All the signals have been accurate for a whole month in a row. If you also need them, please click on the link below the article to obtain them.

The Forecast of ETHUSD TrendETH is currently hovering around $1,900. There is obvious resistance at $1,920 above, and $1,870 below is a key support level. If it breaks through the resistance, it is expected to reach for $2,000; if it falls below the support, it may drop to $1,850.
ETHUSD
sell@1920-1940
buy@1850-1870
I have been engaged in the trading field for nine years.
Up to now, the profit I have made has exceeded one million US dollars.
If you want to obtain professional guidance on trading trend analysis, trading strategy formulation, and risk management, please click on my profile.

ETHUSDT Bearish 1H TF Showing DivergenceETHUSDT showing a bearish momentum with divergence at 1H TF. A sell stop limit order is placed with two TP's. What do you think guys, will it work?

The Last Drop of ETHHello traders,
A one more drop is coming before creating a new high, ETH is setting up for a drop its showing me a lot of weakness on the weekly timeframe.
i am waiting for ethereum to drop and buy from the low price as much as possible, the price area that i am looking for is around 500 it will take time not a few days or few weeks analysis so patience is the key to succeed.
In the weekly timeframe price is formed head and shoulder pattern now price is going to retest that and drop from there, the area that i mentioned in the chart is around 500 to buy the ethereum for the long run, now ethereum is just going up and every one is wanted to enter in the market and try to make some profits but i am pretty much sure that this is going to be drop before creating a new high of all time and i am just basically waiting for that.
This is my analysis and view about ethereum.
This is just analysis, not the exact trade or any kind of signal that proven with wining or losing % so be sure trade with your own according strategy do not depend on my analysis.
I wish you good luck in trading.

ETH Short Going in for a short if eth can 1245 and will have a sl at 1300 if we lose 901 then we can see 490
Tp 1: 901
Tp 2: 490

ETHUSDSince eth lost the support of the .236 (1608.17) i will be look for a retracement to the area and i will get into short but it probably wont happen till this daily candle closes and the new daily candle should tap it

Learn Trading Setup in Ethereum chart!Hey all traders,
One of the good positions and setup for trading (in futures) is to enter after the channel lines (support and resistance lines ) have broken.
Here is an example of an Ethereum mini-channel on a 4-H timeframe.
A small uptrend channel in a very large downtrend channel, which we call a mini channel ( or Just I'm Call it ! ) anyway :-D
As long as the main channel (big downtrend channel) doesn't change its direction or the price chart does not cross the support and resistance lines of this channel (breaking the trend lines),
this trade and this setup are valid and active.
Below is a brief explanation of the entry and exit prices...
From up to Down
The Stop Loss is higher than the last week's highest price | $1728.00
Entry price is slightly below the minimum price of the chart, after breaking the trend line in the uptrend mini-channel | $1335.00
The last Target is $1150, which is equal to the Fibonacci 2 ratio in the daily time frame.
Good Luck
---------------------------------------------------------
Please write any advice or suggestions.
Dear friends, request any cryptocurrency pair, currencies pair for forex, and any index that you want to be analyzed and ask any questions.
Thanks for your attention

ETHUSD Idea H1Here is my view for ETHUSD on H1. The price could go down, you can put a pending order on the Order block or find an entry on LTF within OB Zone. Trade Safe!

ETHVery simple ... Very clear
A downtrend in the new step will start soon.
This is my personal opinion. Please do not trade based on my analysis and data.

Ethereum Idea H4This is my view for ETHUSD on H4. The price could go down, you can put a pending order on the Order block or find an entry on LTF within OB Zone. Trade Safe!

ETHUSD-SELLNo change in view.
On the 25th May and before I had suggested carefully we should be selling ETHUSD and we have broken the support line of a triangle @ 1,905. The objective is about $ 1,500 and we are well on the way.
For now remain short, or sell new @ 1,825-1,850 when seen. Profit order $ 1,500. for now.

ETHUSD-SELL strategyWe got a negative stoch RSI and we are near a support $ 1,905 of a half triangle.
I can't help thinking that we will break through the support and the objective would go somewhere $ 1,500.00 in the short-term. Strategy is SELL current @ 1,970-2,000 and take profit @ 1,575 for now.

ETHUSD-SELL strategyNo change in view.
We remain SELLER @ 1,980-2,050 for a move to $ 1,450 for now. Place a stop-loss above $ 2,350 for now.
The pattern seems to start breaking downward and stochastic is negative currently and quite high. This feels heavy and for that reason the suggested strategy.

ETHUSD-SELL strategyWe are trading below the cloud and along the don trend of it. It feels we may be breaking down sharply in the near future, providing we stay below $ 2,150 for now.
Strategy is SELL @ 1,940-1,980 and place a stop-loss above 2,150. Profit order 1,475 for now.

Ethereum Chart H1Here is my view for ETHUSD on H1. The price could go down, you can put a pending order on the Order block or find an entry on LTF within OB Zone. Trade Safe!

ETHUSD-SELL strategyUsing GOLD for showing correlation for the ETH movement. We are right now very correlated @ 0.90 and this suggest we should see pressure further on ETHUSD. Likely we will move towards a test of $ 1,750 before we may see some pause.
The overall view is we will decline further to $ 1,250 in the medium-term.

ETHUSD - Short Trade Idea - 3000 backETHUSD, Sell 15m
Entry - 3060.00
Stop Loss - 3082.00 (22 pips)
Take Profit - 2996.00 (64 pips)
