DeGRAM | ETHUSD confirmed the support line📊 Technical Analysis
● ETH/USD has completed a sharp corrective leg into the long-term descending support line near 2,200, where price shows stabilization after an impulsive sell-off. The reaction from this zone suggests seller exhaustion and a potential base formation.
● Despite the prevailing falling trend, the structure favors a rebound toward the descending resistance around 2,600–2,700, as prior breakdown levels act as magnets for corrective upside within a broader consolidation phase.
💡 Fundamental Analysis
● Medium-term expectations of easing financial conditions and continued Ethereum ecosystem development support a recovery scenario after the recent risk-off move.
✨ Summary
● ETH is holding a major descending support near 2,200.
● A corrective rebound toward 2,600–2,700 is favored while support holds.
-------------------
Share your opinion in the comments and support the idea with a like. Thanks for your support!
Ethusdsignal

DeGRAM | ETHUSD is under the $3000📊 Technical Analysis
● ETH/USD remains capped below a descending resistance line after failing to reclaim the prior distribution range near 3,400, confirming a broader bearish market structure.
● Price is compressing inside a narrowing consolidation near 3,000, with repeated rejections suggesting a bearish continuation toward the lower channel support around 2,800–2,530.
💡 Fundamental Analysis
● Elevated US yields and reduced risk appetite continue to pressure crypto assets, while the absence of strong bullish catalysts limits recovery attempts in ETH.
✨ Summary
● ETH trades under long-term resistance.
● Breakdown risk remains dominant below 3,100, targeting 2,800–2,530.
-------------------
Share your opinion in the comments and support the idea with a like. Thanks for your support!

DeGRAM | ETHUSD is preparing for a local pullback📊 Technical Analysis
● ETH/USD is testing the support line at $2,811.77 after a rejection from the resistance zone near $3,100.00.
● The price is forming higher lows above the support, suggesting a potential bullish continuation if it holds the current support levels.
💡 Fundamental Analysis
● Ethereum has seen increased network activity, with more decentralized applications (dApps) pushing the demand for ETH.
✨ Summary
● Key support is at $2,811.77, while resistance lies around $3,100.00. Look for a rebound off support for a short-term bullish move.
-------------------
Share your opinion in the comments and support the idea with a like. Thanks for your support!

DeGRAM | ETHUSD held the resistance area📊 Technical Analysis
● ETH/USD broke down from a rising channel after failing to hold the upper trendline, followed by a sharp impulsive sell-off that invalidated the prior bullish structure. The loss of the key resistance zone near 3,050–3,080 confirms a bearish shift in market control.
● Price is now testing a broader support cluster around 2,880–2,920, with lower highs and weak rebounds suggesting corrective bounces rather than reversal, opening risk toward 2,800 and below if support fails.
💡 Fundamental Analysis
● Ethereum remains pressured by overall crypto risk-off sentiment, firm USD conditions, and reduced speculative appetite, limiting upside flows into major altcoins.
✨ Summary
● Medium-term bearish bias. Resistance at 3,050–3,080, key support at 2,920. Breakdown favors continuation toward 2,800 while below former channel resistance.
-------------------
Share your opinion in the comments and support the idea with a like. Thanks for your support!

DeGRAM | ETHUSD broke out of the triangle📊 Technical Analysis
● ETH/USD is forming a long-term ascending base after the major low near ~$2,600, with price stabilizing along the rising support line and completing a broad consolidation triangle. The breakout from this formation suggests a potential trend change after the extended downtrend.
● The downward sloping resistance line from the 2025 highs provides the next objective. A reclaim above the ~$3,400–3,500 region would signal structural recovery and continuation toward higher long-term targets.
💡 Fundamental Analysis
● Ethereum’s fundamentals remain strong with continued network growth, increasing staking activity, and renewed institutional interest in ETH-related products, which supports a sustained long-term recovery narrative.
✨ Summary
● Long-term bullish bias. Support holds at the rising trendline. Key breakout region: ~$3,400–3,500. Targets above resistance line uphold continuation potential.
-------------------
Share your opinion in the comments and support the idea with a like. Thanks for your support!

DeGRAM | ETHUSD formed a rising bottom📊 Technical Analysis
● ETH/USD remains in a broader descending structure but has stabilized at the lower channel support near 2,850–2,900, where price formed a clear higher low. The reaction from this zone suggests seller exhaustion and medium-term base formation.
● Price is consolidating inside a rising micro-channel while holding above the support line. A sustained move above 3,050 would open room toward the descending resistance near 3,200–3,300, confirming a corrective bullish phase.
💡 Fundamental Analysis
● Ethereum is supported by improving risk sentiment and continued institutional interest in ETH infrastructure, while USD momentum remains mixed, allowing recovery setups in major crypto assets.
✨ Summary
● Medium-term long from channel support. Key support: 2,850–2,900. Targets: 3,200–3,300. Bullish structure weakens below 2,800.
-------------------
Share your opinion in the comments and support the idea with a like. Thanks for your support!

DeGRAM | ETHUSD fell under the $3k level📊 Technical Analysis
● ETH/USD remains in a dominant downtrend, forming a sequence of bearish continuation patterns: triangle, flag, and descending channels. Price consistently rejects the descending resistance line, confirming seller control.
● The recent channel breakdown points to renewed downside momentum, with price failing to hold above the mid-range and turning lower toward the key demand zone near 2,600.
💡 Fundamental Analysis
● Ethereum remains pressured by cautious risk sentiment and rotation out of altcoins, while tighter financial conditions continue to cap upside attempts across the crypto market.
✨ Summary
● Bearish structure intact. Resistance: 3,200–3,300. Downside target: 2,600 support zone. Trend remains negative below descending resistance.
-------------------
Share your opinion in the comments and support the idea with a like. Thanks for your support!

DeGRAM | ETHUSD is preparing to continue its rebound📊 Technical Analysis
● ETH broke out of a multi-week descending wedge and is now trending inside an ascending channel, confirming a structural reversal. A clean retest near 3,200 holds, opening room toward the 3,750–3,800 resistance zone.
● Rising swing lows and sustained momentum support continuation toward the upper boundary of the channel.
💡 Fundamental Analysis
● Recent ETF-driven inflows and improving risk appetite continue to support large-cap altcoins.
✨ Summary
● Long bias: holding 3,200 → targets 3,450 and 3,780.
-------------------
Share your opinion in the comments and support the idea with a like. Thanks for your support!

DeGRAM | ETHUSD will rebound from the $2800 level📊 Technical Analysis
● ETH/USD has broken above the long-term descending resistance line and is now retesting it while holding the higher-low structure near the 2,600–2,700 zone. This confirms a potential reversal from the extended corrective phase.
● Price is also rebounding from the lower boundary of the falling channel, with consolidation clusters suggesting accumulation before a move toward 3,300–3,400.
💡 Fundamental Analysis
● ETH sentiment strengthens as staking inflows rise and developers finalize key upgrades for 2026, while improved risk appetite supports large-cap crypto recovery.
✨ Summary
● Bullish bias above 2,650. Targets: 3,300 → 3,400. Support: 2,600. Resistance: 3,350.
-------------------
Share your opinion in the comments and support the idea with a like. Thanks for your support!

DeGRAM | ETHUSD held the $2800 level📊 Technical Analysis
● ETH/USD broke out of the falling channel after defending the major $2,700–$2,800 support zone, signalling a shift from corrective structure to early bullish momentum.
● Price is forming higher lows after the breakout and is positioned to retest the upper trendline near $3,100–$3,200 as long as the support zone continues to hold.
💡 Fundamental Analysis
● Crypto sentiment is stabilizing as risk assets rebound, while ETH benefits from renewed inflows into staking platforms and improving network activity, supporting a medium-term bullish outlook.
✨ Summary
● Bullish bias above $2,780. Targets: $3,050 → $3,180. Support: $2,700.
-------------------
Share your opinion in the comments and support the idea with a like. Thanks for your support!

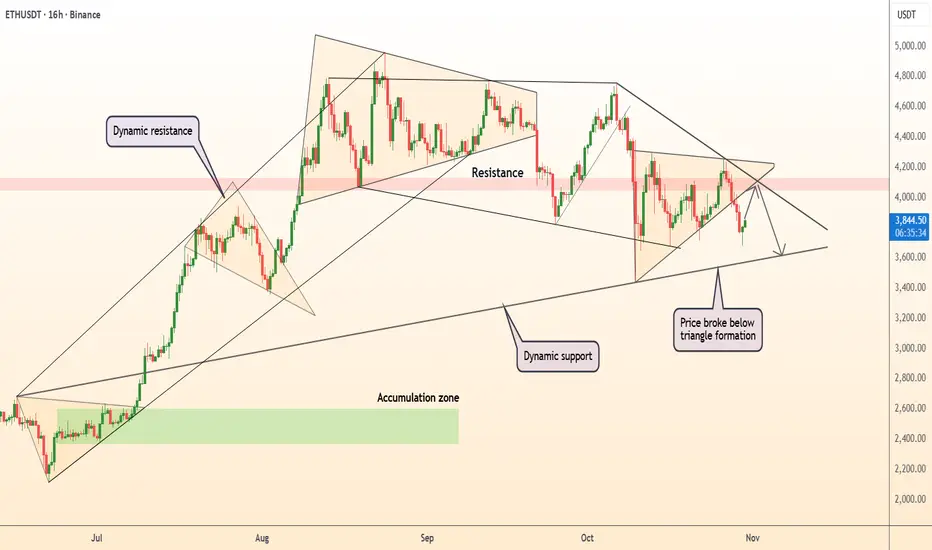
DeGRAM | ETHUSD will rebound from the support area📊 TECHNICAL ANALYSIS
● The chart shows Ethereum forming a broad symmetrical triangle (from June to Nov), with price currently near the lower trend-line support (approx $3 000) and facing a descending dynamic resistance line. A bounce at the support zone suggests buyers are stepping in.
● Price action indicates a test of the key accumulation zone around $3 000–$3 100 (green area). A successful rebound toward the descending resistance (~$3 600-3 800) and subsequent break could signal the start of the next upward leg (wave count suggesting completion of corrective triangle).
💡 FUNDAMENTAL ANALYSIS
● Despite recent weak sessions, the upcoming Fusaka upgrade (early Dec 2025) brings network improvements for Ethereum (lower fees, better scalability), which supports long-term bullish structure.
● Major institutional accumulation is shown by growing net supply increase (+18 262 ETH over one week) and large investors building positions, signalling underlying conviction even amid market pullback.
✨ SUMMARY
● Long bias: expect rebound from ~$3 000–$3 100 support zone.
● Key trigger: hold support + break above ~$3 600 resistance for continuation.
● Targets: initial move toward ~$3 600-$3 800, with broader potential beyond thereafter given upgrade tailwinds.
● Risk: if support fails (~$3 000), downside opens.
-------------------
Share your opinion in the comments and support the idea with a like. Thanks for your support!

DeGRAM | ETHUSD has consolidated below the mirror📊 Technical Analysis
● ETH/USD is testing the broken dynamic support line, which now acts as resistance near $3,600. This retest aligns with the descending channel structure, confirming the dominance of sellers.
● A rejection from this level could lead to a continuation toward the $3,200–$3,100 support zone, coinciding with the previous accumulation area visible from July.
💡 Fundamental Analysis
● Ethereum faces mild pressure as risk appetite fades amid uncertainty over upcoming U.S. economic data and delayed ETF approvals, dampening short-term demand.
✨ Summary
● Resistance: $3,600. Support: $3,200. ETH remains bearish while below resistance, with potential continuation toward the next support zone.
-------------------
Share your opinion in the comments and support the idea with a like. Thanks for your support!

DeGRAM | ETHUSD held the $3000 level📊 Technical Analysis
● ETH/USD broke out of a consolidation range and is now testing the dynamic resistance line, indicating a potential retest of the $3,500 resistance level. The market recently rebounded from $3,000 support, showing signs of upward momentum.
● The price action respects a rising channel, which could suggest further bullish continuation if the dynamic support holds.
💡 Fundamental Analysis
● The broader crypto market sentiment remains positive, with growing institutional adoption and decreasing selling pressure.
✨ Summary
● Watch for resistance around $3,500 and support at $3,000. A breakout above $3,500 could target $3,800.
-------------------
Share your opinion in the comments and support the idea with a like. Thanks for your support!

DeGRAM | ETHUSD formed a triangle📊 Technical Analysis
● ETH/USD broke below a triangle formation, confirming a bearish continuation from the dynamic resistance area near $4,200.
● Price action suggests a potential move toward the $3,600–$3,500 zone, aligning with the next dynamic support and continuation of the corrective structure from September highs.
💡 Fundamental Analysis
● Ethereum faces downside pressure as on-chain activity slows and ETF speculation cools amid risk-off sentiment in broader markets.
✨ Summary
● Short bias below $4,200; targets $3,600–$3,500. Breakout and weakening fundamentals support medium-term bearish momentum.
-------------------
Share your opinion in the comments and support the idea with a like. Thanks for your support!
DeGRAM | ETHUSD is above the support area📊 Technical Analysis
● ETH/USD broke above its descending resistance line and retested the 4,000 support zone, confirming a breakout from a medium-term accumulation structure.
● The price now targets 4,300 as the next resistance, with ascending channel dynamics supporting continued bullish momentum.
💡 Fundamental Analysis
● Ethereum gains traction amid rising DeFi activity and institutional accumulation, while stable macro sentiment boosts broader crypto risk appetite.
✨ Summary
● Long bias above 4,000; targets 4,300. Breakout confirmation and improving fundamentals support medium-term upside.
-------------------
Share your opinion in the comments and support the idea with a like. Thanks for your support!
DeGRAM | ETHUSD is correcting📊 Technical Analysis
● ETH/USD remains in a broad ascending channel but is now testing its mid-range support near 3,900 after multiple rejections from the upper resistance line.
● A breakdown below 3,800 may trigger a move toward 3,380, aligning with the lower boundary of the long-term channel and completing a corrective wave.
💡 Fundamental Analysis
● Ethereum’s price faces pressure amid slower network activity and rising competition from L2 ecosystems, while macro uncertainty weighs on crypto sentiment.
✨ Summary
● Short bias below 3,900; targets 3,380. Structural breakdowns and weaker fundamentals point to a medium-term retracement phase.
-------------------
Share your opinion in the comments and support the idea with a like. Thanks for your support!
DeGRAM | ETHUSD fixed above the support line📊 Technical Analysis
● ETH/USD is forming a recovery structure after rebounding from the dynamic support near 3,930, showing higher lows that confirm renewed buyer control.
● Price is expected to advance toward 4,350–4,400, where the dynamic resistance line intersects, marking the next key breakout zone for continuation.
💡 Fundamental Analysis
● Ethereum gains support as network activity and L2 adoption rise, while investor sentiment improves following a decline in gas fees and strong DeFi flows.
✨ Summary
● Long bias above 3,930; objectives 4,350–4,400. Technical recovery aligns with improving network fundamentals and risk-on crypto sentiment.
-------------------
Share your opinion in the comments and support the idea with a like. Thanks for your support!
DeGRAM | ETHUSD above the $4000 level📊 Technical Analysis
● ETH/USD is holding above dynamic support near 3,870 after a deep pullback, forming a structure of higher lows that signals potential recovery.
● Price aims toward 4,300 as it approaches dynamic resistance; a breakout could extend toward the 4,880 level within the medium-term bullish channel.
💡 Fundamental Analysis
● Ethereum sentiment improves amid rising network activity and positive institutional flows into ETH-based ETFs.
✨ Summary
● Long bias above 3,870; targets 4,300–4,880. Technical rebound aligns with strengthening on-chain and macro sentiment.
-------------------
Share your opinion in the comments and support the idea with a like. Thanks for your support!

DeGRAM | ETHUSD is preparing to refresh ATH📊 Technical Analysis
● ETH/USD is trading within a broad ascending channel, recently breaking above the consolidation pattern that formed from August to September. The price has reclaimed the mid-channel and is approaching the key $4800 resistance.
● Sustained momentum above $4800 would validate a bullish continuation toward the $5500 upper boundary, supported by the ascending support line that has held since early 2025.
💡 Fundamental Analysis
● Ethereum’s network activity is recovering as institutional demand for ETH staking grows and Layer-2 adoption increases, reinforcing the bullish mid-term outlook.
✨ Summary
● Breakout above $4800 opens the path to $5500. Channel structure and improving fundamentals favor continued upside momentum.
-------------------
Share your opinion in the comments and support the idea with a like. Thanks for your support!

DeGRAM | ETHUSD will retest the support level📊 Technical Analysis
● ETH/USD bounced from the 4,000 support zone after a false break, confirming strong demand and the validity of the long-term ascending channel.
● Price structure suggests potential upside with targets toward 4,950 resistance, supported by rejection wicks and consolidation above 3,920.
💡 Fundamental Analysis
● Ethereum’s momentum is fueled by rising institutional flows and expectations of ETH ETF approvals, strengthening medium-term bullish sentiment.
✨ Summary
ETH/USD holds above 4,000 with bullish recovery signals. Key support lies at 3,920, while upside targets remain 4,950. Momentum favors buyers in the medium term.
-------------------
Share your opinion in the comments and support the idea with a like. Thanks for your support!

#ETHUSDT (4H Chart)#ETHUSDT
(4H Chart)
🔹️ Ethereum Analysis 🔹️
For Ethereum, we have two important resistance levels that could lead to a significant correction:
🔴 Resistances (marked with red boxes):
🎯 First range: 4260 to 4352 USD
🎯 Second range: 4550 to 4635 USD
Supports:
🟡 Yellow box (short-term support): 3525 to 3445 USD — likely to be touched if Bitcoin reaches 100,000 USD
🟢 Green box (main support): 2800 to 2700 USD
💡 Summary:
We expect a small initial rise, then a correction down to the yellow box, and after the yellow box is touched, this analysis will be updated.
🚀 If you enjoyed this analysis, please give it a boost 💙
And to not miss any new analyses or setups, make sure to follow me 📊
🆔️ @Rasoolahmadi

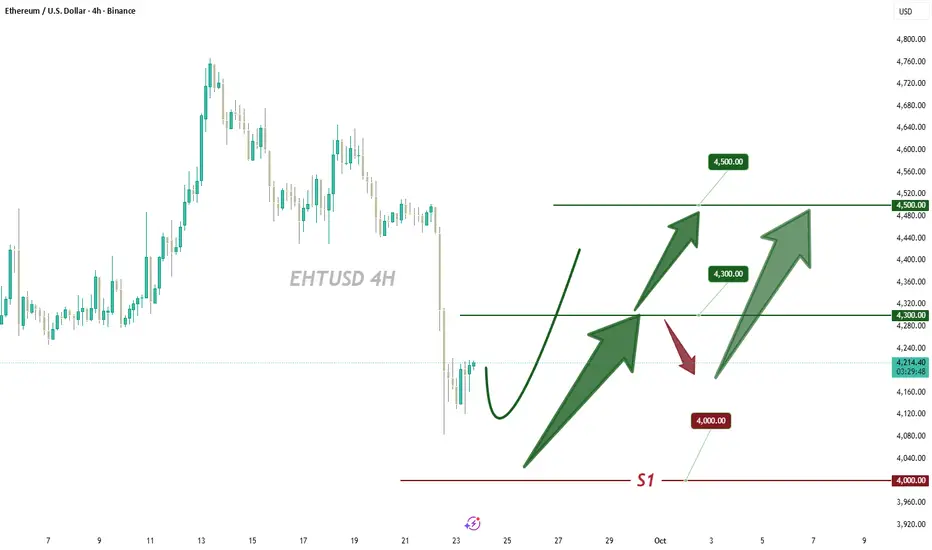
Hold 4000 Support, ETH Awaits ReboundETH has stabilized its downward trend . If the 4000 support level remains unbroken , we can continue to wait for a rebound 📈
Buy 4100 - 4150
TP 4250 - 4350 - 4450
Accurate signals are updated every day 📈 If you encounter any problems during trading, these signals can serve as your reliable guide 🧭 Feel free to refer to them! I sincerely hope they'll be of great help to you 🌟 👇
DeGRAM | ETHUSD is consolidating📊 Technical Analysis
● ETH/USD is consolidating near $4,450 inside a rising channel, with support anchored at $4,187; holding this zone keeps bullish structure intact.
● The price is coiling below resistance at $5,131, and sustained momentum could trigger an upside breakout targeting $5,500 in the medium term.
💡 Fundamental Analysis
● Recent ETH ETF inflows surpassed $1.2B in August, while Ethereum’s staking ratio hit record highs above 27%, reducing liquid supply and reinforcing long-term bullish pressure.
✨ Summary
Bullish above $4,187; targets $5,131 → $5,500. Invalidation below $4,100.
-------------------
Share your opinion in the comments and support the idea with like. Thanks for your support!
