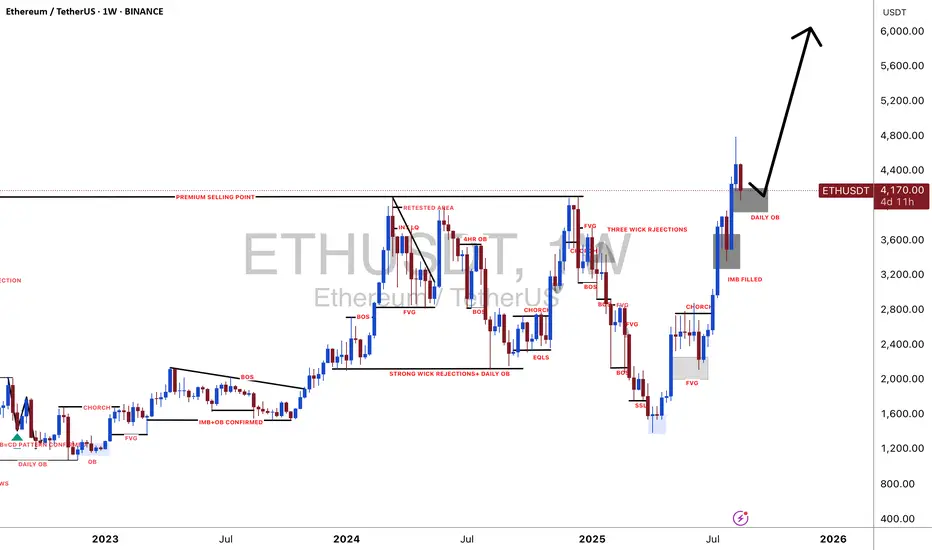
ETH About to Explode or Collapse?Yello Paradisers! Are you prepared for what’s coming next on ETHUSD? Because right now, Ethereum is sitting on the edge of a critical structure that could lead to a major breakout—or trap unsuspecting traders in another fake move. The setup is developing quickly, and what happens next will determine the short-term direction in a big way.
💎ETHUSD is currently forming a textbook falling wedge pattern, a structure often seen at the end of corrective phases and typically followed by strong bullish breakouts. What adds more weight to this scenario is the clear bullish divergence forming on both the MACD histogram and the Stochastic RSI. These indicators suggest that bearish momentum is weakening and bulls may be getting ready to take control.
💎For traders who prefer confirmation, the ideal move is to wait for a decisive breakout above the wedge. That would significantly increase the probability of a sustained bullish move and reduce the risk of being caught in a fakeout. However, for more aggressive traders, there may already be a reason to act. A bullish engulfing candle has formed directly at a key support level—an early signal that buyers are starting to step in with strength.
💎That said, we cannot ignore the invalidation scenario. If the price breaks down and closes candle below the defined invalidation level, the entire bullish outlook will be off the table. In that case, it will be crucial to stay patient and wait for a clearer price action setup to form before considering new positions.
Strive for consistency, not quick profits. Treat the market as a businessman, not as a gambler.
MyCryptoParadise
iFeel the success🌴
Ethusdtanalysis
ETHUSDT: First Drop To $2100 And Bounce Up To $6500ETHUSDT is dropping nicely and we expect a smooth reversal around $2200. This area looks promising due to the significant volume sitting there. We just need to avoid liquidation. Once the entry is active, you can enter with strict risk management and set multiple take profit levels. This analysis is suitable for all traders from intraday to swing.
Good luck and feel free to like and comment for more!
Team Setupsfx_
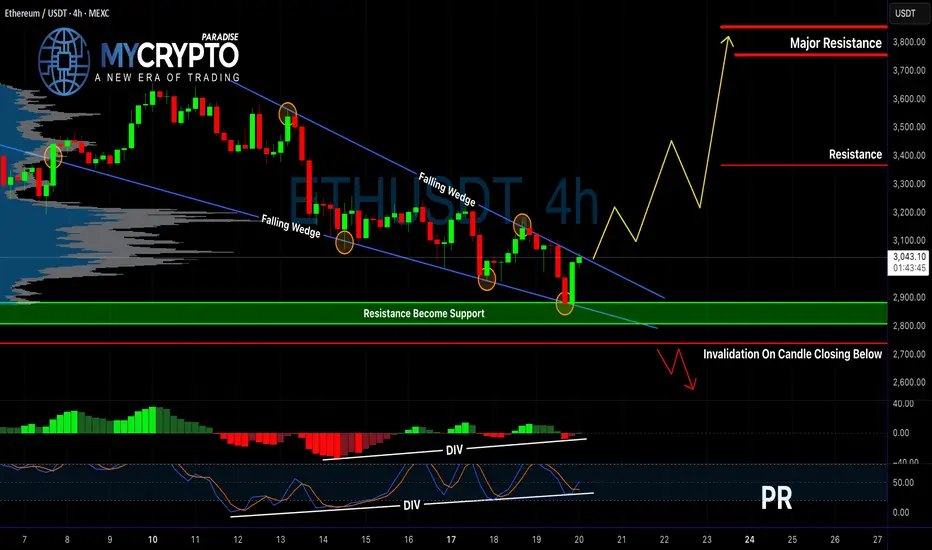
ETH/USDT: Bullish Breakout to $3740?BINANCE:ETHUSDT is setting up for a potential bullish breakout on the 4-hour chart , where price has formed a higher low while testing a downward trendline, converging near the good entry zone at cumulative short liquidation levels—suggesting buyers could trigger a squeeze if support holds, aiming for higher resistances. This position carries high risk, so always prioritize strict risk and capital management to avoid significant losses in volatile crypto markets.
Entry between $3370-$3417 . Target at $3740 in the take profit zone. Set a stop loss on a close below $3320 to mitigate downside. 🌟 Look for confirmation with a bullish close above the entry and surging volume, riding Ethereum's momentum amid broader crypto trends.
📝 Trade Setup:
🎯 Entry Zone: $3,370 – $3,417
💰 Target: $3,740 (Take-Profit Zone)
❌ Stop Loss: Close below $3,320
⚖️ Risk-to-Reward: Approximately 1:3, depending on entry execution and volatility
⚠️ This remains a high-risk trade setup — strict risk and capital management are essential in volatile crypto conditions.
What's your view on this high-risk setup? Drop your thoughts below! 👇

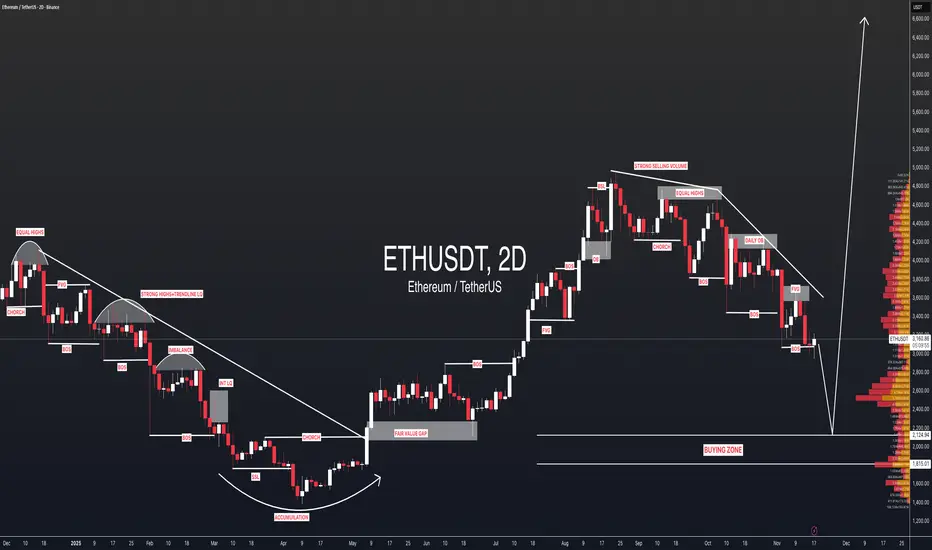
#ETHUSDT: Fill The Gap At $3200, Target At $6000 The significant price gap has been closed and the market is now in correction mode. We anticipate a further decline of approximately $3200 which remains a key support level for buyers. Our next step is to observe the market’s reaction and remain patient.
Please note that this is not a guarantee and you should always conduct your own research before making any significant investment decisions.
Best regards,
Team Setupsfx
ETHUSDT – Reclaiming Liquidity Zone, Eyeing Supply TestETH successfully closed above the $3,350 liquidity area on both the 3D and weekly timeframe, confirming a clean liquidity sweep and reclaim. This type of move often signals the start of a bullish rebound, which we’ve already seen with ETH recovering strongly over the weekend.
Currently, price is likely heading toward the supply zone between $3,930 – $3,795, where we should monitor the reaction closely. A rejection from this zone could trigger a short-term pullback, potentially revisiting the $3,350 support area once again. However, if ETH manages to break and close above this supply, the next major challenge will be the key resistance near $4,089, a crucial level before retesting the All-Time High (ATH) region.
On the flip side, the bearish scenario would be a weekly close below $3,350, opening the door for a deeper retracement toward the Monthly Order Block (OB) zone around $2,878 – $2,125. This could unfold if Bitcoin also drops below the $100K level, reinforcing broader market weakness.

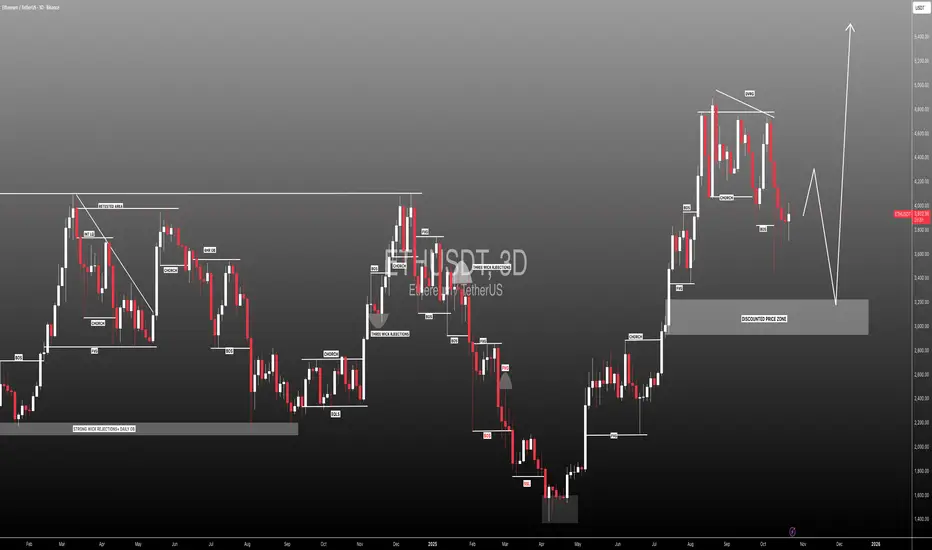
ETH/USDT — Golden Zone: Major Reversal or Deeper Correction!The 1W chart of Ethereum (ETH/USDT) displays a clear Elliott Wave impulsive structure, with the price currently moving within Wave (4) — a corrective phase that often determines whether the main trend will continue or reverse.
The 3,630–3,200 USDT yellow zone acts as a critical battleground where long-term buyers and short-term sellers collide. This zone will define whether Ethereum is preparing for its next major rally or entering a prolonged correction.
---
Structure and Key Pattern
Elliott Wave Count: Waves (1), (2), and (3) are complete; price is now in Wave (4), which typically precedes the final impulsive move (5) if the structure remains valid.
Golden Pocket Zone (0.5–0.618 Fib): The range between 3,630–3,200 is the golden retracement zone — a region where high-probability reversals often form.
Historical Flip Zone: This same area served as a major resistance during 2021–2022 and now acts as structural support, making it an extremely important pivot level.
Volume Profile: Historically, this zone attracts accumulation before a large breakout, indicating potential institutional interest.
---
Bullish Scenario — The Start of Wave (5)
If Ethereum holds above the yellow zone and prints a strong reaction, the structure supports a continuation rally toward new highs as Wave (5) develops.
Bullish Triggers
1. Strong rejection candles (e.g., long lower wick or bullish engulfing) from 3.2–3.6k zone.
2. Confirmation occurs once price reclaims 4.1k and breaks above 4.7k with weekly close.
3. First target: 4.95k (previous ATH resistance).
4. Extended targets: If momentum is strong, Fibonacci extensions point toward 6k–9k zones — marking the full completion of Wave (5).
5. Increasing weekly volume during breakout strengthens the bullish continuation signal.
> Bullish Summary:
As long as price stays above 3,200, the impulsive Elliott structure remains intact — making this zone a potential launchpad for the next major Ethereum rally.
---
Bearish Scenario — Breakdown and Deeper Correction
If price fails to hold the 3,200 support and breaks below, the impulsive structure will be invalidated, signaling a possible larger corrective phase (A–B–C).
Bearish Triggers
1. Weekly close below 3,200 confirms support breakdown.
2. Next target would be ~2,700 USDT — the next key support zone.
3. If bearish momentum continues, the price could extend lower toward 1,700–900 USDT (0.786–0.886 retracement).
4. The structure then transitions from an impulsive rally into a corrective macro phase, indicating that the larger bullish wave is temporarily over.
> Bearish Summary:
A weekly close below 3,200 signals structural failure and the start of a long-term distribution or deeper correction phase before forming a new accumulation base below 3k.
---
Visual Interpretation
5-Wave Impulsive Pattern: Indicates that the macro trend remains bullish until 3,200 breaks.
Yellow Zone = Decision Point: This “golden battlefield” determines whether Ethereum resumes its major uptrend or shifts into correction.
If strong bounce occurs, a parabolic Wave (5) could unfold — usually accompanied by extreme optimism and renewed market euphoria.
---
Trading Strategy & Risk Management
Use weekly timeframe for structural confirmation; use daily for precise entries.
Scaling strategy: Gradually build positions within 3.63–3.2k zone; add more upon bullish weekly close.
Stop-loss: Below 3.1k to protect structure integrity.
Conservative approach: Wait for breakout above 4.7k before confirming trend continuation.
Keep an eye on macro news and Ethereum ecosystem updates, which could add volatility beyond technical patterns.
---
Final Takeaway
> Ethereum stands at its Golden Crossroads — between renewal and decline.
If the 3.630–3.200 zone holds, ETH could ignite Wave (5) and push toward new all-time highs (6k–9k).
But if it breaks, the market might enter a deep corrective phase lasting months.
This zone will likely decide Ethereum’s direction for the next 6–12 months.
#Ethereum #ETHUSDT #CryptoTA #ElliottWave #CryptoAnalysis #TechnicalAnalysis #ETHPrice #Fibonacci #CryptoTrading #BullishScenario #BearishScenario #CryptoInvesting

Ethereum (ETHUSDT, 1D) – Key Reversal Zone: Two Scenarios Ahead#Ethereum (#ETHUSDT, 1D) – Key Reversal Zone: Two Scenarios Ahead
Current price: $4,157
Ethereum is approaching a key decision zone within a broad consolidation structure. The current pattern allows for two potential outcomes — bullish continuation or renewed correction — both aligned with mid-term Fibonacci dynamics.
🧩 Technical Overview
• Price rebounded strongly from the $3,620–$3,660 zone, breaking above short-term resistance near $4,100.
• ETH is now testing a confluence area between the descending trendline and the 0.236 Fib retracement of the previous leg.
• The reaction from this area will define whether the market resumes the uptrend or returns to deeper correction.
🟡 Bullish Scenario
• Structure suggests a potential breakout and continuation toward higher Fibonacci extensions.
• Key levels to watch:
– $4,284–$4,290 — breakout confirmation zone
– $4,450–$4,460 — intermediate resistance / local target
– $4,820–$4,850 — main upside target (1.618 Fib extension)
• Break and close above $4,290 would validate continuation toward $4,820+ in the coming sessions.
⚪ Bearish Scenario
• Failure to hold above $4,100 may trigger renewed selling pressure.
• Key levels below:
– $3,700 — first support / short-term pivot
– $3,440–$3,270 — mid-term correction zone
– $3,260 — key structural support; break below would confirm full retracement.
• A daily close below $3,700 reopens downside risk toward the lower Fibonacci levels.
⚙️ Market Context
• ETH remains sensitive to broader crypto sentiment, mirroring BTC’s consolidation near $110K.
• Market structure shows balanced positioning — both bulls and bears waiting for confirmation at the trendline.
• Directional breakout from current levels will likely define the next medium-term leg.
🧭 Summary
Ethereum is consolidating near a major inflection point.
• Bullish path: breakout above $4,290 → targets at $4,450 and $4,820.
• Bearish path: failure below $4,100 → pullback toward $3,700–$3,260.
Until confirmation occurs, ETH remains neutral-bullish, trading within a breakout-preparation phase.

Ethereum Technical Map – Bulls Leading the Charge!🎯 ETH/USDT: The Gentleman Thief's Swing Play | 3600→4350 Target 🚀
📊 MARKET OVERVIEW
Asset: ETHEREUM/TETHER (ETH/USDT)
Timeframe: Swing/Day Trade
Bias: 🐂 BULLISH
Strategy Type: Wealth Accumulation Map
🎭 THE SETUP (A.K.A. "THE HEIST PLAN")
🟢 ENTRY ZONE
Flexible Entry: Any current price level accepted
Translation: We're not picky—grab your ticket to the moon wherever you are!
🛑 STOP LOSS (THE "THIEF'S INSURANCE")
SL: $3,600
⚠️ Important Note for OG Thieves:
Listen up, Ladies & Gentlemen! This is MY stop loss level, not a divine commandment. You've got your own vault to protect—set YOUR stop loss based on YOUR risk appetite. Your money, your rules, your responsibility. Don't blame me if you ignore risk management! 💼
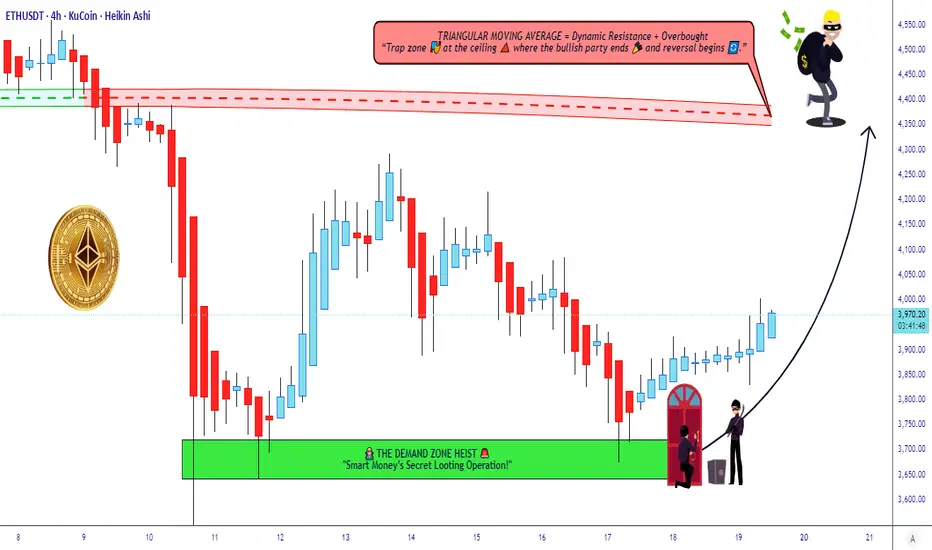
🎯 TAKE PROFIT TARGET
TP: $4,350
📍 Technical Confluence:
Triangular Moving Average acting as strong resistance
Overbought conditions developing
Potential bull trap zone forming
⚠️ Another Friendly Reminder:
Dear OG Thieves, this is MY target—not financial advice carved in stone! Scale out, take profits along the way, or let it ride. YOU decide when to count your loot. Exit strategy is YOUR masterpiece! 🎨
🔍 KEY TECHNICAL LEVELS
Resistance Zones:
Primary: $4,350 (TMA + Overbought)
Watch for rejection wicks at this level
Support Foundation:
$3,600 (Our safety net)
Strategy:
Classic "buy the dip, sell the rip" with proper risk management. We're riding the wave, not fighting the tide! 🌊
👀 RELATED PAIRS TO WATCH
Correlated Assets:
BTC/USDT ( CRYPTOCAP:BTC ) - King leads, ETH follows (usually)
SOL/USDT ( CRYPTOCAP:SOL ) - Alt season companion
MATIC/USDT ( SEED_DONKEYDAN_MARKET_CAP:MATIC ) - Ethereum ecosystem play
BNB/USDT ( CRYPTOCAP:BNB ) - Exchange token correlation
AVAX/USDT ( CRYPTOCAP:AVAX ) - Smart contract platform peer
💡 Correlation Notes:
When BTC pumps, ETH typically follows with stronger percentage moves. Watch Bitcoin dominance—if it drops while BTC rises, expect explosive alt season momentum. SOL and AVAX often move in tandem with ETH as the "Layer 1 trio."
⚙️ RISK MANAGEMENT (THE GENTLEMAN'S CODE)
✅ Never risk more than 1-2% of portfolio per trade
✅ Consider partial profit-taking at resistance levels
✅ Trail your stop loss as price advances
✅ Don't marry your position—take the money and run when it's time! 💰
🎩 FINAL WORDS FROM YOUR FRIENDLY NEIGHBORHOOD CHART THIEF
This analysis combines technical indicators, market structure, and a healthy dose of swagger. Remember: The market doesn't care about your feelings, your bills, or your dreams. Protect your capital like it's the Crown Jewels! 👑
Trade smart, stay humble, and may the pips be ever in your favor! 🎲
✨ If you find value in my analysis, a 👍 and 🚀 boost is much appreciated — it helps me share more setups with the community!
#ETHUSDT #Ethereum #CryptoTrading #SwingTrading #DayTrading #TechnicalAnalysis #CryptoTA #ETHUSD #AltcoinTrading #CryptoStrategy #TradingIdeas #CryptoSignals #BullishSetup #RiskManagement #TradingView #ETH #Cryptocurrency #DigitalAssets #CryptoMarket #TradingCommunity
📈 Chart Analysis | 🎯 Swing Trading | 💎 Crypto Markets | 🚀 To The Moon
Etherium to 7500Right now BINANCE:ETHUSDT is just barely holding above 3500 area which is a good sign and showing it's potential to break ATH. But remember 3500 is not that major support, so it may break this support area and look for major support zone which is around 2100-2600 area. That would be a perfect opportunity enter long position on BINANCE:ETHUSDT , or maybe buy on spot. It can also fakeout 3500 area and go up. And also there is a obvious triangle pattern appeared in 1W timeframe which is a very good sign to go up in my opinion. Our first target will be 7500 and then 10k, 12k, 15k. So time will tell.

#ETHUSDT: First Drop And Then Launch To $5500! ETHUSDT we believe the price will initially decline before launching from the $3000 price region. This area appears more promising and could function as a discounted price zone. Three target levels are suggested below:
* **First target:** $4000. This area presents a minor resistance level, and closing 25% of positions is ideal.
* **Second target:** $4500. This is the second major resistance level, and closing another 25% of positions is recommended.
* **Final target:** $5500. This is our swing target. If the price reaches this level, it could be a suitable area to initiate a swing sell and the commencement of a major bearish move.
Please share your thoughts.
Team Setupsfx_
ETHUSDT – Bearish Continuation StructureEthereum #ETHUSDT – Bearish Continuation Structure
Current price: $3,827
Ethereum continues to trade within a descending channel, showing a clear pattern of lower highs and lower lows. The structure indicates potential for further downside extension before any meaningful recovery phase.
🧩 Technical Overview
• Price was rejected from the $4,120 resistance zone, confirming the upper boundary of the descending channel.
• The market failed to sustain above the $3,900 pivot and has since broken below the short-term trendline.
• Momentum remains weak, with sellers controlling the mid-term structure.
📉 Scenario
• The current move is likely part of a continuation correction, targeting deeper Fibonacci zones.
• Stop-loss: above $4,120, protecting against false breakouts.
• Downside zones to watch:
– $3,620–$3,440 — near 0.618 Fib / initial target area
– $3,260 — main support and prior reaction zone
– $2,900–$2,570 — extended targets aligning with 1.0–1.618 Fib projections
– $2,050–$2,000 — deep-cycle target (2.618 Fib extension)
• A break below $3,620 would confirm acceleration toward the lower targets.
⚙️ Market Context
• ETH underperforms BTC as capital rotation favors defensive positioning.
• Broader crypto sentiment remains cautious amid risk-off macro environment.
• The structure remains bearish unless ETH reclaims $3,900–$4,100 with strong momentum.
🧭 Summary
Ethereum is holding below key resistance and continues to follow a bearish channel structure.
Below $4,120, short-term bias remains downward, with focus on $3,440, $3,260, and $2,900 as successive support levels.
Reclaiming the $4,000 area would be the first sign of potential trend reversal — until then, the path of least resistance remains to the downside.

ETHUSDT: Possible Minor to Major Corrections May HappenETHUSDT has a higher chance of experiencing a minor or major correction in the coming days, although we haven’t confirmed this yet. We need more confirmation before we can be certain about the future of ETH. However, if the price decides to undergo a major correction, it’s likely to drop to our second area, where it’s expected to fill the liquidity gap and then reverse, continuing towards our three targets.
Please use this analysis as secondary bias only or even only for educational purposes. Always conduct your own analysis and risk management before trading or investing in cryptocurrencies, as they carry significant financial risk. Good luck and trade safely.
If you want to support us, you can do so by liking the idea, commenting with your views, or sharing it.
Much love ❤️
Have a great weekend
Team Setupsfx_

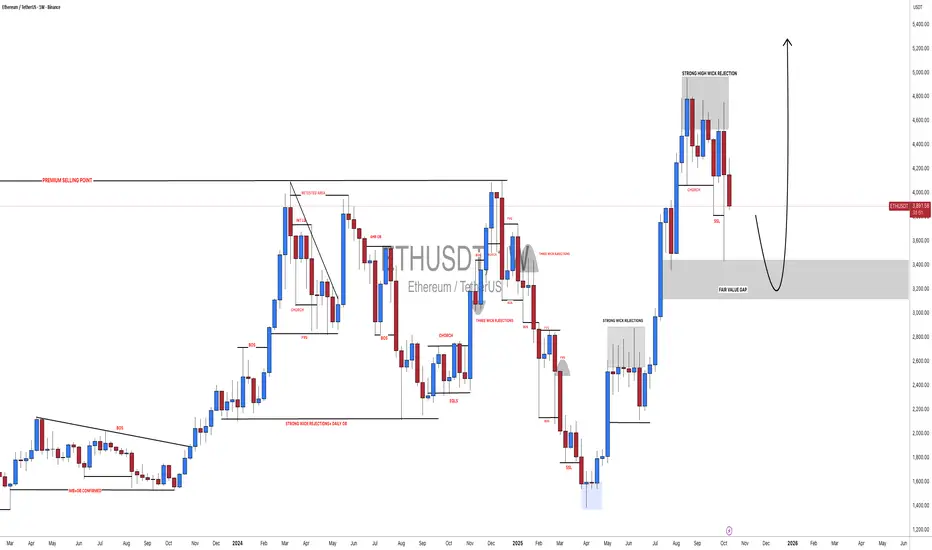
#ETHUSDT: Currently On The Way Towards Filling The FVG?ETCUSDT is currently experiencing a significant correction as the price approaches a pivotal juncture where a substantial bullish price reversal is anticipated, potentially propelling it to new all-time highs or even surpassing them. It is imperative to exercise meticulous risk management and conduct your own thorough analysis before engaging in any cryptocurrency trading or investment activities.
Should the price indeed undergo a major correction, it is likely to decline to our second designated area, where it is anticipated to fill the liquidity gap and subsequently reverse course, continuing its trajectory towards our established targets.
Please consider this analysis as a secondary influence only, or even solely for educational purposes. It is crucial to conduct your own independent analysis and risk management prior to engaging in any cryptocurrency trading or investment endeavours, as they inherently carry substantial financial risks.
We extend our best wishes and encourage you to trade safely and responsibly.
Should you wish to demonstrate your support, you are welcome to express your appreciation through likes, comments, or sharing this information.
Thank you for your consideration.
Have a pleasant weekend.
Team Setupsfx_

ETH/USDT Bearish Continuation from Supply Zonea bearish continuation setup on Ethereum (ETH/USDT) in the 4-hour timeframe. After a strong downward impulse, the price retraced into a highlighted supply zone, suggesting a potential rejection from this resistance area. The projection shows a likely continuation of the downtrend, targeting the 3,797.51 level, with a Stop Loss positioned above the recent swing high around 4,303.62.

Ethereum broke below the key $4,500 levelEthereum broke below the key $4,500 level
Market Overview
Altcoins appear poised for a significant breakout as market dominance gradually shifts away from Bitcoin. The Altseason Index continues to rise, signaling that a broader altcoin rally may be approaching once again.
Ethereum Market Update
Ethereum (ETH) has declined by 3.6% in the past 24 hours, breaking below the key $4,500 level. Despite this drop, current metrics suggest the move is part of a healthy market correction rather than a structural breakdown.
The correction has triggered notable withdrawals from staking pools, reflecting temporary uncertainty among holders seeking to realize profits.
Technically, ETH has tested local support at $4,330 and is showing early signs of stabilization. The RSI is near oversold territory, suggesting that selling pressure may be easing. If the price holds above this support, a potential rebound toward the $4,500–$4,760 resistance zone could follow. However, a close below $4,330 might expose ETH to deeper retracements.
Development & Ecosystem News
Ethereum co-founder Vitalik Buterin has voiced support for Kohaku’s zk-based privacy roadmap, calling it a positive step toward strengthening privacy and security across the Ethereum ecosystem.
In a post on X, Buterin emphasized that achieving full-stack privacy and data protection remains one of Ethereum’s core objectives.
Kohaku — a fork of Ambire — integrates zk-based protocols such as Railgun, designed to reduce on-chain transparency risks and encourage privacy-first wallet development. A working prototype of Kohaku will be showcased at the upcoming Ethereum Foundation Devcon, and its open-source codebase will be available for developers worldwide to build upon.

Ethereum slides below $4,750 Ethereum slides below $4,750
Canary Capital has filed to launch spot ETFs for Litecoin (LTCC) and Hedera (HBR), each carrying a 0.95% management fee. Analysts say the products appear ready for approval, but the ongoing U.S. government shutdown has paused SEC activity, delaying reviews until late October.
The firm’s filings also outline enhanced access controls for users of Bitcoin and Ethereum, signaling broader integration within regulated crypto markets. Experts suggest the move could boost interest in altcoins once operations resume.
Meanwhile, Ethereum faces heavy validator outflows, with over 2.4 million ETH (≈$10B) awaiting withdrawal — the largest on record. Despite this, institutional demand remains strong, and Grayscale’s newly approved Ethereum Trust ETF with staking has been viewed as a bullish development for ETH and the broader crypto market.

ETHUSDT price have strong resistenceRight now, Ethereum is at the third touch on the descending (resistance) trendline.
Usually, when we reach the third touch, the price tends to fall.
We’re currently below the major resistance level at 4877, and in my opinion, on the monthly and three-month timeframes, the price doesn’t have enough strength to break through this level yet.
A correction is needed before we can break it.
That’s why at the moment, I’m more inclined toward short positions.
If you like the idea, please put a ‘like’. It's the best ‘Thank you!’ 😊 P.S. Always do your own analysis before a trade. Set a stop loss. Capture profits in instalments. Withdraw profits in fiat and make yourself and your friends happy.
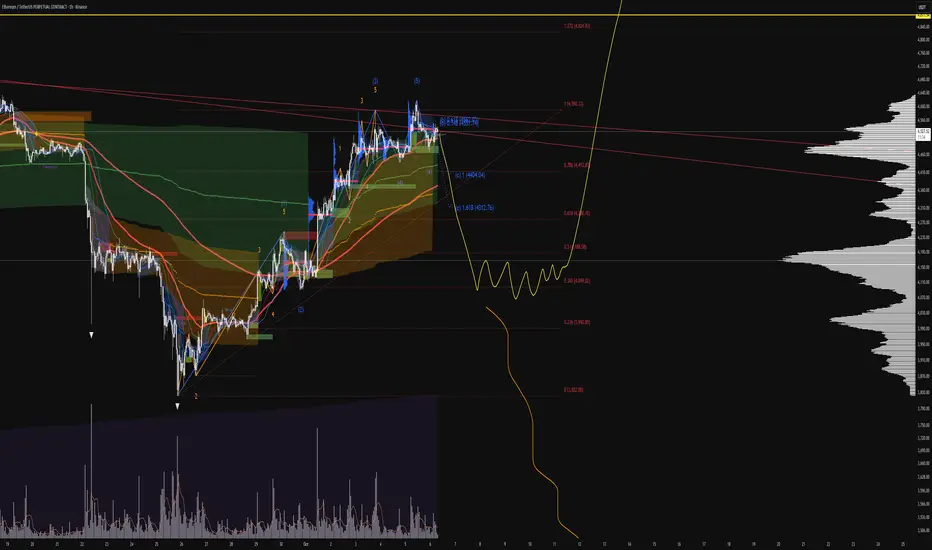
Ethereum — The Big Wave Towards New Highs, Bullish 10k?📝 Full Analysis
Ethereum (ETH/USDT) on the 1W timeframe is showing a clear 5-wave Elliott Impulse structure. Currently, price is assumed to be in the (4) corrective phase after wave (3) peaked around the 4.9k–5k zone.
Wave (4) is now retesting the critical support zone between 3.21k – 3.54k, which perfectly aligns with the Fibonacci retracement 0.5–0.618 levels. This area also acts as a key demand zone (previous resistance now flipping into support).
If this zone holds, ETH is well-positioned to start wave (5), targeting new all-time highs. But if this level breaks, ETH could fall into a much deeper corrective scenario.
---
🔑 Key Levels on the Chart
Main Support (yellow zone):
0.5 = 3,541
0.618 = 3,210
Bullish Extension Targets (Wave 5):
0.5 = 4,940
0.618 = 5,272
1.0 = 6,345
1.618 = 8,082
2.618 = 10,891
These are not just Fibonacci levels, but psychological points where the market often decides whether to continue or reverse.
---
📈 Bullish Scenario
1. Support 3.21k–3.54k holds → confirms wave (4) completion.
2. ETH prints a weekly rejection candle or bullish engulfing → buyer strength confirmed.
3. Breakout above 4.95k activates bullish momentum with staged targets:
Target 1 → 5.27k (0.618 extension)
Target 2 → 6.34k (1.0 extension)
Extended Target → 8.08k (1.618 extension)
Maximal Target → 10.9k (2.618 extension, potential new ATH)
4. Wave (5) is often accompanied by volume surge & market euphoria → a prime opportunity for swing traders and mid-term investors.
---
📉 Bearish Scenario
1. ETH closes below 3.21k weekly → weakens bullish wave structure.
2. Possible deeper retracement:
2.13k (0.5 retracement from macro impulse)
1.95k (0.618 retracement)
3. If ETH breaks below ~1.95k, the 5-wave Elliott structure becomes invalid, and the market could enter a prolonged accumulation/sideways phase similar to 2018–2019.
---
🔍 Pattern Breakdown
Elliott Impulse Wave (1–5) with strong extended wave (3).
Fibonacci retracement & extension for precise S/R validation.
Resistance → Support Flip Zone (3.2k–3.5k).
Potential Bullish Flag Structure (macro) if wave (4) is confirmed as a healthy correction.
---
🎯 Extra Insights
Wave (5) is usually shorter than wave (3) if wave (3) was already extended → realistic target sits around 6.3k–8k.
If crypto market euphoria (ETH ETF narrative, altseason) kicks in, then 10k+ ETH becomes a valid macro target.
Caution: wave (4) often forms complex corrections (flat/triangle), meaning sideways consolidation before the breakout.
---
🛡️ Trading Notes
Conservative entry: wait for weekly rejection confirmation at 3.2k–3.5k.
Aggressive entry: buy the dip in support zone with tight stop below 3.2k.
Breakout entry: wait for breakout + retest above 4.95k.
Take profit progressively: 5.2k → 6.3k → 8k.
---
Ethereum Weekly is forming a 5-wave Elliott Impulse. Currently, price is testing the critical support zone at 3.21k–3.54k.
If this zone holds → ETH is ready for wave (5) rally targeting 5.2k → 6.3k → 8k → even 10.9k.
If this zone fails → ETH risks a deeper correction towards 2.1k–1.95k.
This is the decisive moment for ETH: either break into new ATHs or enter a prolonged correction.
Not financial advice — manage your risk.
---
#Ethereum #ETHUSDT #CryptoAnalysis #ElliottWave #Fibonacci #CryptoTrading #SwingTrading #WeeklyChart #PricePrediction #AltcoinSeason

ETH/USDT: Bullish Rise to 4770?As the previous analysis worked exactly as predicted, BINANCE:ETHUSDT is gearing up for a bullish move on the 4-hour chart , with an entry zone between 4350-4395 near a key support and trendline.
The target range of 4735-4770 aligns with the next resistance, signaling strong upside potential. Set a stop loss on a close below 4228 to manage risk effectively. Watch BTC trends! 💡
📝 Trade Plan:
✅ Entry Zone: 4350 – 4395 (support + trendline area)
❌ Stop Loss: Daily close below 4228 to manage risk
🎯 Target Zone: 4735 – 4770 (next resistance level)
Ready for this lift-off? Drop your take below! 👇

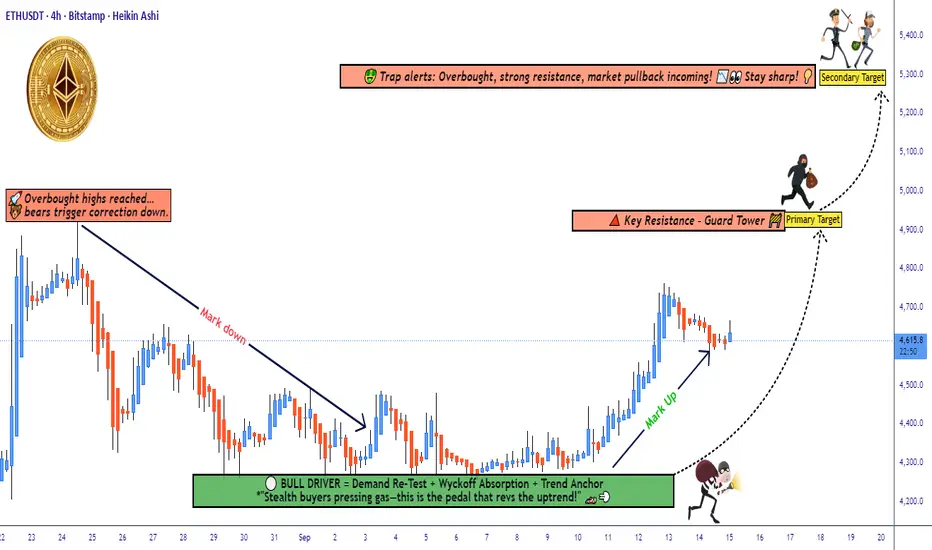
ETH/USDT Technical Outlook: Demand Layer Entries vs Trap Risk🚀 ETH/USDT | Ethereum vs Tether 💎
Crypto Market Money Looting Plan (Swing/Day Trade)
📌 Trade Plan (Bullish Outlook)
Setup: Demand Re-Test ✅ + Wyckoff Absorption 🔑 + Trend Anchor ⚓ (buyers confirmed presence)
Entry Style (Thief Layers 🪙): Using layered limit entries — examples: 4500, 4550, 4600, 4650 (you can add more layers as per your own method).
Stop-Loss (Protect the Vault 🔒): Example zone near 4400 after breakout. Adjust SL to fit your own risk appetite & personal strategy.
Target 🎯:
🎯 Primary: 4900 (local resistance)
🎯 Secondary: 5300 (major resistance / overbought zone)
🧾 Notes for Thief OG’s
This plan is not financial advice, only an idea. Always manage your own entries, SL, and TP.
Think of it as a vault strategy: take money, then protect money.
🔗 Related Pairs to Watch
BINANCE:BTCUSDT → ETH often follows BTC’s momentum. A BTC breakout/false move can affect ETH.
BINANCE:ETHBTC → Good pair to confirm ETH’s relative strength vs BTC.
BINANCE:SOLUSDT & BINANCE:BNBUSDT → Correlated majors; watch for rotation of capital in altcoins.
✨ “If you find value in my analysis, a 👍 and 🚀 boost is much appreciated — it helps me share more setups with the community!”
#ETH #Ethereum #Crypto #USDT #Altcoins #SwingTrade #DayTrading #LayerStrategy #Wyckoff #ThiefPlan #TradingView #CryptoTrading
ETH/USDT: Bullish Rise to 4580? BINANCE:ETHUSDT is gearing up for a bullish move on the 4-hour chart , with an entry zone between 4200-4250 near a key support and trendline. 🎯
The target at 4580 aligns with the next resistance, signaling strong upside potential. 📈 Set a stop loss on a close below 4000 to manage risk effectively.
Be patient until the price reaches the Entry Zone . If it doesn't, don't worry. The market is always alive and always gives us good trading opportunities.💡
Ready for this lift-off? Drop your take below! 👇
📝 Trade Plan:
✅ Entry Zone: 4200 – 4250 (support + trendline confluence)
❌ Stop Loss: Close below 4000 to manage risk
🎯 Target: 4580 (next resistance level)

ETHUSDT - UniverseMetta - Analysis#ETHUSDT - UniverseMetta - Analysis
Potential trend continuation – focus on Wave 5
📆 W1 – Weekly Timeframe
🔹 Price has broken above and confirmed support at a key level
🔹 A retest of the breakout level may precede the launch of a new Wave 5 in the uptrend
🔹 Alternatively, a deeper ABC correction could develop before continuation
📉 D1 – Daily Timeframe
🔹 A symmetrical triangle has formed and price has broken above the trendline
🔹 This may mark the beginning of a new impulse within an ABC structure
🎯 Short-term upside targets for a breakout:
• $4,782
• $4,964
⏳ H4 – 4H Timeframe
🔹 A potential Wave 3 to the upside is forming
🔹 Entry confirmation comes after price breaks above the 1st wave high and holds above the trendline
🔹 Stop-loss placed below the low of Wave 1
🎯 Trade Setup:
#ETHUSDT #BUY
Entry: 4,452.98
Take Profits (TP):
• 4,782.58
• 5,098.05
• 5,428.12
• 6,183.11
Stop Loss: 4,200.47
‼️ Total risk should not exceed 1–3% of your portfolio
This signal/idea is not investment advice
Always conduct your own analysis before entering the market

#ETHUSDT: $6000 Is The Next Target!!As we have been predicting since last one year or so, the ETH has reached almost $5000, now we can expect price to continue rising since it already made the correction. Target is $6000 this is swing target. Good luck and trade safe.
Team Setupsfx