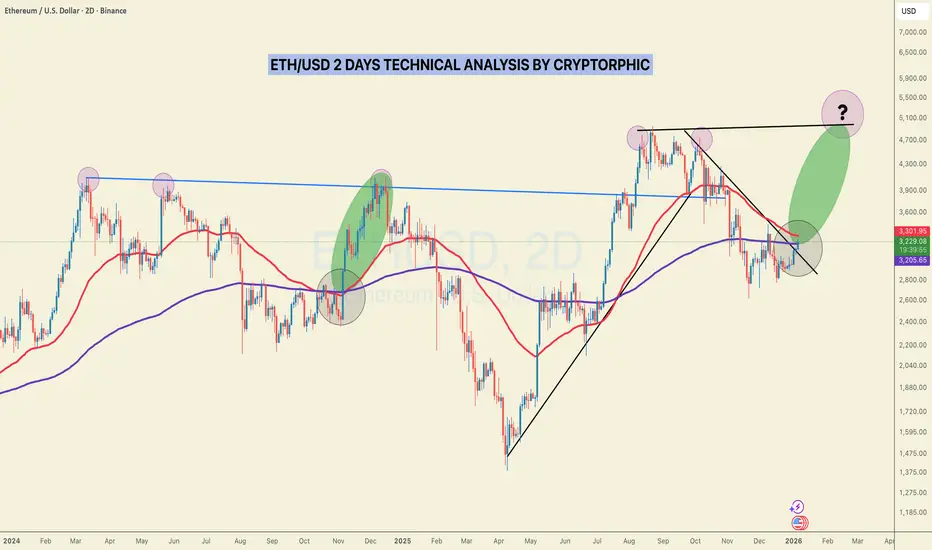
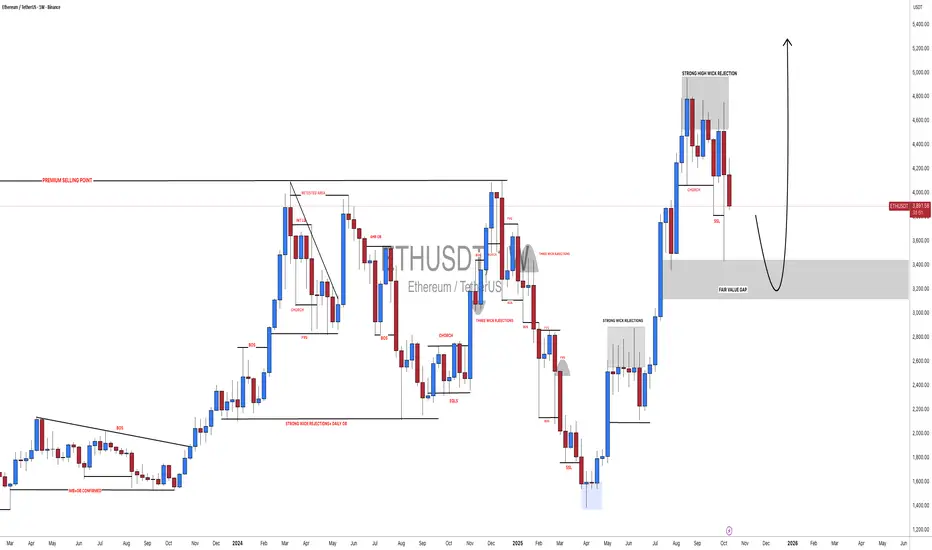
ETH is at a critical inflexion point! Bullish Rally ahead!A decisive reclaim of $3,200 (200 EMA) could unlock the next major leg higher.
Ethereum is stabilising after a corrective phase and beginning to show early signs of structural strength on the higher timeframe.
Key observations:
• The 200 EMA (blue) around $3,200 remains the final resistance
• Price compression suggests energy is building
• Momentum is gradually shifting back in favour of the bulls
🔑 Technical Thesis:
A strong reclaim and sustained close above the 200 EMA would confirm bullish intent and signal trend continuation rather than consolidation.
Once this level flips into support, the probability of a measured expansion increases significantly.
🎯 Upside targets:
$3,700 → $4,000
This zone aligns with prior supply and high liquidity, making it a natural target for upside.
📌 Bottom Line:
As long as ETH holds higher-timeframe demand and successfully reclaims the 200 EMA, the broader structure favours continuation.
Patience during consolidation often precedes aggressive directional moves.
Bullish breakout or another fake move? Do share your views in the comments, and please hit the like button if this post adds any value.
Thank you
#PEACE
#ETH #crypto
Ethusdtidea
ETH/USDT Bullish Continuation Setup With MA Confluence🚀 ETH/USDT BULLISH PROFIT PATHWAY
Ethereum vs Tether | Day / Swing Trade Setup
📌 MARKET OVERVIEW
🔹 Asset: ETH/USDT
🔹 Market Type: Crypto
🔹 Trade Style: Day / Swing
🔹 Bias: BULLISH 📈
Ethereum is showing strong bullish continuation behavior after a healthy pullback, indicating smart money accumulation rather than distribution.
🧠 TRADE PLAN – WHY THIS SETUP WORKS:
✅ Bullish confirmation achieved with:
🔁 786 Hull Moving Average pullback → trend respect by buyers
🚀 386 Triangular Moving Average breakout → momentum shift in favor of bulls
🧲 Price holding above dynamic support → dip buyers active
📊 This structure suggests trend continuation, not exhaustion.
🎯 ENTRY STRATEGY – THIEF LAYERING METHOD
💡 Thief never chases — Thief stacks positions 🥷
🔹 Entry Style: Layered limit entries (cost-averaging with control)
🔹 Execution: Buy ANY price level using layers
📍 Suggested Buy Layers:
• 2950
• 3000
• 3050
• 3100
⚠️ Increase or reduce layers based on:
Risk tolerance
Timeframe
Volatility conditions
🧠 Why layering works:
It reduces emotional entries, improves average price, and lets thieves profit from volatility traps.
🛑 STOP LOSS – CAPITAL PROTECTION
🚨 Thief SL Zone: 2900
⚠️ Important Note for OGs:
This SL is a reference, not an instruction.
Adjust SL based on:
Your position size
Timeframe
Account risk rules
💬 Risk management keeps thieves alive longer than predictions.
🎯 TARGET & EXIT STRATEGY
🎯 Primary Target: 3400
🚓 Why 3400 is critical:
Strong resistance zone
Overbought conditions likely
Profit-booking + trap area
Correlated rejection risk
💰 Smart Exit Idea:
Scale profits instead of waiting for one magic number:
• Partial TP near resistance
• Trail stop after momentum slows
📌 Thieves escape with profits — not with hope.
🔄 RELATED PAIRS TO WATCH (CORRELATION CHECK)
📊 These pairs help confirm or invalidate ETH strength:
🔹 BTC/USDT – Market leader
• BTC strength = ETH momentum confirmation
• BTC weakness = caution on ETH longs
🔹 ETH/BTC – Alt strength meter
• Rising ETH/BTC = alt season behavior
• Falling ETH/BTC = BTC dominance risk
🔹 SOL/USDT & AVAX/USDT
• If these lead → risk-on sentiment
• If they stall → reduce aggression
🧠 Correlation helps thieves filter fake breakouts.
🌍 FUNDAMENTAL & MACRO CONTEXT
📌 Current Market Drivers:
• Ethereum supply dynamics tightening due to staking
• Network upgrades supporting long-term demand
• ETF & institutional attention influencing volatility
• Macro risk sentiment impacting crypto flows
📆 Upcoming Considerations:
• Sudden news = volatility spikes
• Macro data releases can shake leverage
• Always expect fake moves before real expansion
⚠️ News doesn’t create trends — it accelerates them.
🧩 KEY LEVELS SUMMARY
📍 Support Zones: 2950 – 3000
📍 Bull Control Zone: Above 3050
📍 Resistance / Exit Zone: 3280 – 3400
📍 Psychological Levels: 3000 & 3400
FINAL THIEF MESSAGE
💬 Dear Ladies & Gentlemen (Thief OGs),
This plan is a framework, not financial advice.
You control:
Entry size
Stop loss
Profit taking
💰 Make money → protect capital → escape clean.
👇 Drop your bias in comments:
Bullish continuation or trap near 3400?
Let’s see who escapes with loot 🥷🔥

ETHUSDT Price at Strong Demand Zone – Watching for Bullish Zone📊 ETHUSDT – 30M
Price Reacting at Key Demand Zone | Potential Bullish Reversal Setup
This ETHUSDT 30-minute chart shows price entering a well-defined bullish reversal (demand) zone after a sustained bearish move. The market appears to be transitioning from distribution into accumulation, with clear signs of buyer interest emerging near the lows.
🔍 Market Structure Breakdown & Technical Analysis
ETH previously formed a series of lower highs and lower lows, confirming a short-term bearish structure.
The recent sell-off drove price into a historically significant demand area, where aggressive buying previously occurred.
The current move down lacks strong follow-through, suggesting bearish momentum is weakening.
Price is now consolidating, indicating absorption of sell orders by larger participants.
🟩 Reversal Zone & Volume Burst
The highlighted green area marks a high-probability demand zone, supported by:
Strong bullish displacement in the past
High-volume reaction (Volume Burst)
Long downside wicks showing liquidity sweep and rejection
This behavior often precedes short-term trend reversals or deep pullbacks.
📌 What Confirmation Looks Like
No blind entries — waiting for price confirmation inside the zone.
Bullish confirmation may include:
Bullish engulfing candle on 30M or lower TF
Strong rejection with long lower wicks
Break in internal market structure (higher low)
Increasing volume on bullish candles
Once confirmed, the probability favors a relief rally.
🎯 Trade Expectations (If Confirmed)
Bias: Bullish reaction / intraday reversal
Entry: After confirmation inside the demand zone
Invalidation: Clean break and close below the zone
Targets:
First target: Internal resistance / range high
Second target: Previous lower high
Extended target: Liquidity above recent highs
Risk-to-reward remains attractive due to tight invalidation and clear structure.
🧠 Market Psychology Insight
This setup reflects smart money accumulation, where liquidity is taken below recent lows before price expansion. Retail panic selling often fuels these reversals — patience and confirmation separate professionals from gamblers.

ETH/USDT Outlook – Bullish Bias Strengthens Above Key Support💎 ETHEREUM VS TETHER - Crypto Market Opportunity Blueprint (Swing Trade)
📊 CURRENT MARKET STATUS
Current Price: $3,380 - $3,427 USDT
Market Structure: Bullish consolidation at dynamic resistance
Setup Type: Weighted Moving Average Pullback + Breakout Confirmation
🎯 TRADE PLAN
📍 BIAS: BULLISH ✅
The bullish plan is CONFIRMED following:
✅ Weighted MA pullback completion
✅ Breakout at dynamic resistance line
✅ Price holding above key support zones
🔥 ENTRY STRATEGY - "THIEF LAYERING METHOD"
Entry Type: Multiple Limit Orders (Layer Strategy)
💰 THIEF ENTRY LAYERS:
Layer 1: $3,300 USDT
Layer 2: $3,400 USDT
Layer 3: $3,500 USDT
📌 Note: You can enter at ANY PRICE LEVEL or increase limit layers based on your own risk appetite and capital allocation. The layering strategy allows you to average your entry and reduce risk.
💡 Strategy Benefit: Multiple limit orders help capture price fluctuations and build position gradually instead of all-in at one price.
🛡️ STOP LOSS MANAGEMENT
Thief SL: $3,200 USDT
⚠️ IMPORTANT - Dear Ladies & Gentlemen (Thief OG's):
DO NOT blindly follow my SL level
PLACE YOUR SL AFTER BREAKOUT CONFIRMATION ONLY
Adjust your SL based on YOUR OWN strategy and risk tolerance
This is YOUR money, YOUR risk - trade responsibly
🎯 TAKE PROFIT TARGET
Target Zone: $3,800 USDT
⚠️ Exit Strategy Factors:
📉 Moving Average acting as strong resistance
⚠️ Overbought conditions expected
Potential bull trap zone
💰 Escape with profits at target levels
🔔 CRITICAL - Dear Ladies & Gentlemen (Thief OG's):
This is NOT financial advice
I'm NOT recommending you set ONLY my TP
Take profits at YOUR OWN price targets
Make money, THEN take money at your own risk level
No one knows your financial situation better than YOU
📊 CORRELATED PAIRS TO WATCH
Monitor these pairs for confirmation and correlation analysis:
Major Crypto Pairs 💹:
BINANCE:BTCUSDT - Bitcoin dominance and market leader direction
BINANCE:ETHBTC - Ethereum's strength vs Bitcoin (alt season indicator)
BINANCE:SOLUSDT - Layer-1 competitor correlation
BINANCE:BNBUSDT - Exchange token & ecosystem correlation
DeFi Ecosystem 🔗:
BINANCE:LINKUSDT - Oracle network (DeFi infrastructure)
BINANCE:UNIUSDT - DEX token (Ethereum ecosystem strength)
BINANCE:AAVEUSDT - Lending protocol (DeFi sentiment)
Layer-2s ⚡:
BITTREX:MATICUSDT (Polygon) - L2 scaling solution
BINANCE:ARBUSDT (Arbitrum) - L2 rollup correlation
BINANCE:OPUSDT (Optimism) - L2 ecosystem health
🔍 KEY CORRELATION POINTS
1️⃣ BTC Dominance: If BTC pumps independently, ETH might lag initially
2️⃣ ETH/BTC Ratio: Rising = Alt season favorable / Falling = BTC dominance
3️⃣ L2 Tokens: Strong performance = Ethereum ecosystem bullish
4️⃣ DeFi Tokens: Strength indicates institutional rotation into ETH ecosystem
5️⃣ Gas Prices: Rising on-chain activity supports bullish ETH narrative
⚡ TECHNICAL SETUP SUMMARY
✅ Weighted MA pullback completed
✅ Dynamic resistance breakout confirmed
✅ Support holding at lower levels
✅ Volume confirmation on breakout
⚠️ Watch for overbought RSI at target zone
⚠️ Be cautious of bull traps near MA resistance
🎓 RISK MANAGEMENT REMINDER
💼 Never risk more than 1-3% of portfolio per trade
📊 Position size according to YOUR stop loss distance
🎯 Have clear exit strategy BEFORE entering
💰 Take partial profits at psychological levels
🔄 Trail your stop loss as trade moves in profit
🔔 Like this idea? Drop a 👍 and follow for more setups!
💬 Comment your thoughts and TP levels below!
📊 Share with fellow traders who need to see this!
#ETHUSDT #Ethereum #CryptoTrading #SwingTrade #TechnicalAnalysis #TradingView #CryptoAnalysis #AltSeason #DeFi #Layer1
Can Ethereum’s Capital Flow Blueprint Target 4600 Next?🎯 ETH/USD "The Liquidity Thief" Strategy 💰
Weighted MA Pullback + Manipulation Grab Blueprint
📊 TRADE SETUP OVERVIEW
Asset: ETH/USD (Ethereum vs USD) | Timeframe: Swing Trade
Market Structure: Bullish Confirmation with WMA Pullback Recovery
Strategy Type: Multi-Layer Accumulation (Thief-Style Entry Method)
🎪 THE GAMEPLAN
Bias: 🟢 BULLISH — Confirmed via:
Weighted Moving Average (WMA) acting as dynamic support
Liquidity pool identification on pullback zones
Institutional accumulation patterns detected
This setup thrives on pullback retracements where smart money accumulates before the next leg up. We're essentially "stealing" liquidity at discount prices during these inefficiency windows.
🚀 MULTI-LAYER ENTRY STRATEGY (The Thief Approach)
Instead of FOMO market orders, we deploy calculated limit order layers at strategic support zones:
Entry Levels (Layer-by-Layer Accumulation):
Layer 1: $3,700 USD
Layer 2: $3,800 USD
Layer 3: $3,900 USD
(Pro Tip: Scale these layers based on your risk tolerance and account size. Tighter layers = more fills; wider layers = better average price)
Position Building: Fill partial positions at each layer, building your total exposure gradually. This reduces average entry cost and maximizes probability of initial profit.
🛑 STOP LOSS (Risk Management)
Hard Stop: $3,500 USD
⚠️ Important Disclaimer: This is YOUR trading decision. No strategy guarantees profits. Position sizing and risk management are YOUR responsibility. Never risk capital you can't afford to lose.
🎯 TARGET & EXIT STRATEGY
Primary Target: $4,600 USD
Exit Rationale:
Strong resistance zone confluence
RSI/Stochastic overbought divergence
Liquidity trap zone (potential reversal catalyst)
💡 Golden Rule: Lock in profits at $4,600 or take partial profits at resistance. Never hold through key resistance on swing trades—greed kills thief traders.
⚠️ Disclosure: Risk management and profit targets are trader-dependent. Adjust based on your strategy framework, market conditions, and account allocation.
📈 CORRELATED PAIRS TO WATCH
Monitor these assets for confluence signals and capital flow indicators:
BITSTAMP:BTCUSD (✅ High Positive Correlation) — Bitcoin sets market sentiment; ETH typically follows in lockstep. When BTC rallies, altcoins like ETH amplify the move upward.
BINANCE:ETHBTC (⚖️ Relative Strength) — ETH strength against BTC equals altseason confirmation. Rising ETHBTC ratio means Ethereum is outperforming Bitcoin—bullish for our setup.
$SPY/ IG:NASDAQ (📊 Risk Appetite) — Traditional equity weakness creates crypto pullback risk. If stocks dump, crypto usually follows. Monitor US market opens for confirmation signals.
TVC:DXY (Dollar Index) (⚖️ Inverse Correlation) — Strong dollar = crypto headwind; weak dollar = tailwind for ETH. A declining DXY supports crypto rally scenarios.
COINBASE:USDTUSD (🔒 Stablecoin Flow) — USDT accumulation signals capital waiting for entry. Rising USDT on exchanges = dry powder ready to deploy into altcoins like ETH.
Capital Flow Blueprint: When BTC holds above support AND USDT shows inflow, altcoins like ETH enter "hunter mode."
🔑 KEY TRADING PRINCIPLES (Thief OG Edition)
✨ Patience — Wait for pullback confirmation before layering in
✨ Position Sizing — Risk only 1-2% per trade; 3% absolute maximum
✨ Confluence — Entry + Support + Volume + Correlation = Green Light
✨ Discipline — Exit at target or stop loss; no emotional HODL mode
✨ Adaptation — Markets evolve; update bias if structure breaks
If you find value in my analysis, a 👍 and 🚀 boost is much appreciated — it helps me share more setups with the community!
#ETH #ETHUSD #Ethereum #CryptoTrading #TechnicalAnalysis #SwingTrading #CryptoDCA #TradingStrategy #LayerEntry #LiquidityZones #AltSeason #CryptoAnalysis #TradeSetup #RiskManagement #Thief #CommunityDriven

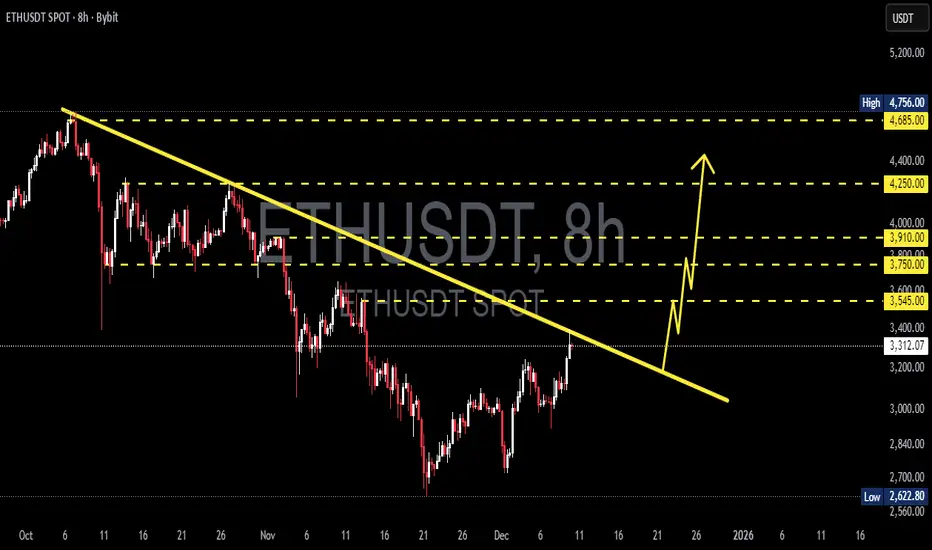
ETH/USDT — This Trendline Will Decide the Next Major MoveETH is now sitting at the most crucial level of Q4 —
directly attacking the descending trendline that has rejected every rally since early October.
This is not just a trendline.
This is the wall separating ETH from a full momentum breakout.
---
🔍 What’s Really Happening on the Chart?
ETH has formed a sequence of higher lows, showing growing buyer strength.
The descending trendline (yellow) remains the final defense for the bears.
Several major resistance zones above (3,545 → 3,750 → 3,910 → 4,250 → 4,685) are aligned perfectly if a breakout confirms.
Price is now sitting at a decision zone, and markets often expand aggressively after setups like this.
In simple terms:
ETH is preparing for a big move — only the direction is yet to be chosen.
---
🔥 Bullish Scenario — A Breakout That Changes Everything
If ETH manages to:
1. Close an 8H candle above the trendline, and
2. Show a clean retest afterward,
then a bullish expansion could unfold toward:
🎯 3,545 — first breakout confirmation
🎯 3,750 — structural shift
🎯 3,910 — major resistance
🎯 4,250 — expansion zone
🎯 4,685 – 4,756 — full breakout target
Trendline breaks like this often mark the start of large impulsive rallies, especially with rising volume.
---
⚠️ Bearish Scenario — A Sharp Rejection
If the trendline rejects price and the candle closes back below it:
ETH forms another lower high,
Bearish structure resumes,
Downside targets come into play:
🔻 3,000 – 2,840
🔻 2,700
🔻 2,622 (major support)
A rejection here frequently creates strong downward continuation, as this trendline is widely watched.
---
🎯 Key Takeaway
This is the most important ETH setup of the past several weeks.
Breakout → bullish momentum wave.
Rejection → trend continuation downward.
This level will likely dictate ETH’s direction going into early 2026.
For aggressive traders, this is an opportunity.
For conservative traders, this is a wait-for-confirmation zone.
#Ethereum #ETH #ETHUSDT #CryptoAnalysis #PriceAction #Breakout #Trendline #CryptoMarkets #Altcoins
#ETHUSDT: Price is yet to drop around $1780 area before bullsETHUSDT is likely to fall further to around $1900 or $1800. This area appears more promising and has strong bullish volume. We should wait for price confirmation before entering.
If you like our idea, please like and comment. Also, use accurate risk management.
Team Setupsfx_

ETHUSDT: First Drop To $2100 And Bounce Up To $6500ETHUSDT is dropping nicely and we expect a smooth reversal around $2200. This area looks promising due to the significant volume sitting there. We just need to avoid liquidation. Once the entry is active, you can enter with strict risk management and set multiple take profit levels. This analysis is suitable for all traders from intraday to swing.
Good luck and feel free to like and comment for more!
Team Setupsfx_
#ETHUSDT: Fill The Gap At $3200, Target At $6000 The significant price gap has been closed and the market is now in correction mode. We anticipate a further decline of approximately $3200 which remains a key support level for buyers. Our next step is to observe the market’s reaction and remain patient.
Please note that this is not a guarantee and you should always conduct your own research before making any significant investment decisions.
Best regards,
Team Setupsfx
ETHUSDT – Reclaiming Liquidity Zone, Eyeing Supply TestETH successfully closed above the $3,350 liquidity area on both the 3D and weekly timeframe, confirming a clean liquidity sweep and reclaim. This type of move often signals the start of a bullish rebound, which we’ve already seen with ETH recovering strongly over the weekend.
Currently, price is likely heading toward the supply zone between $3,930 – $3,795, where we should monitor the reaction closely. A rejection from this zone could trigger a short-term pullback, potentially revisiting the $3,350 support area once again. However, if ETH manages to break and close above this supply, the next major challenge will be the key resistance near $4,089, a crucial level before retesting the All-Time High (ATH) region.
On the flip side, the bearish scenario would be a weekly close below $3,350, opening the door for a deeper retracement toward the Monthly Order Block (OB) zone around $2,878 – $2,125. This could unfold if Bitcoin also drops below the $100K level, reinforcing broader market weakness.

Ethereum Technical Map – Bulls Leading the Charge!🎯 ETH/USDT: The Gentleman Thief's Swing Play | 3600→4350 Target 🚀
📊 MARKET OVERVIEW
Asset: ETHEREUM/TETHER (ETH/USDT)
Timeframe: Swing/Day Trade
Bias: 🐂 BULLISH
Strategy Type: Wealth Accumulation Map
🎭 THE SETUP (A.K.A. "THE HEIST PLAN")
🟢 ENTRY ZONE
Flexible Entry: Any current price level accepted
Translation: We're not picky—grab your ticket to the moon wherever you are!
🛑 STOP LOSS (THE "THIEF'S INSURANCE")
SL: $3,600
⚠️ Important Note for OG Thieves:
Listen up, Ladies & Gentlemen! This is MY stop loss level, not a divine commandment. You've got your own vault to protect—set YOUR stop loss based on YOUR risk appetite. Your money, your rules, your responsibility. Don't blame me if you ignore risk management! 💼
🎯 TAKE PROFIT TARGET
TP: $4,350
📍 Technical Confluence:
Triangular Moving Average acting as strong resistance
Overbought conditions developing
Potential bull trap zone forming
⚠️ Another Friendly Reminder:
Dear OG Thieves, this is MY target—not financial advice carved in stone! Scale out, take profits along the way, or let it ride. YOU decide when to count your loot. Exit strategy is YOUR masterpiece! 🎨
🔍 KEY TECHNICAL LEVELS
Resistance Zones:
Primary: $4,350 (TMA + Overbought)
Watch for rejection wicks at this level
Support Foundation:
$3,600 (Our safety net)
Strategy:
Classic "buy the dip, sell the rip" with proper risk management. We're riding the wave, not fighting the tide! 🌊
👀 RELATED PAIRS TO WATCH
Correlated Assets:
BTC/USDT ( CRYPTOCAP:BTC ) - King leads, ETH follows (usually)
SOL/USDT ( CRYPTOCAP:SOL ) - Alt season companion
MATIC/USDT ( SEED_DONKEYDAN_MARKET_CAP:MATIC ) - Ethereum ecosystem play
BNB/USDT ( CRYPTOCAP:BNB ) - Exchange token correlation
AVAX/USDT ( CRYPTOCAP:AVAX ) - Smart contract platform peer
💡 Correlation Notes:
When BTC pumps, ETH typically follows with stronger percentage moves. Watch Bitcoin dominance—if it drops while BTC rises, expect explosive alt season momentum. SOL and AVAX often move in tandem with ETH as the "Layer 1 trio."
⚙️ RISK MANAGEMENT (THE GENTLEMAN'S CODE)
✅ Never risk more than 1-2% of portfolio per trade
✅ Consider partial profit-taking at resistance levels
✅ Trail your stop loss as price advances
✅ Don't marry your position—take the money and run when it's time! 💰
🎩 FINAL WORDS FROM YOUR FRIENDLY NEIGHBORHOOD CHART THIEF
This analysis combines technical indicators, market structure, and a healthy dose of swagger. Remember: The market doesn't care about your feelings, your bills, or your dreams. Protect your capital like it's the Crown Jewels! 👑
Trade smart, stay humble, and may the pips be ever in your favor! 🎲
✨ If you find value in my analysis, a 👍 and 🚀 boost is much appreciated — it helps me share more setups with the community!
#ETHUSDT #Ethereum #CryptoTrading #SwingTrading #DayTrading #TechnicalAnalysis #CryptoTA #ETHUSD #AltcoinTrading #CryptoStrategy #TradingIdeas #CryptoSignals #BullishSetup #RiskManagement #TradingView #ETH #Cryptocurrency #DigitalAssets #CryptoMarket #TradingCommunity
📈 Chart Analysis | 🎯 Swing Trading | 💎 Crypto Markets | 🚀 To The Moon
#ETHUSDT: First Drop And Then Launch To $5500! ETHUSDT we believe the price will initially decline before launching from the $3000 price region. This area appears more promising and could function as a discounted price zone. Three target levels are suggested below:
* **First target:** $4000. This area presents a minor resistance level, and closing 25% of positions is ideal.
* **Second target:** $4500. This is the second major resistance level, and closing another 25% of positions is recommended.
* **Final target:** $5500. This is our swing target. If the price reaches this level, it could be a suitable area to initiate a swing sell and the commencement of a major bearish move.
Please share your thoughts.
Team Setupsfx_
#ETHUSDT: Currently On The Way Towards Filling The FVG?ETCUSDT is currently experiencing a significant correction as the price approaches a pivotal juncture where a substantial bullish price reversal is anticipated, potentially propelling it to new all-time highs or even surpassing them. It is imperative to exercise meticulous risk management and conduct your own thorough analysis before engaging in any cryptocurrency trading or investment activities.
Should the price indeed undergo a major correction, it is likely to decline to our second designated area, where it is anticipated to fill the liquidity gap and subsequently reverse course, continuing its trajectory towards our established targets.
Please consider this analysis as a secondary influence only, or even solely for educational purposes. It is crucial to conduct your own independent analysis and risk management prior to engaging in any cryptocurrency trading or investment endeavours, as they inherently carry substantial financial risks.
We extend our best wishes and encourage you to trade safely and responsibly.
Should you wish to demonstrate your support, you are welcome to express your appreciation through likes, comments, or sharing this information.
Thank you for your consideration.
Have a pleasant weekend.
Team Setupsfx_

ETH/USDT — Critical Retest at 3950–3520 Before Next Major Move?Ethereum has once again faced strong rejection from the key supply zone between 4,940–5,272 (Fib 0.5–0.618), signaling heavy selling pressure at this multi-year resistance area.
Price action now points toward a potential retracement into the major demand zone (yellow block) between 3,950–3,520, where the next directional move is likely to be decided.
---
📊 Key Technical Structure
Major Supply Zone: 4,940 – 5,272 (Fib 0.5–0.618)
Minor Support: 4,120
Primary Demand Zone (Yellow Block): 3,950 – 3,520
Next Supports (if broken): 3,210 → 2,132
Bullish Fibonacci Targets: 6,345 → 8,082 → 10,891
---
📈 Bullish Scenario — “Reclaim & Expansion”
ETH still maintains a macro structure of higher-highs and higher-lows on the weekly timeframe.
As long as the 3,520 support holds, the broader trend remains bullish.
A strong rebound from 3,950–3,520 followed by a weekly close above 5,272 would confirm bullish continuation and open up:
Target 1: 6,345 (Fib 1.0)
Target 2: 8,082 (Fib 1.618)
Target 3: 10,891 (Fib 2.618 — potential cycle top)**
The key confirmation for bulls is a weekly reclaim above 5,272 with volume.
---
📉 Bearish Scenario — “Breakdown & Deeper Retracement”
If the selling pressure continues and ETH closes below 3,520, the bullish structure will be invalidated.
Such a breakdown could trigger a deeper retracement toward:
3,210 (Fib 0.618 confluence)
2,132–1,955 (deeper structural retracement)
Failure to defend the yellow block would shift ETH into a lower-high / lower-low structure, signaling a medium-term trend reversal.
---
🔍 Market Context
ETH is currently retesting the same macro resistance zone that marked the all-time high area in 2021.
The rejection at 5K highlights that supply remains dominant in this region, while the 3,950–3,520 demand block now serves as the key battlefield for bulls and bears.
As long as the yellow block holds, this pullback can still be considered a healthy correction within a macro uptrend.
But if it breaks, the market may enter a prolonged consolidation phase before the next cycle begins.
---
📍 Summary
Ethereum stands at a major inflection point:
Bullish Case: Bounce from 3,950–3,520 and reclaim 5,272 → targets 6.3K – 8K – 10.8K
Bearish Case: Breakdown below 3,520 → deeper correction to 3.21K or even 2.13K
The 3,950–3,520 demand zone is the final defense for ETH’s mid-term bullish structure — hold it, and the trend continues; lose it, and momentum fades.
---
#Ethereum #ETHUSDT #Crypto #TechnicalAnalysis #Fibonacci #PriceAction #CryptoMarket #WeeklyChart #ETHAnalysis #MarketStructure

Ethereum — The Big Wave Towards New Highs, Bullish 10k?📝 Full Analysis
Ethereum (ETH/USDT) on the 1W timeframe is showing a clear 5-wave Elliott Impulse structure. Currently, price is assumed to be in the (4) corrective phase after wave (3) peaked around the 4.9k–5k zone.
Wave (4) is now retesting the critical support zone between 3.21k – 3.54k, which perfectly aligns with the Fibonacci retracement 0.5–0.618 levels. This area also acts as a key demand zone (previous resistance now flipping into support).
If this zone holds, ETH is well-positioned to start wave (5), targeting new all-time highs. But if this level breaks, ETH could fall into a much deeper corrective scenario.
---
🔑 Key Levels on the Chart
Main Support (yellow zone):
0.5 = 3,541
0.618 = 3,210
Bullish Extension Targets (Wave 5):
0.5 = 4,940
0.618 = 5,272
1.0 = 6,345
1.618 = 8,082
2.618 = 10,891
These are not just Fibonacci levels, but psychological points where the market often decides whether to continue or reverse.
---
📈 Bullish Scenario
1. Support 3.21k–3.54k holds → confirms wave (4) completion.
2. ETH prints a weekly rejection candle or bullish engulfing → buyer strength confirmed.
3. Breakout above 4.95k activates bullish momentum with staged targets:
Target 1 → 5.27k (0.618 extension)
Target 2 → 6.34k (1.0 extension)
Extended Target → 8.08k (1.618 extension)
Maximal Target → 10.9k (2.618 extension, potential new ATH)
4. Wave (5) is often accompanied by volume surge & market euphoria → a prime opportunity for swing traders and mid-term investors.
---
📉 Bearish Scenario
1. ETH closes below 3.21k weekly → weakens bullish wave structure.
2. Possible deeper retracement:
2.13k (0.5 retracement from macro impulse)
1.95k (0.618 retracement)
3. If ETH breaks below ~1.95k, the 5-wave Elliott structure becomes invalid, and the market could enter a prolonged accumulation/sideways phase similar to 2018–2019.
---
🔍 Pattern Breakdown
Elliott Impulse Wave (1–5) with strong extended wave (3).
Fibonacci retracement & extension for precise S/R validation.
Resistance → Support Flip Zone (3.2k–3.5k).
Potential Bullish Flag Structure (macro) if wave (4) is confirmed as a healthy correction.
---
🎯 Extra Insights
Wave (5) is usually shorter than wave (3) if wave (3) was already extended → realistic target sits around 6.3k–8k.
If crypto market euphoria (ETH ETF narrative, altseason) kicks in, then 10k+ ETH becomes a valid macro target.
Caution: wave (4) often forms complex corrections (flat/triangle), meaning sideways consolidation before the breakout.
---
🛡️ Trading Notes
Conservative entry: wait for weekly rejection confirmation at 3.2k–3.5k.
Aggressive entry: buy the dip in support zone with tight stop below 3.2k.
Breakout entry: wait for breakout + retest above 4.95k.
Take profit progressively: 5.2k → 6.3k → 8k.
---
Ethereum Weekly is forming a 5-wave Elliott Impulse. Currently, price is testing the critical support zone at 3.21k–3.54k.
If this zone holds → ETH is ready for wave (5) rally targeting 5.2k → 6.3k → 8k → even 10.9k.
If this zone fails → ETH risks a deeper correction towards 2.1k–1.95k.
This is the decisive moment for ETH: either break into new ATHs or enter a prolonged correction.
Not financial advice — manage your risk.
---
#Ethereum #ETHUSDT #CryptoAnalysis #ElliottWave #Fibonacci #CryptoTrading #SwingTrading #WeeklyChart #PricePrediction #AltcoinSeason

#ETHUSDT: $6000 Is The Next Target!!As we have been predicting since last one year or so, the ETH has reached almost $5000, now we can expect price to continue rising since it already made the correction. Target is $6000 this is swing target. Good luck and trade safe.
Team Setupsfx
ETH/USDT — Resistance Around $4.0k: Breakout or Rejection?Summary
The weekly chart shows Ethereum testing a multi-year horizontal resistance zone around $3.9k–$4.1k, a level repeatedly tested since 2021. The measured move on the chart projects a potential target of $4,868 — about +$868 or ~21–22% upside — if a confirmed breakout occurs on the weekly timeframe.
---
Technical Analysis (based on chart)
Timeframe: Weekly (1W). The current test is highly significant due to the higher timeframe, with medium- to long-term implications.
Key Levels:
Major resistance zone: ≈ $3,950 – $4,100 (yellow line).
Breakout target: $4,868 (≈ +$868 or ~+21–22% from the breakout zone).
First support if rejected: ≈ $3,300 – $3,600. Stronger support at $2,100 – $2,750.
Price Action: Price has made multiple peaks at this zone (multiple tops), signaling strong supply. However, recent higher lows suggest growing bullish momentum — if a breakout occurs.
Pattern: Multi-year horizontal resistance. Possible outcomes:
Rejection: Acts as a triple-top / horizontal supply zone.
Breakout: Transitions into a range breakout setup with measured target.
---
Bullish Scenario (confirmation needed)
1. Confirmation signal: Weekly close above $4.0k zone with strong follow-through in the next week.
2. Entry strategies:
Conservative: Wait for a retest (resistance → support) before entering, with stop below retest (~$3.7k).
Aggressive: Enter on breakout, stop below breakout candle low.
3. Target: First target ~$4,868 (measured move). If momentum persists, higher targets may be reached.
4. Invalidation: Weekly close back below $3.7k–3.8k after breakout.
---
Bearish Scenario (if rejection occurs)
1. Confirmation signal: Bearish rejection candle (pin bar / engulfing) on weekly + no breakout close.
2. Entry strategies: Short or take profit on longs after confirmed rejection; ideally backed by bearish follow-through next week.
3. Target downside: First support $3.3k–3.6k; stronger drop could retest $2.1k–2.8k zone.
4. Invalidation: Weekly close back above $4.1k with strong bullish volume.
---
Risk Management & Notes
Weekly close is key — avoid reacting solely to intraday wicks.
Volume matters: No volume = higher risk of false breakout.
Position sizing: Keep risk controlled (e.g., 1–2% per trade), stops in logical zones.
Multi-timeframe check: Use daily chart for precise entries and watch for orderflow/news catalysts.
---
Pattern Notes
Multiple Tops / Horizontal Supply: Sellers have consistently defended this level.
Ascending pressure: Higher lows into resistance can increase breakout probability.
Measured Move: Distance from breakout zone to target is about $868 — matching the chart’s projection.
---
Hashtags
#ETH #ETHUSDT #Ethereum #Crypto #Breakout #Resistance #WeeklyChart #CryptoAnalysis #TechnicalAnalysis

ETH: Will Price Continue Upwards Movement! ETH has been steadily bullish in recent times, as the crypto market experienced a significant increased a safer option to invest around the global investment community. DXY and other major currencies currently experiencing a major drawdown in prices which indirectly helping the crypto market to remain bullish. While looking at how eth has performed in recent past, we can see it creating a record high in coming weeks.
Ethereum Charts Aligning for a Major BreakoutI analyzed Ethereum on both the monthly and 2-week timeframes, and the structure looks strong.
On the right side, we have the monthly chart, where ETH has printed a bullish Morning Star pattern right off the key support trendline.
This is a classic reversal signal, and price is now approaching the upper resistance zone. A breakout from here could trigger a major rally, similar to what we saw in 2020.
On the left side, the 2-week chart shows CRYPTOCAP:ETH pressing into a critical resistance zone after a strong bounce. If price breaks and holds above this zone, it could open the doors to $6K–$8K targets in the coming months.
ETH is showing strength, now we wait for confirmation from the breakout.
Thanks for reading!

#ETHUSDT: Time For Big Price Distribution! Get Ready $5000ETH is currently in distribution and is on our target list. We expect a smooth price movement, potentially reaching $3100, $3800, and $5000. Use the entry zone to take a position; anything below the entry will invalidate the idea. Please use accurate risk management while trading.
Like, comment, and share this idea to encourage us to post more.
Team Setupsfx_

ETH Long / Buy SetupAs of many times mentioned that, will short eth above 3k or 3k, but it still shows Bullish momentum no sign of weakness, maybe this entry triggers during weekend due too low volume, search for ifvg, if any 1D or 4hr Bullish fvg truns into bearish ifvg then will take short on ETH. For now will take long with SL and proper risk management.

Ultimate Ethereum Heist Plan : Catch the ETH/USD Bull Run!🌍 Hello, Global Money Makers! 🌟 Salaam, Ciao, Hola! 🌟
Dear Traders and Market Raiders, 🤑💸
Get ready to execute the *Thief Trading Strategy*—a slick blend of technical and fundamental analysis designed to conquer the ETH/USD crypto market! 📈💥 Follow the plan outlined in the chart for a *long entry* and aim to cash out near the high-risk *Yellow ATR Zone*. This is where the market gets wild—overbought conditions, consolidation, or even a trend reversal could trap the bears! 🐻💪 Take your profits and treat yourself—you’ve earned it! 🎉
**Entry 📈:** The heist begins! Wait for the *Moving Average breakout* at 2750 to strike. Bullish gains are calling! 💰
- Set *buy stop orders* above the MA for a clean breakout.
- Alternatively, place *buy limit orders* on a pullback within a 15 or 30-minute timeframe, targeting the most recent swing low/high.
📢 *Pro Tip:* Set an alert on your chart to catch the breakout moment! 🚨
**Stop Loss 🛑:** Listen up, crew! 🗣️ For *buy stop orders*, hold off on setting your stop loss until *after* the breakout. Place it at the nearest swing low on the 4H timeframe (around 2360) for day/swing trades.
- Adjust your stop loss based on your risk tolerance, lot size, and number of orders.
⚠️ Take control of your risk—it’s your heist, not mine! 😎🔥
**Target 🎯:** Aim for 3200 or exit early if the market signals a reversal.
**Scalpers, Eyes Here 👀:** Stick to *long-side scalping*. Got deep pockets? Jump in now! Smaller accounts? Join the swing traders and follow the plan. Use a *trailing stop loss* to lock in your loot. 💰
**Market Outlook 🐂:** The ETH/USD market is charging with bullish momentum, fueled by key fundamentals. ☝️ Check the linkks for *COT Report*, macroeconomics, sentiment, and intermarket analysis for a full picture. 👉🏻🔗
**⚠️ Trading Alert: News & Risk Management 📰**
News releases can shake up prices and volatility. Protect your positions:
- Avoid new trades during major news events.
- Use *trailing stop-loss orders* to secure profits.
💥 *Boost This Plan!* 💥 Support our *Thief Trading Crew* by hitting the Boost button. Let’s make money effortlessly every day with this strategy! 🚀🤝 Stay tuned for the next heist plan, and let’s keep raiding the markets! 🤑🐱👤🎉

ETH/USDT Bullish Reversal Analysis Chart Overview:
Ethereum (ETH) has shown a strong bullish reversal from the support zone near $2,200, forming a V-shaped recovery pattern. The price is currently trading around $2,450, with upward momentum targeting the next key resistance level.
📌 Key Technical Highlights:
✅ Support Zone:
Clearly respected at $2,200 – $2,300 range
Multiple candle wicks suggest strong buyer interest
✅ Resistance Zone:
Major resistance expected around $2,900
Historical rejection indicates potential selling pressure
✅ Target Level:
Short-term target marked at $2,610 🟣
If momentum sustains, price could push towards this zone before facing resistance
📈 Bullish Momentum:
Strong breakout from downtrend channel
Formation of higher highs and higher lows
Price action respecting upward trend structure
🛠 Pattern Structure:
Reversal pattern after corrective phase
Bullish engulfing candles suggest continuation
📊 Forecast Path:
Two potential scenarios are outlined:
📈 A clean push to the $2,610 target, followed by consolidation
🔄 A short pullback to $2,374 before continuation to the target
⚠️ Conclusion:
ETH/USDT is showing bullish signs with potential to reach $2,610. Watch for consolidation or pullbacks as buying opportunities, but be cautious of heavy resistance above $2,900. Ideal for short- to mid-term bullish setups
