ETHUSD - Are Bears Ready for the Fall?ETHUSD on the 4H timeframe is clearly in a corrective downtrend, not a healthy bullish structure. The price action fits an Elliott Wave decline where wave 3 already completed near 2620 , followed by a weak and overlapping recovery that looks like wave 4. That recovery stayed inside a falling channel and never showed impulsive strength, which already tells you buyers are weak. More importantly, wave 4 is flirting with wave 1 territory, which puts the entire bullish hope on thin ice.
Right now, ETH is at a make or break zone. If this move is just a fake breakdown, price must quickly reclaim the channel and hold above recent highs. If not, then this is likely wave 5 of C, and downside continuation becomes the dominant scenario. The structure favors a final flush toward the 2380 to 2350 area, where wave 5 projection and channel support align. Anyone blindly bullish here is ignoring structure. This is not a buy the dip market, it is a wait for confirmation or respect the downtrend market.
ETHUSDTPERP

Next Volatility Period: Around December 28th
Hello, traders!
Follow us to get the latest information quickly.
Have a great day.
-------------------------------------
#ETHUSDT
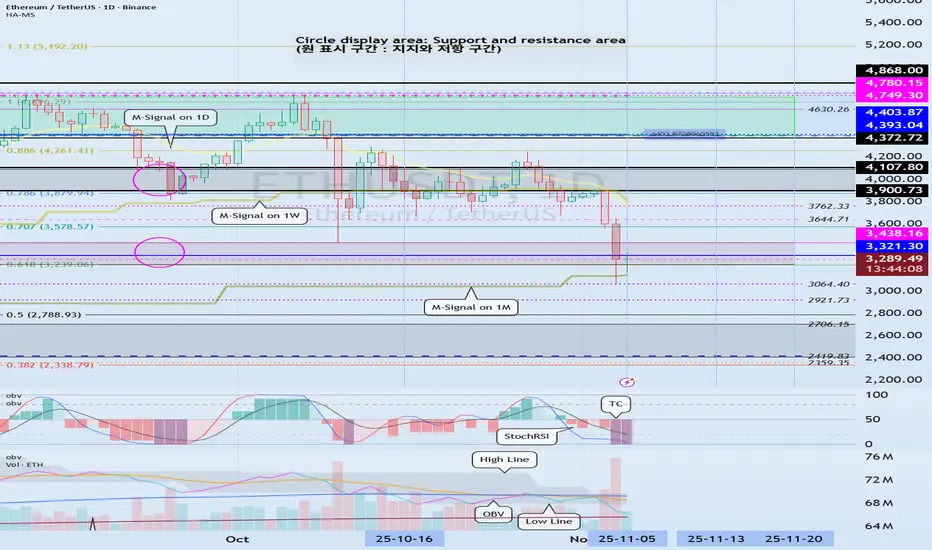
With the formation of a new trend line, the next volatility period is expected to occur around December 28th - January 1st.
At this time, the key will be whether the price can find support near the lows of 2828.57-2887.66 and rise above the M-Signal indicator on the 1M chart.
However, the most important support and resistance area is the 2419.83-2706.15 range, so it's crucial to maintain the price above this level.
To turn into an uptrend and establish a bullish trend, it must rise above the 3321.30-3438.16 level.
Therefore, you should develop or adjust your medium- to long-term trading strategy based on the movements of the upcoming volatility period.
If it falls below the 2419.83-2706.15 level, a bear market is likely to begin, so you should consider a response plan.
If it finds support and rises, consider this the final uptrend and focus on finding a time to take profits.
This is because, as mentioned in the explanation of the BTC big picture, 2026 is expected to be a major bear market.
-
Thank you for reading to the end.
I wish you successful trading.
--------------------------------------------------

#ETH Reaches Resistance Zone📊#ETH Reaches Resistance Zone ⚠️
🧠From a structural perspective, we are still in a daily-level correction phase, so the downside risk remains. The price is currently near the red resistance zone and the lower trendline, so I believe it's reasonable to participate in some short positions.
⚠️If we break through the lower trendline and the red resistance zone, then this bearish view will be invalidated.
Let's see 👀
🤜If you like my analysis, please like 💖 and share 💬
BITGET:ETHUSDT.P

Next Volatility Period: Around January 1, 2026
Hello, traders!
Follow us to get the latest information quickly.
Have a great day!
-------------------------------------
(ETHUSDT 1D Chart)
This volatility period is expected to last until December 17th.
To initiate an uptrend, the price must rise above the M-Signal indicator on the 1M chart and remain stable.
In this sense, the key is whether the price can find support near 2887.66 and rise above 3025.27 to maintain its upward momentum.
However, a full-scale uptrend is expected to begin only if the price rises above the HA-High ~ DOM (60) range on the 1M chart (3321.30-3438.16).
-
From a trading perspective, trading below the M-Signal indicator on the 1M chart is difficult, so if possible, it's best to find a trading opportunity around 3025.27 based on the presence of support.
In the medium to long term, you can buy in installments whenever support is found near the DOM (-60) ~ HA-Low range.
Therefore, the timing for buying in installments is until support is found near 2770.12-2887.66.
However, if the price declines from the DOM(-60) to HA-Low range, a step-down trend is likely, so you should consider a countermeasure.
In other words, if you bought when the price was supported near the DOM(-60) to HA-Low range, you can sell a portion of your holdings when the price rises and then begins to decline, leaving the coins (tokens) corresponding to the profit. This can be done in installments.
-
To sustain the uptrend from a long-term perspective, the price must be maintained above 2419.83-2706.15.
If this fails and the price declines, a long-term downtrend is likely, so you should consider a countermeasure.
There are two types of declines:
1. Normal Decline
This occurs when the price rises from the DOM(-60) to HA-Low range, forms the HA-High to DOM(60) range, and then declines.
This decline is likely to continue until it reaches the DOM(-60) or HA-Low indicators, making it difficult to gauge the actual extent of the decline.
Therefore, during a normal decline, it's difficult to determine the timing of a partial purchase, so caution is advised when making a purchase.
However, other indicators and support and resistance levels can be used to estimate the timing.
2. Staircase Decline
This refers to a further decline from the DOM(-60) to HA-Low range.
Therefore, if the decline continues, the DOM(-60) or HA-Low indicators will eventually be encountered again, allowing for the timing of a partial purchase.
However, because it's impossible to predict the frequency of this decline, split trading is necessary.
When making a split trade, it's important to increase the number of coins (tokens) corresponding to the profit by engaging in short-term trading (day trading) at each split purchase price.
At the same time, you should recover a portion of your principal to secure funds for future split purchases.
-
Among the declines mentioned above, the moment we should be interested in is when the second step decline occurs.
In other words, it's worth considering trading when the DOM(-60) or HA-Low indicators are met.
-
Thank you for reading to the end.
I wish you successful trading.
--------------------------------------------------

Check if the price remains above 2887.66
Hello, fellow traders.
If you "Follow" me, you'll always receive the latest information quickly.
Have a great day.
-------------------------------------
(ETHUSDT 1D Chart)
The HA-Low indicator on the 1D chart is showing signs of forming at 2887.66.
Since the HA-Low indicator previously formed at 3472.96 and is showing signs of forming again, determining whether support at 2887.66 is crucial.
Furthermore, since the indicator is located near the M-Signal indicator on the 1M chart, we need to see if the price can maintain its upward momentum above the M-Signal indicator on the 1M chart.
In this sense, a rise above the previous HA-Low indicator level of 3472.96 is expected to trigger an uptrend.
Therefore, to ensure that the uptrend continues after breaking above a key point or range, we need to monitor whether the StochRSI, TC, and OBV indicators remain in an upward trend.
Since the OBV indicator has fallen below the EMA 3, it must rise above and remain above the EMA 3 level.
We need to confirm whether the price can rise above the M-Signal indicator on the 1M chart after passing through this volatility period around November 27th (November 26th-28th).
-
Thank you for reading.
We wish you successful trading.
--------------------------------------------------

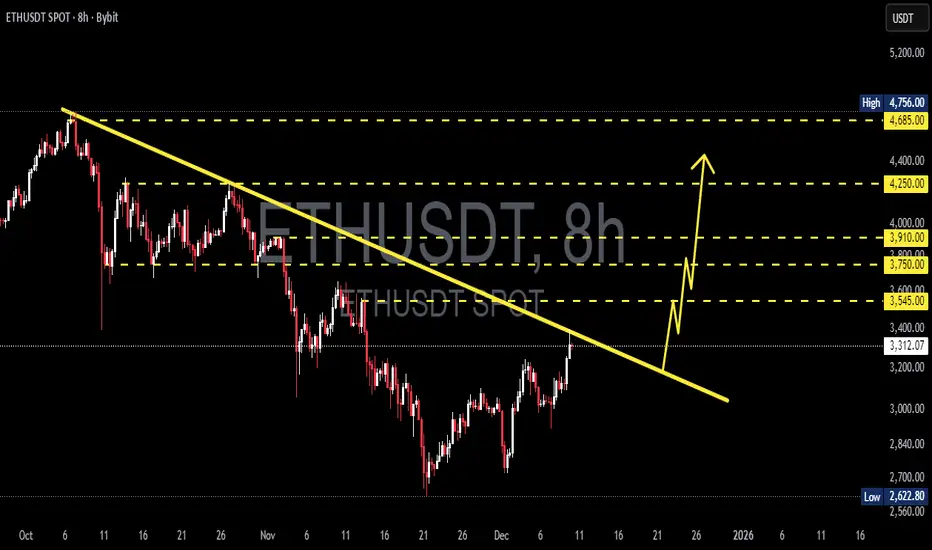
ETH/USDT — This Trendline Will Decide the Next Major MoveETH is now sitting at the most crucial level of Q4 —
directly attacking the descending trendline that has rejected every rally since early October.
This is not just a trendline.
This is the wall separating ETH from a full momentum breakout.
---
🔍 What’s Really Happening on the Chart?
ETH has formed a sequence of higher lows, showing growing buyer strength.
The descending trendline (yellow) remains the final defense for the bears.
Several major resistance zones above (3,545 → 3,750 → 3,910 → 4,250 → 4,685) are aligned perfectly if a breakout confirms.
Price is now sitting at a decision zone, and markets often expand aggressively after setups like this.
In simple terms:
ETH is preparing for a big move — only the direction is yet to be chosen.
---
🔥 Bullish Scenario — A Breakout That Changes Everything
If ETH manages to:
1. Close an 8H candle above the trendline, and
2. Show a clean retest afterward,
then a bullish expansion could unfold toward:
🎯 3,545 — first breakout confirmation
🎯 3,750 — structural shift
🎯 3,910 — major resistance
🎯 4,250 — expansion zone
🎯 4,685 – 4,756 — full breakout target
Trendline breaks like this often mark the start of large impulsive rallies, especially with rising volume.
---
⚠️ Bearish Scenario — A Sharp Rejection
If the trendline rejects price and the candle closes back below it:
ETH forms another lower high,
Bearish structure resumes,
Downside targets come into play:
🔻 3,000 – 2,840
🔻 2,700
🔻 2,622 (major support)
A rejection here frequently creates strong downward continuation, as this trendline is widely watched.
---
🎯 Key Takeaway
This is the most important ETH setup of the past several weeks.
Breakout → bullish momentum wave.
Rejection → trend continuation downward.
This level will likely dictate ETH’s direction going into early 2026.
For aggressive traders, this is an opportunity.
For conservative traders, this is a wait-for-confirmation zone.
#Ethereum #ETH #ETHUSDT #CryptoAnalysis #PriceAction #Breakout #Trendline #CryptoMarkets #Altcoins
#ETH/USDT (1h) (spot)#ETH
The price is moving in a descending channel on the 1-hour timeframe. It has reached the lower boundary and is heading towards a breakout, with a retest of the upper boundary expected.
We are seeing a bearish trend in the Relative Strength Index (RSI), which has reached near the lower boundary, and an upward bounce is expected.
There is a key support zone in green at 2970, and the price has bounced from this level several times. Another bounce is expected.
We are seeing a trend towards stabilizing above the 100-period moving average, which we are approaching, supporting the upward trend.
Entry Price: 30019
First Target: 3058
Second Target: 3124
Third Target: 3202
Remember a simple principle: Money Management.
Place your stop-loss order below the green support zone.
For any questions, please leave a comment.
Thank you.

ETH Demand Zone Activated: Trend Shift or Dead Cat?CRYPTOCAP:ETH 3Days Technical Analysis:-
ETH is showing a steady bounce after tapping the 0.618 Fib level, which aligns perfectly with the FVG (green zone) acting as a strong demand area.
Price reclaimed the trendline breakdown region and is now holding above the key support zone.
A sustained move above $3,175 (0.5 Fib) could open the door for a retest of $3,596 (0.382 Fib).
Structure will remain intact as long as ETH stays above the FVG block.
Levels to watch:
• Support: $2,750 – $2,850 (FVG / 0.618 Fib)
• Resistance: $3,175 → $3,596
DYOR / NFA
Please hit the like button if this post helped you in any way.
Thank you.
#PEACE

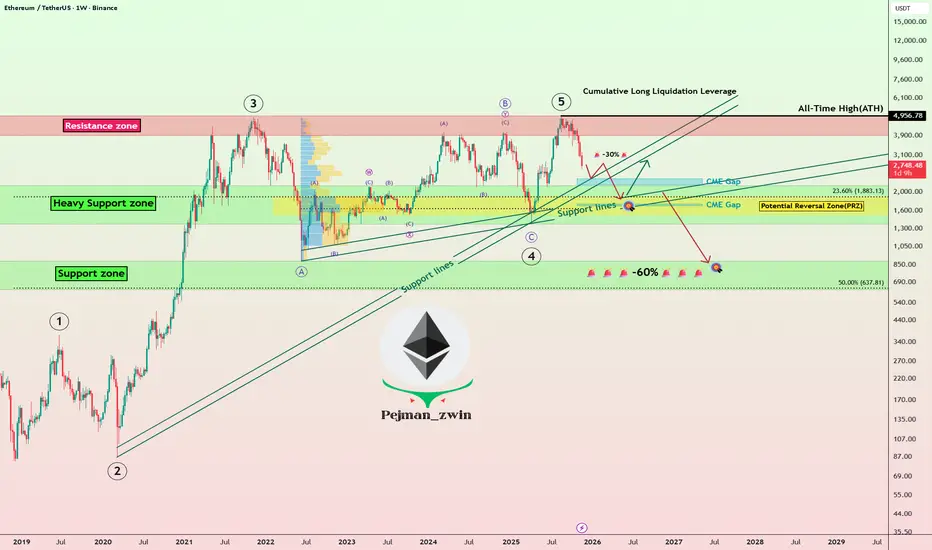
Ethereum Roadmap: Will ETH Bounce or Begin a Deeper Correction!?Today, I’d like to dive into an analysis of Ethereum ( BINANCE:ETHUSDT ). Given that over 80% of tokens in the crypto market are built on the Ethereum blockchain, Ethereum’s performance can serve as a roadmap for other tokens on the network.
So, stay tuned!
In recent times, Ethereum hasn’t been able to keep pace with Bitcoin’s growth and struggled to set a new All-Time High(ATH=$4,956). After Bitcoin’s decline, Ethereum also started to drop and is currently moving near the Heavy Support zone($2,160-$1,370), Support lines, Cumulative Long Liquidation Leverage($1,745-$1,629), and Potential Reversal Zone(PRZ) .
From an Elliott Wave perspective, it seems that Ethereum has completed its main five-wave impulsive. This suggests that we might now be entering a corrective phase. The extent of this correction will depend on multiple factors, and technical analysis alone won’t predict the exact magnitude of Ethereum’s decline in the coming days or weeks. Nonetheless, I’ll keep you updated step-by-step.
Looking at the USDT.D%( CRYPTOCAP:USDT.D ), it’s currently on an upward trend. This rising dominance can lead to further declines in Ethereum, reinforcing the bearish outlook.
Another important index is the US 10-Year Government Bond Yield ( TVC:US10 ). If the US 10-Year Government Bond Yield continues its upward movement, it can put additional pressure on risk assets like Bitcoin( BINANCE:BTCUSDT ) and Ethereum, leading to further declines.
Now, the question is: where might we see Ethereum resume its upward trajectory?
It’s likely that Ethereum will continue its downward movement(-30%), potentially filling the CME Gap($2,344-$2,186), CME Gap($1,745-$1,629) near the $2,000(Round Number). Once it stabilizes around that zone, we could look for signs of a recovery.
However, if Ethereum breaks below its Heavy Support zone($2,160-$1,370), we might face even more significant declines, potentially exceeding -60%.
Where do you think Ethereum will start to rise again? Or are more red days ahead?
💡 Please respect each other's opinions and express agreement or disagreement politely.
📌Ethereum Analyze (ETHUSDT), Weekly time frame.
🛑 Always set a Stop Loss(SL) for every position you open.
✅ This is just my idea; I’d love to see your thoughts too!
🔥 If you find it helpful, please BOOST this post and share it with your friends.
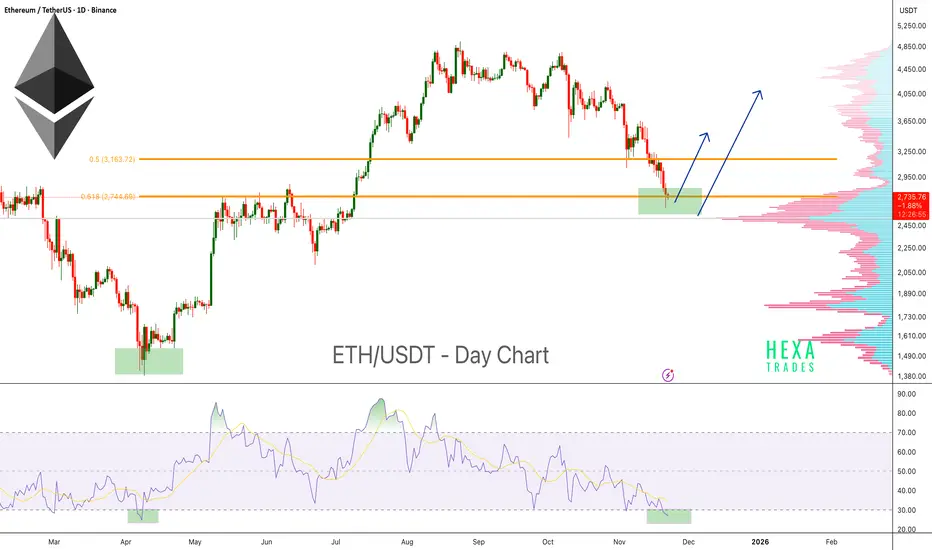
Ethereum Approaching Reversal Zone!Ethereum is currently trading at a major support zone, an area where price has historically shown strong reactions and multiple bounces. This demand zone has acted as a key reversal region several times, and ETH is once again testing it.
Price is also sitting near the 0.618 Fibonacci retracement (Golden Zone), which is commonly used to identify potential reversal points during market corrections.
The Volume Profile shows a high-volume node exactly at the current support area, indicating strong interest and previous accumulation. This increases the probability that this zone will act as a strong support.
On the momentum side, the RSI has entered oversold territory once again. Historically, whenever ETH’s daily RSI dipped below 30, it marked strong bottom areas followed by significant bounces.
Key Highlights
- ETH retesting a major historical support zone.
- Trading inside the 0.618 Fibonacci Golden Zone.
- Daily RSI oversold (<30) — historically a strong bounce region.
- Volume Profile high-volume node aligns with support, increasing the strength of the zone.
- Potential for a short-term reversal if the support continues to hold.
Cheers
Hexa
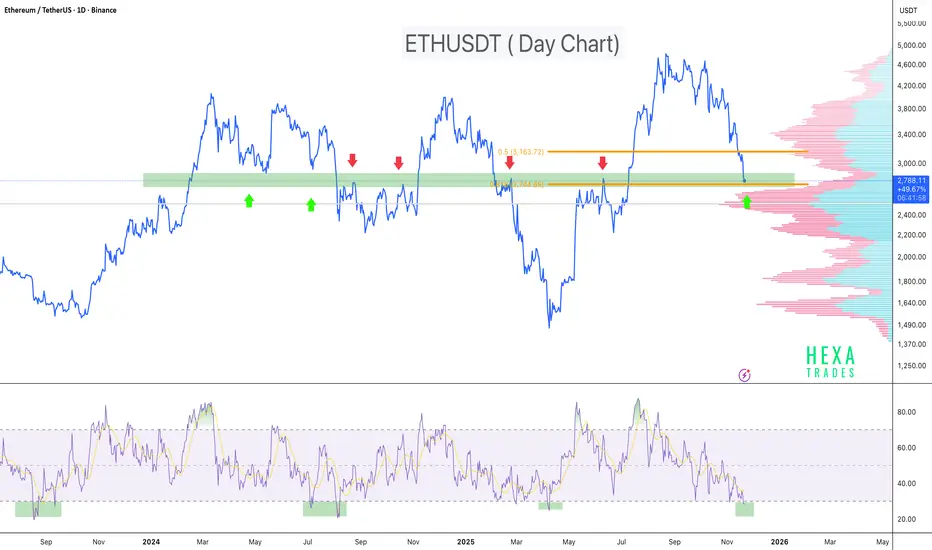
ETH : Oversold RSI + Fib Golden Zone = High-Probability ReversalETH is currently trading inside a major historical support zone, an area where price has repeatedly been rejected and bounced in the past. This level has acted as a strong demand zone multiple times, and the price is once again testing it.
On the momentum side, the RSI has dipped below 30 on the daily chart. Historically, every time ETH’s RSI dropped into the oversold region, it marked a strong bottom formation followed by a notable bounce.
Price is also sitting inside the Fibonacci golden zone, adding further confluence that this area could act as a potential reversal point.
Key Points:
- Strong multi-tested support zone
- Price reacting inside the Fib golden pocket
- Daily RSI oversold (<30) - historically reliable bottom signal for ETH
- High probability bounce zone if the support holds
- This is a critical level to watch for bullish reactions or early reversal signals.
Cheers
Hex
EthereumETHUSD
- Completed " 12345 " Impulsive Waves
- Consolidation Phase as an corrective pattern in Short Time Frame
- Break of Structure
- RSI - Divergence
- Change of Characteristics

Checking for support near 3472.96
Hello, traders!
Follow us to get the latest information quickly.
Have a great day!
-------------------------------------
(ETHUSDT 1D chart)
This period of volatility is expected to last until November 14th.
After this period of volatility, the key question is whether the price can rise after gaining support near the HA-Low indicator (3472.96) on the 1D chart.
At this point, it's crucial to see if the price can rise above the M-Signal indicator on the 1W chart and maintain its upward momentum.
If the price fails to rise, it is expected to meet the M-Signal indicator on the 1M chart again.
Therefore, to continue the uptrend, the price must remain above the 3239.06-3472.96 level.
The formation of the HA-Low indicator on the 1D chart indicates a significant decline, forming a low.
Therefore, even if the downtrend continues, there's a possibility of an eventual uptrend, so we need to consider countermeasures.
However, if the price meets the HA-High indicator on the 1D chart or falls near the HA-High level, the price is likely to decline until it meets the HA-Low indicator again or the DOM (-60) indicator.
Therefore, we must remember the basic trading strategy of buying in the DOM(-60) ~ HA-Low range and selling in the HA-High ~ DOM(60) range.
If the HA-High ~ DOM(60) range rises, a stepwise upward trend is likely, while if the DOM(-60) ~ HA-Low range falls, a stepwise downward trend is likely.
Therefore, the basic trading strategy should be a segmented trading approach.
To determine trading within the box range and trend trading outside the box range, we refer to the additional auxiliary indicators, StochRSI, TC (Trend Check), and OBV.
To continue the uptrend by breaking above a key point or range, the StochRSI, TC, and OBV indicators must show upward trends.
1. The StochRSI indicator should not have entered the overbought zone.
2. The TC indicator should remain above 0. 3. The OBV indicator should remain above the High Line.
Therefore, it's important to observe the movement around important points or ranges, such as the DOM(-60) ~ HA-Low and HA-High ~ DOM(60).
The next period of volatility will be around November 20th.
-
Thank you for reading to the end.
I wish you successful trading.
--------------------------------------------------

ETHUSDT: Rebound Setup from Broadening Wedge SupportETH is currently respecting the lower boundary of a broadening wedge pattern, a structure known for sharp reversals once price taps the support zone. The latest reaction shows buyers defending this area, indicating a potential upside move.
Entry: Current support area of the broadening wedge, below $3200
Stop-Loss: $2900
Take-Profit: 10%, 20% , 40%
Cheers
Hexa

Ethereum Bulls Defending $3,500 Zone – Time to Rise?Today, I want to walk you through a quick 15-minute timeframe analysis of Ethereum ( BINANCE:ETHUSDT ), so stick around.
Right now, Ethereum is hovering near a Support zone($3,520-$3,348) and a Cumulative Long Liquidation Leverage($3,507-$3,460) .
From an Elliott Wave standpoint, it seems like Ethereum is wrapping up a microwave Y of the main wave 4.
Also, looking at the ETHBTC ( BINANCE:ETHBTC ) chart, Ethereum is in a favorable position there as well, which suggests that if Bitcoin ’s( BINANCE:BTCUSDT ) price increases, Ethereum might see an even stronger upward move.
My expectation is that in the coming hours, Ethereum can resume its bullish trend , push up toward the Resistance lines , and then aim for the next Resistance zone($3,726-$3,649) .
First Target: $3,631
Second Target: $3,665
Third Target: $3,707
Stop Loss(SL): $3,449
CME Gap: $3,513-$3,483
Cumulative Short Liquidation Leverage: $3,715-$3,671
Please respect each other's ideas and express them politely if you agree or disagree.
Ethereum Analyze (ETHUSDT), 15-time frame.
Be sure to follow the updated ideas.
Do not forget to put a Stop loss for your positions (For every position you want to open).
Please follow your strategy and updates; this is just my Idea, and I will gladly see your ideas in this post.
Please do not forget the ✅' like '✅ button 🙏😊 & Share it with your friends; thanks, and Trade safe.

ETH/USDT — Golden Zone: Major Reversal or Deeper Correction!The 1W chart of Ethereum (ETH/USDT) displays a clear Elliott Wave impulsive structure, with the price currently moving within Wave (4) — a corrective phase that often determines whether the main trend will continue or reverse.
The 3,630–3,200 USDT yellow zone acts as a critical battleground where long-term buyers and short-term sellers collide. This zone will define whether Ethereum is preparing for its next major rally or entering a prolonged correction.
---
Structure and Key Pattern
Elliott Wave Count: Waves (1), (2), and (3) are complete; price is now in Wave (4), which typically precedes the final impulsive move (5) if the structure remains valid.
Golden Pocket Zone (0.5–0.618 Fib): The range between 3,630–3,200 is the golden retracement zone — a region where high-probability reversals often form.
Historical Flip Zone: This same area served as a major resistance during 2021–2022 and now acts as structural support, making it an extremely important pivot level.
Volume Profile: Historically, this zone attracts accumulation before a large breakout, indicating potential institutional interest.
---
Bullish Scenario — The Start of Wave (5)
If Ethereum holds above the yellow zone and prints a strong reaction, the structure supports a continuation rally toward new highs as Wave (5) develops.
Bullish Triggers
1. Strong rejection candles (e.g., long lower wick or bullish engulfing) from 3.2–3.6k zone.
2. Confirmation occurs once price reclaims 4.1k and breaks above 4.7k with weekly close.
3. First target: 4.95k (previous ATH resistance).
4. Extended targets: If momentum is strong, Fibonacci extensions point toward 6k–9k zones — marking the full completion of Wave (5).
5. Increasing weekly volume during breakout strengthens the bullish continuation signal.
> Bullish Summary:
As long as price stays above 3,200, the impulsive Elliott structure remains intact — making this zone a potential launchpad for the next major Ethereum rally.
---
Bearish Scenario — Breakdown and Deeper Correction
If price fails to hold the 3,200 support and breaks below, the impulsive structure will be invalidated, signaling a possible larger corrective phase (A–B–C).
Bearish Triggers
1. Weekly close below 3,200 confirms support breakdown.
2. Next target would be ~2,700 USDT — the next key support zone.
3. If bearish momentum continues, the price could extend lower toward 1,700–900 USDT (0.786–0.886 retracement).
4. The structure then transitions from an impulsive rally into a corrective macro phase, indicating that the larger bullish wave is temporarily over.
> Bearish Summary:
A weekly close below 3,200 signals structural failure and the start of a long-term distribution or deeper correction phase before forming a new accumulation base below 3k.
---
Visual Interpretation
5-Wave Impulsive Pattern: Indicates that the macro trend remains bullish until 3,200 breaks.
Yellow Zone = Decision Point: This “golden battlefield” determines whether Ethereum resumes its major uptrend or shifts into correction.
If strong bounce occurs, a parabolic Wave (5) could unfold — usually accompanied by extreme optimism and renewed market euphoria.
---
Trading Strategy & Risk Management
Use weekly timeframe for structural confirmation; use daily for precise entries.
Scaling strategy: Gradually build positions within 3.63–3.2k zone; add more upon bullish weekly close.
Stop-loss: Below 3.1k to protect structure integrity.
Conservative approach: Wait for breakout above 4.7k before confirming trend continuation.
Keep an eye on macro news and Ethereum ecosystem updates, which could add volatility beyond technical patterns.
---
Final Takeaway
> Ethereum stands at its Golden Crossroads — between renewal and decline.
If the 3.630–3.200 zone holds, ETH could ignite Wave (5) and push toward new all-time highs (6k–9k).
But if it breaks, the market might enter a deep corrective phase lasting months.
This zone will likely decide Ethereum’s direction for the next 6–12 months.
#Ethereum #ETHUSDT #CryptoTA #ElliottWave #CryptoAnalysis #TechnicalAnalysis #ETHPrice #Fibonacci #CryptoTrading #BullishScenario #BearishScenario #CryptoInvesting

See if it finds support near 3321.30 and can rise
Hello, fellow traders!
Follow us for quick updates.
Have a great day.
-------------------------------------
(ETHUSDT 1D chart)
There's no change from what I mentioned in my previous idea.
The M-Signal indicator on the 1M chart has been touched, so the trend will be re-determined.
At this point, it's crucial to check for support near the Fibonacci 0.618 (3239.06) - 3438.16 range.
If support fails and the price falls below the M-Signal indicator on the 1M chart, support should be checked around the 2419.83-2706.15 range.
-
Since the TC (Trend Check) indicator has touched its lowest point, a rebound is highly likely.
Therefore, determining support near the critical Fibonacci 0.618 (3239.06) - 3438.16 range is more important than ever.
Currently, ETH is in a period of volatility.
Therefore, we need to monitor the movement until November 6th.
The next period of volatility is around November 13th.
-
Thank you for reading.
We wish you successful trading.
--------------------------------------------------
ETH/USD: Latest Wave Impulse (5) or Extended Correksi Slide?ETH/USD: Latest Wave Impulse (5) or Extended Correksi Slide?
📈 Weekly Scenarios
Bullish scenario: ETH holds the ~$3,800 zone, then breaks through ~$4,500 → wave (5) begins → moves towards ~$5,000+.
Consolidation: The price moves in the ~$3,800–$4,500 range without a clear breakout.
Bearish scenario: Breakout of support at ~$3,800 with volume → corrective wave A-B-C → target ~$3,400–$3,600.
✅ Conclusion
The weekly analysis of ETH/USD shows that the market is at a key point: either a strong rally (wave (5)) is beginning, or a correction is underway.
Holding support at ~$3,800 is critical for the bulls.
A breakout of resistance at ~$4,500 will provide upward momentum.
A breakout below ~$3,800 is a signal for caution and a possible decline.

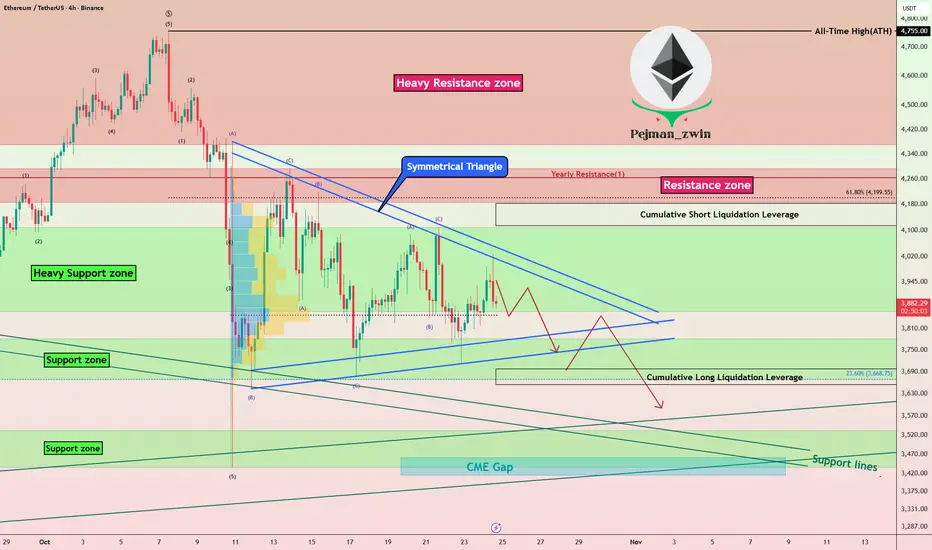
Ethereum in Symmetrical Triangle – Next Big Move Coming?Let’s take a look at Ethereum ( BINANCE:ETHUSDT ) on the 4-hour timeframe . Recently, Ethereum dropped by over -20% during the latest crypto market sell-off but has since started to recover. Right now, it appears to be in a corrective pattern, moving inside a Symmetrical Triangle Pattern .
Currently, Ethereum is testing a Heavy Support zone($4,107-$3,860) , and a break below that zone, confirmed by breaking the lower lines of the symmetrical triangle , could signal further downside.
Note: In general, a Symmetrical Triangle is a continuation pattern, and since the prior trend was downward, we might expect more downside if the broader crypto market continues to decline.
Before concluding, let’s also glance at the ETHBTC ( BINANCE:ETHBTC ) pair on the daily timeframe . It looks like ETHBTC has been in a downtrend and might revisit its support zone once more. That suggests if Bitcoin declines, Ethereum could see even more pressure .
In conclusion, I expect Ethereum to drop at least to its Support lines and Support zone($3,532-$3,436) after breaking the lower lines of the symmetrical triangle. There's also a CME Gap($3,461-$3,417) that might get filled.
Note: Keep in mind that weekend trading volumes are often lower, so the breakdown might not happen immediately. However, if tensions between the US and Venezuela escalate, we could see a sharper reaction even over the weekend.
First Target: $3,764
Second Target: $3,597
Stop Loss(SL): $4,044
Cumulative Short Liquidation Leverage: $4,182-$4,114
Cumulative Long Liquidation Leverage: $3,697-$3,3654
Please respect each other's ideas and express them politely if you agree or disagree.
Ethereum Analyze (ETHUSDT), 4-hour time frame.
Be sure to follow the updated ideas.
Do not forget to put a Stop loss for your positions (For every position you want to open).
Please follow your strategy and updates; this is just my Idea, and I will gladly see your ideas in this post.
Please do not forget the ✅' like '✅ button 🙏😊 & Share it with your friends; thanks, and Trade safe.
The key is whether it can rise above 4403.87
Hello, traders.
Follow us to get the latest information quickly.
Have a great day.
-------------------------------------
(ETHUSDT 1W chart)
The formation of an upward trend line (A) created an upward channel from (A) to (B).
Therefore, the key is whether it can continue to rise along this upward trend line.
If the upward movement fails, we need to check whether the price rises along the rising trend lines (1) and (2).
Therefore, the 3900.73-4107.80 range is a crucial area for sustaining the upward trend.
In this context, we expect a significant period of volatility to begin around the week of November 24th.
This period of volatility could continue until around the week of January 12th, 2026.
-
(1M Chart)
If this month closes with a bearish candle, forming an upward trend line (a), the key question is whether the price can rise along trend line (a).
If not, there's a possibility of touching the upward trend line (2), so we need to consider a response plan.
-
(1D Chart)
The key is whether the price can sustain above the uptrend line (1) and rise above 4403.87.
To do this, we need to see if it can break above the downward channel created on the 1D chart.
Therefore, we need to observe how the price moves after the volatility period around November 5th.
The HA-High ~ DOM(60) section (4393.04-4780.15) on the 1W chart overlaps with the HA-High ~ DOM(60) section (4403.87-4749.30) on the 1D chart, so it's likely to act as resistance.
------------------------------------
The basic trading strategy is to buy in the DOM(-60) ~ HA-Low section and sell in the HA-High ~ DOM(60) section.
However, if the price rises from the HA-High to DOM(60) range, a step-like uptrend is likely, while if it falls from the DOM(-60) to HA-Low range, a step-like downtrend is likely.
Therefore, a split trading strategy is recommended.
To maintain a step-like uptrend in the DOM(-60) to HA-Low range,
1. The StochRSI indicator must be rising. If possible, it should not enter the overbought zone.
2. The On-By-Value (OBV) indicator must be rising. If possible, it should remain above the High Line.
3. The TC (Trend Check) indicator must be rising. If possible, it should remain above the 0 level.
If the above conditions are met, the uptrend is likely to continue.
If not, a high point is likely to form, so you should consider a countermeasure.
-
Thank you for reading to the end.
I wish you successful trading.
--------------------------------------------------

ETH/USD: Is Ethereum Entering Wave V or Preparing for a ReversalETH/USD: Is Ethereum Entering Wave V or Preparing for a Reversal?
Weekly Scenarios
Bullish scenario: ETH holds the $3,800 level, breaks $4,500 → target near $5,000.
Consolidation: The price fluctuates between $3,800 and $4,500, preparing for the next move.
Bearish scenario: Break of support at $3,800 with volume → possible decline to $3,400–$3,600.
✅ Conclusion
The weekly analysis of ETH/USD shows that the market is at a key point: either the final uptrend is starting, or a correction is forming.
Holding support near $3,800 is the main bullish signal.
Break of resistance at $4,500 is the start of a rally.
A break below $3,800 is a signal for caution and a possible decline.

ETHUSDT: Possible Minor to Major Corrections May HappenETHUSDT has a higher chance of experiencing a minor or major correction in the coming days, although we haven’t confirmed this yet. We need more confirmation before we can be certain about the future of ETH. However, if the price decides to undergo a major correction, it’s likely to drop to our second area, where it’s expected to fill the liquidity gap and then reverse, continuing towards our three targets.
Please use this analysis as secondary bias only or even only for educational purposes. Always conduct your own analysis and risk management before trading or investing in cryptocurrencies, as they carry significant financial risk. Good luck and trade safely.
If you want to support us, you can do so by liking the idea, commenting with your views, or sharing it.
Much love ❤️
Have a great weekend
Team Setupsfx_

ETH: Still be a need for a pullback📈The closing price yesterday failed to hold above 3,950. There will still be a need for a pullback.
♦Market sentiment remains cautious, with long and short sides locked in a stalemate. From a technical pattern perspective, there is a trend of lower highs and lower lows in prices. If the current structure cannot be broken, market risks will persist.
💎
Buy 3855 - 3860 TP 3870 - 3890 - 3910 SL 3845
Sell 3900 - 3910 TP 3890 - 3870 - 3850 SL 3920
Daily-updated accurate signals are at your disposal. If you run into any problems while trading, these signals serve as a reliable reference—don’t hesitate to use them! I truly hope they bring you significant assistance
