ETHUSDT: Bearish Drop to 2840?BINANCE:ETHUSDT is eyeing a bearish reversal on the 1-hour chart , with price testing a key resistance zone near cumulative sell liquidation, converging with a potential entry area that could trigger downside momentum if sellers defend against further upside. This setup suggests a pullback opportunity amid recent consolidation, targeting lower support levels with near 1:3 risk-reward .🔥
Entry between 3020–3040 for a short position. Target at 2840 . Set a stop loss at a close above 3090 📊, yielding a risk-reward ratio of near 1:3 . Monitor for confirmation via a bearish candle close below entry with rising volume, leveraging Ethereum's volatility near highs.🌟
📝 Trade Setup
🎯 Entry (Short):
3020 – 3040
🎯 Target:
• 2840
❌ Stop Loss:
• Close above 3090
⚖️ Risk-to-Reward:
• ~ 1:3
💡 Your view?
Does ETH reject 3040 and slide toward 2840 — or will buyers absorb supply and push higher?
👇 Share your thoughts below 👇
Ethusdtshort

ETH/USDT Bearish Roadmap: Structure + MA Break AligningAsset: ETH/USDT — “Ethereum vs Tether”
Market Context: Crypto Market | Swing Trade | Bearish Profit Pathway Setup
📉 Market Outlook: Bearish Plan Confirmed
Ethereum is displaying a bearish continuation structure, with price breaking below the Triangular Moving Average zone, signaling shifting momentum from buyers to sellers. Market structure is weakening, liquidity is building above the recent highs, and major supports remain untested below.
This creates a clean swing-trade opportunity for disciplined traders.
🎯 Trade Plan: Thief Layered Entry Strategy
The plan uses a layered sell-limit approach to capture premium retracement entries.
🧩 Sell-Limit Layers (Short Entry Zones):
1st Layer: 3200
2nd Layer: 3100
3rd Layer: 3000
(Traders may add additional layers depending on preference, liquidity, and volatility.)
Layering helps reduce emotional entry pressure and allows scaling into premium short zones rather than rushing into the move.
🛑 Stop-Loss: Structural SL @ 3300
This is the Thief SL reference level at 3300, positioned above structural liquidity.
Ladies & Gentlemen (Thief OG’s): adjust SL according to your own risk tolerance, capital, and strategy framework.
Risk is personal — protect your account.
🏆 Target Zone: 2700
The downside objective aligns with:
Strong support retest
Oversold region confluence
Trap-pattern breakdown
Correlation pressures across major crypto pairs
Ladies & Gentlemen (Thief OG’s): this is a community target reference — take profit based on your own comfort and risk appetite. Profit is profit.
🔍 Related Pairs to Watch (Correlation Insights)
1️⃣ BTC/USDT ( CRYPTOCAP:BTC )
Bitcoin leads crypto directional momentum.
ETH generally mirrors BTC swings with slightly slower volatility.
If BTC struggles to reclaim resistance zones, ETH downside probability strengthens.
2️⃣ ETH/BTC ( BINANCE:ETHBTC )
Key ratio indicating Ethereum’s strength vs Bitcoin.
ETHBTC downtrend continues → ETHUSD bearish continuation becomes more reliable.
3️⃣ SOL/USDT ( CRYPTOCAP:SOL )
Strong competitor in Layer-1 ecosystem.
SOL weakness often reflects broader market appetite decreasing → ETH follows.
4️⃣ TOTAL2 (Altcoin Market Cap)
Tracks overall strength of altcoins excluding BTC.
Breakdown in TOTAL2 = bearish environment = supports ETH downside targets.
Monitoring these pairs provides confirmation of:
Trend alignment
Market-wide weakness
Strength of bearish momentum
Liquidity flows across majors
✅ Final Notes
This setup is built for traders who prefer structured entries, disciplined layers, clear SL zones, and realistic targets.
Trade smart, manage risk, and follow your own strategy refinement.

EthereumETHUSD
- Completed " 12345 " Impulsive Waves
- Consolidation Phase as an corrective pattern in Short Time Frame
- Break of Structure
- RSI - Divergence
- Change of Characteristics

ETH Trend: 3000→2820→3400ETH has staged a minor rebound but is set for another sharp pullback.
Focus on the support at 3000 – a break below this level will lead to a further decline to around 2820, where strong support is anticipated.
It will then rebound and break above 3400 to resume the uptrend.
Accurate signals updated daily. They serve as a reliable guide for trading issues – feel free to refer to them. Hope they help!

ETH: Range-Bound, But Breakdown Could Get UglyOn the CRYPTOCAP:ETH daily chart, the mid-zone is acting as a clear barrier. The price is currently consolidating within a range, caught between the key support zone and this mid S/R zone.
A breakout above could trigger a strong move higher, while a breakdown here would be a scary scenario for the overall market.
DYOR, NFA
Thanks for reading! Appreciate your support and engagement 🙏

ETH/USD: Is Ethereum Entering Wave V or Preparing for a ReversalETH/USD: Is Ethereum Entering Wave V or Preparing for a Reversal?
Weekly Scenarios
Bullish scenario: ETH holds the $3,800 level, breaks $4,500 → target near $5,000.
Consolidation: The price fluctuates between $3,800 and $4,500, preparing for the next move.
Bearish scenario: Break of support at $3,800 with volume → possible decline to $3,400–$3,600.
✅ Conclusion
The weekly analysis of ETH/USD shows that the market is at a key point: either the final uptrend is starting, or a correction is forming.
Holding support near $3,800 is the main bullish signal.
Break of resistance at $4,500 is the start of a rally.
A break below $3,800 is a signal for caution and a possible decline.

ETHUSD: Last Wave of Impulse or Start of a Big Correction?Weekly Scenarios
Bullish scenario:
ETH holds above ~$3,800 and breaks resistance at ~$4,500 → wave factor (5) intensifies → possible rise to ~$5,000.
Consolidation:
The price remains between ~$3,800 and ~$4,500, forming a sideways range, accumulating energy for the next move.
Bearish scenario:
Breakdown of support at ~$3,800 with volume confirmation → corrective wave A-B-C begins → test of ~$3,400–3,600.
✅ Conclusion
ETH/USD is at a key point for the coming week: either the bullish upward momentum ends, or a significant correction begins.
Watch for support at ~$3,800 to hold—a breakout could very well change the direction of the movement.
If the resistance at ~$4,500 is broken, the upward momentum will activate.
Primary targets: ~$5,000 if up, ~$3,400–$3,600 if corrected.

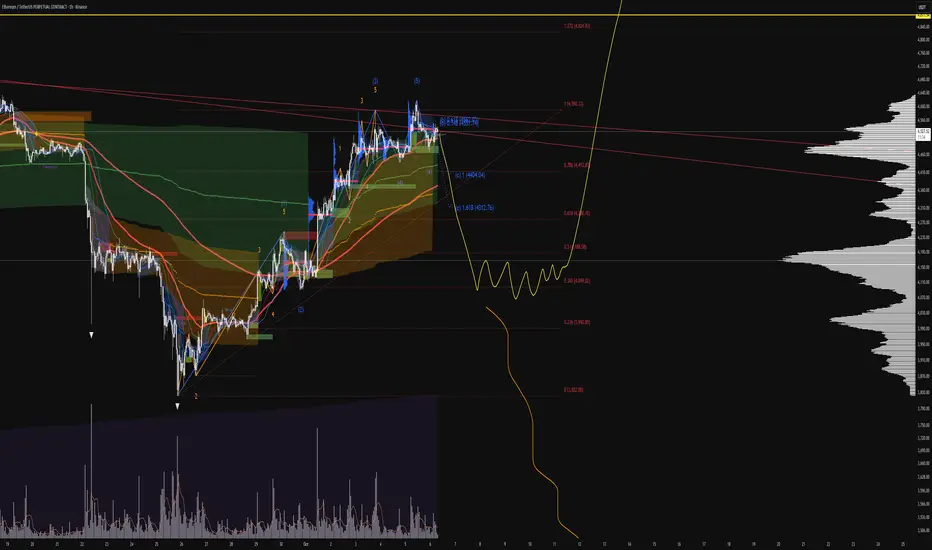
ETHUSDT: Possible Minor to Major Corrections May HappenETHUSDT has a higher chance of experiencing a minor or major correction in the coming days, although we haven’t confirmed this yet. We need more confirmation before we can be certain about the future of ETH. However, if the price decides to undergo a major correction, it’s likely to drop to our second area, where it’s expected to fill the liquidity gap and then reverse, continuing towards our three targets.
Please use this analysis as secondary bias only or even only for educational purposes. Always conduct your own analysis and risk management before trading or investing in cryptocurrencies, as they carry significant financial risk. Good luck and trade safely.
If you want to support us, you can do so by liking the idea, commenting with your views, or sharing it.
Much love ❤️
Have a great weekend
Team Setupsfx_

#ETH/USDT
#ETH
The price is moving within a descending channel on the 1-hour frame, adhering well to it, and is heading for a strong breakout and retest.
We have a bearish trend on the RSI indicator that is about to be broken and retested, which supports the upward move.
There is a major support area in green at 3900, which represents a strong support point.
We are heading for consolidation above the 100 moving average.
Entry price: 4156
First target: 4274
Second target: 4405
Third target: 4583
Don't forget a simple matter: capital management.

#ETH/USDT the Final Push Before the Parabolic Run!#ETH
The price is moving within a descending channel on the 1-hour frame, adhering well to it, and is heading for a strong breakout and retest.
We have a bearish trend on the RSI indicator that is about to be broken and retested, which supports the upward move.
There is a major support area in green at 3900, which represents a strong support point.
We are heading for consolidation above the 100 moving average.
Entry price: 4156
First target: 4274
Second target: 4405
Third target: 4583
Don't forget a simple matter: capital management.
When you reach the first target, save some money and then change your stop-loss order to an entry order.
For inquiries, please leave a comment.
Thank you.

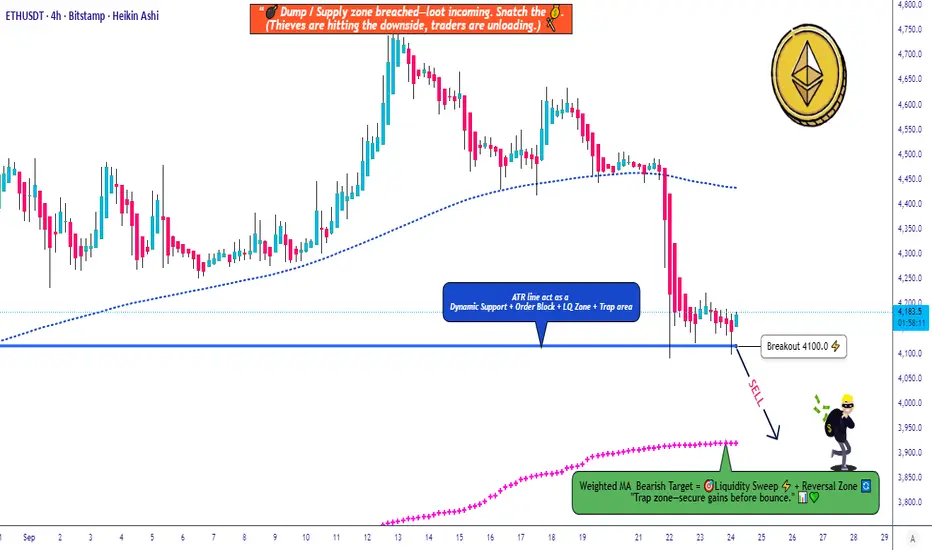
ETH/USDT Drop Plan Layered Entries + Smart EscapeETH/USDT 🚀 Market Wealth Strategy Map (Swing/Day Trade)
Market Outlook:
🔻 Bearish Confirmation: Watch for candle breakouts below the ATR Line @ 4100. This signals sellers gaining control — perfect for short entries.
Entry Plan (Thief Style 🕵️♂️):
💡 Multiple layered entries using limit orders (Thief layering strategy):
Sell layers: 4250 | 4200 | 4150 (adjust layers as per your own preference)
⚠️ Important: Set layer limit orders only after breakout confirmation. Do not enter blindly.
Stop Loss (SL):
⛔ Thief SL: 4300
Note: Dear Ladies & Gentlemen (Thief OG’s), SL is your choice — manage your risk and profits at your own discretion.
Target (TP):
🎯 Target: Weighted Moving Average Line (~3900) — strong support, oversold signals, and trap potential. Escape with profits before market catches you.
Note: TP is also your choice, manage money at your own discretion.
Related Pairs to Watch 🔗:
BINANCE:BTCUSDT : Correlated short setups, watch BTC for confirmation.
BINANCE:ETHBTC : Relative weakness/strength check vs Bitcoin.
BINANCE:BNBUSDT : Can provide additional trend confirmation in altcoin moves.
Key Points / Correlations:
ETH closely follows BTC sentiment; if BTC tanks, ETH likely follows.
Layering strategy allows flexible entries, reducing risk exposure.
Oversold + WMA support often signals profit escape zones for smart exits.
✨ “If you find value in my analysis, a 👍 and 🚀 boost is much appreciated — it helps me share more setups with the community!”
Disclaimer: This is Thief style trading strategy, just for fun.
#ETHUSDT #Ethereum #CryptoTrading #SwingTrade #DayTrade #ThiefStrategy #CryptoAnalysis #CryptoLayering #TradingViewIdeas #CryptoSetup
ETH:Plummeting sharplySince October, Ethereum has exhibited an extreme price trend of "rallying and then pulling back – plummeting sharply", reflecting violent swings in market sentiment between "optimism over technological prospects" and "macro-driven risk aversion".
The psychological levels of 3,400 and 4,000 serve as crucial short-term support. If the price breaks below 3,400, a flood of stop-loss orders may be triggered. Resistance is concentrated around 4,500 , and an effective breakout will require confirmation from increased trading volume.
In the short term, affected by lingering panic and insufficient trading volume, Ethereum is likely to consolidate within the 3,400–4,500 range. Close attention should be paid to the validity of the 3,400 support level.

ETH/USDT Bearish Continuation from Supply Zonea bearish continuation setup on Ethereum (ETH/USDT) in the 4-hour timeframe. After a strong downward impulse, the price retraced into a highlighted supply zone, suggesting a potential rejection from this resistance area. The projection shows a likely continuation of the downtrend, targeting the 3,797.51 level, with a Stop Loss positioned above the recent swing high around 4,303.62.

ETH at Critical Support: Can $3,850 Hold?CRYPTOCAP:ETH has faced a sharp rejection from the supply zone around $4,800 and is currently trading near $4,100. There's another strong support zone around $3,850.
I'm personally expecting a sharp rebound from this level. However, if the price fails to hold, we could see a further decline towards $3,600.
DYOR, NFA

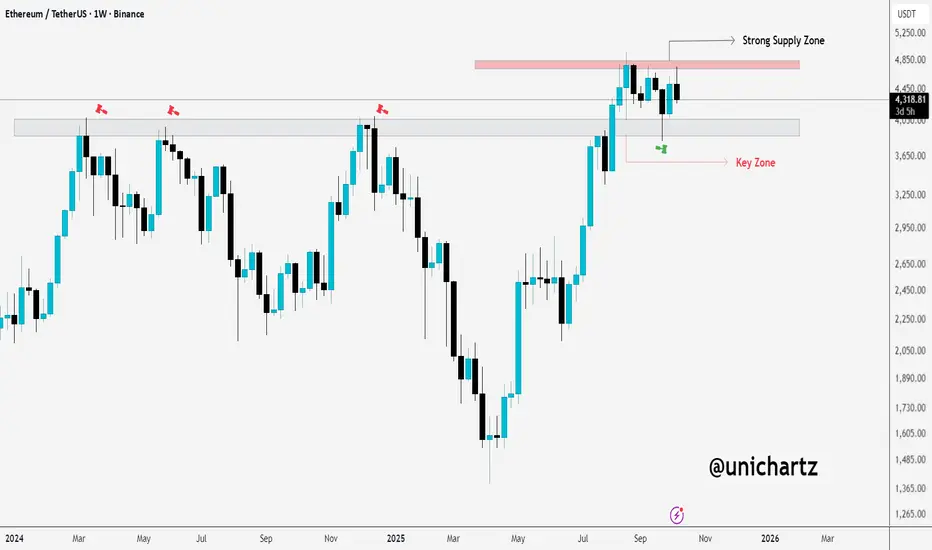
ETH: Critical Levels to Watch Now!The chart shows Ethereum ( CRYPTOCAP:ETH ) on the weekly timeframe, and we're currently at a crucial point. Ethereum is approaching a strong supply zone around $4,800, which has acted as a resistance level in the past. This suggests that the price could face selling pressure in this range. If Ethereum fails to break through this level, it might experience a pullback or sideways movement.
On the other hand, the key zone around $4,100 is providing current support. As long as this level holds, there is potential for Ethereum to attempt another move upwards toward the supply zone at $4,800. However, if the price breaks below this key support zone, we could see a deeper pullback, possibly targeting lower support levels.
#PEACE
Stay tuned for more update
ETHUSDT price have strong resistenceRight now, Ethereum is at the third touch on the descending (resistance) trendline.
Usually, when we reach the third touch, the price tends to fall.
We’re currently below the major resistance level at 4877, and in my opinion, on the monthly and three-month timeframes, the price doesn’t have enough strength to break through this level yet.
A correction is needed before we can break it.
That’s why at the moment, I’m more inclined toward short positions.
If you like the idea, please put a ‘like’. It's the best ‘Thank you!’ 😊 P.S. Always do your own analysis before a trade. Set a stop loss. Capture profits in instalments. Withdraw profits in fiat and make yourself and your friends happy.
ETH Price Action Looks Heavy – Danger Ahead?This chart is showing a clear pattern of accumulation followed by decline. Every time price moves sideways in a box range, instead of breaking upward with strength, it rolls over into another drop.
What this tells us is that the market is using these sideways phases as resting points for sellers to reload, not buyers to take control. Until CRYPTOCAP:ETH can break out of this cycle and hold above one of these consolidation zones, the overall trend remains heavy to the downside.
DYOR, NFA
#PEACEFUL
Follow for more updates and market insights on TradingView

ETHUSD Weekly Scenarios BullsWeekly Scenarios
Bulls
If ETH holds support at $4,200 and manages to rebound above the $4,500-4,600 resistance, we can expect a rally to $5,000 and beyond.
Sideways/Consolidation
The price may remain stuck in the $4,200-4,600 range until the market finds enough signal or volume to break out.
Bears
A breakout below $4,200 with volume confirmation will lead to a decline to $3,800 and below.

$ETH Bearish Short-Term (September 25, 2025)BINANCE:ETHUSDT
CRYPTOCAP:ETH Strong Bearish Pressure with Oversold RSI Signals
Overall Price Trend: ETH has experienced a sharp decline from recent highs around 4,700-4,800 USDT earlier in the period, now hovering near 3,472 USDT (as labeled on the chart). The recent candlesticks show a series of strong red (bearish) bars, indicating heavy selling pressure in the last few hours. This mirrors broader market weakness, possibly correlated with BTC's drop.
Ichimoku Cloud:The price is firmly below the cloud, a classic bearish setup signaling sustained downward momentum.
Tenkan-sen (red line) is below Kijun-sen (blue line) in a bearish crossover, and the cloud itself is thinning but still reddish and acting as overhead resistance. The Chikou Span (lagging line) is also below price action, reinforcing the downtrend.
RSI (Relative Strength Index): At the bottom panel, RSI is deeply oversold at 21.31—well below the 30 threshold. This suggests the selling has been exhaustive, potentially setting up for a short-term relief bounce. However, in a strong bearish context like this, it often just signals a pause rather than a full reversal.
Volume and Momentum: High volume on the red candles points to aggressive selling, with no immediate bullish divergence. The price is testing potential support around 3,400-3,450 USDT, but the momentum lines (like the blue trendline) are sloping downward sharply.
Summary: The chart remains Bearish dominantly, with the drop accelerating. The extreme oversold RSI adds a layer of caution for a possible pullback, but the Ichimoku setup keeps the bias downward.
Forecast Until Tomorrow (September 26, 2025):Based on the 2H chart, the bearish trend may continue in the coming hours, but with a small chance of rebound due to the deeply oversold RSI.
Here are the possible scenarios:
Base Scenario (Bearish, 75% probability): Price could test lower levels around 3,300-3,400 USDT if selling persists (especially if the cloud remains resistant). This would happen without a positive Ichimoku crossover or a strong green candle, and it's likely if broader market (e.g., BTC) stays weak.
Alternative Scenario (Mild Bullish, 25% probability): A short-term bounce to 3,550-3,650 USDT, if RSI climbs above 30 and price breaks the Tenkan-sen. This would be temporary, without changing the broader bearish trend.
To monitor, watch key levels: Support at 3,417 (recent low), resistance at 3,584 (near-term high). If ETH breaks below 3,400, it could accelerate lower; a close above 3,500 might signal temporary relief.

$ETH Bearish Short-Term (September 24, 2025)BINANCE:ETHUSDT
Summary of Price Action:
Recent Movement: In the last 24 hours, ETH has dropped by about 1.12%, reaching around $4,133 - $4,175 this morning (UTC). This follows a slight recovery from lows near $4,092 on September 22, but it's now retesting support at $4,100 amid strong institutional redemptions. In your 2H chart, we see a series of red candles (bearish) indicating selling pressure, with trading volume increasing during the decline, confirming seller interest.
Key Levels:
Support: $4,100 (immediate level, tested today) and $4,000 - $4,092 as a stronger lower zone. If $4,100 breaks, we could see a drop toward $3,900.
Resistance: $4,180 - $4,200 (strong level with recent rejections). A break above $4,200 would signal recovery toward $4,300.
Volume and Liquidity: 24-hour volume is around $34.8 billion, with large liquidations tied to $141 million in spot ETF outflows over the past day, mostly from institutional longs. This shows smaller traders suffering from bearish pressure.
MACD Indicator Analysis :In the chart you sent, the MACD line (blue) is crossing below the signal line (orange), with the histogram turning more negative (red bars growing). This indicates a bearish divergence – the price is weakening while momentum is losing strength. MACD is below the zero line, confirming a weak short-term trend. RSI (at similar levels) is around 40-50, signaling lightly oversold, but still without strong buy signals.
Overall Trend:
Bearish Short-Term, Bullish Long-TermShort-Term (Today/Next Day): Bearish.
The price is consolidating in a bearish channel, with predictions for further downside toward $4,000 - $4,092 today or tomorrow, due to fear sentiment and pressure from ETF outflows. This matches your chart, where we see a potential descending triangle pattern (but still uncertain). Avoid immediate buys – wait for confirmation below $4,100 for shorts or above $4,180 for longs.

ETH Analysis: Deeper Pullback in PlayETH is still trading within a broader uptrend channel, but recently, the price has started to pull back after a significant rally. After pushing up too far, the market is now taking a breather and recalibrating.
From a technical standpoint, this pullback is completely normal and healthy after such a strong move. Pullbacks like this are part of any bullish trend, providing the market a chance to reset. If the pullback continues, the next target could be the 3,600 support area, where multiple key factors converge: horizontal support, trendline support, and the 0.618 Fibonacci retracement level.
The 3,600 level is crucial. If ETH holds strong here and shows signs of a reversal, it could be a solid entry point for the next leg up. However, if the price breaks below this level, we may see deeper downside, and the current bullish structure could start to break down.
As always, confirm your setups before entering and make sure your risk management is solid. Stay alert for the next opportunities!

ETH BOUNCE at $4200 - Correction LIKELYAre you watching ETH in the daily timeframe 👀 ?
ETH is trading on a major support zone, and after a failed breakout here the price could likely be heading back towards the lower support area in the short term.
For the past 157 days, ETH has pretty much been trading UP only. We see this if we look at the price action from a daily timeframe over the past few months.
The price is likely to head lower towards the 4200 region where a bounce is possible - this will be a healthy cooldown for the short term.
________________________
BINANCE:ETHUSDT

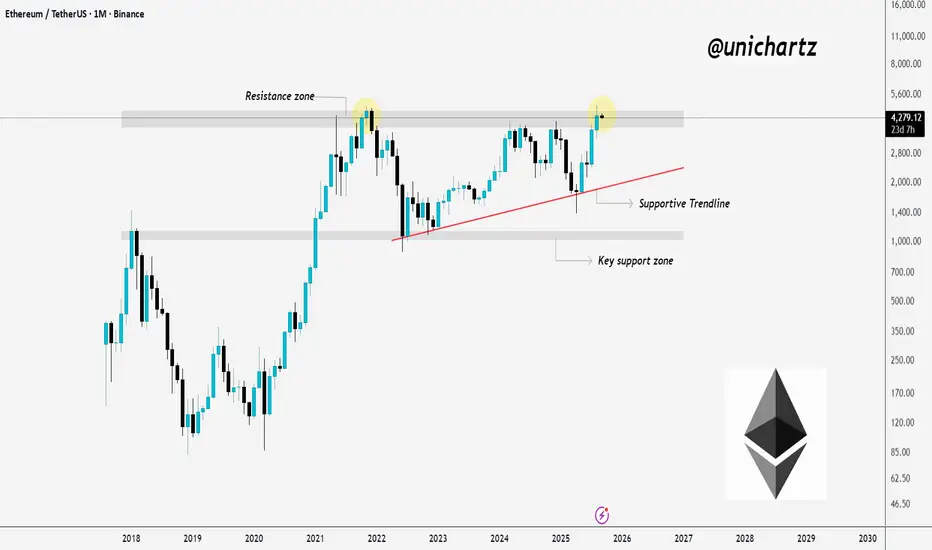
Decision Time for ETHCRYPTOCAP:ETH is struggling at the marked resistance zone.
Price has tested this area multiple times, which confirms it as a strong supply region. Right now, ETH is consolidating below resistance while holding above the supportive trendline.
If bulls can secure a clean monthly close above this resistance zone, the path opens for continuation toward higher levels. But if rejection plays out again, we could see a pullback to the supportive trendline or even toward the key support zone before another attempt.
This level is critical, it will decide whether ETH breaks into a new rally or spends more time ranging.
DYOR, NFA
More updates coming soon, Stay turned