Coinranger|ETHUSDT. Potential reversal to 3137🔥News
🔹Fed rates at 22:00 UTC+3, FOMC press conference at 22:30 UTC+3. We can fly on this news.
🔹US earnings season is in full swing.
🔥 ETH
🔹A Bitcoin-like situation:
1️⃣ We took 3036. Above that, there are 3072 and 3137. Potential for now. This is a full set of upward waves.
2️⃣ 2950 below is the level for a move until evening. Below that: 2888, 2876, and 2768 - are a full set of downside waves.
I expect a flat between 3036 and 2950 before rate issue. After that, an upward movement is very likely.
---------------
Share your opinion in the comments!
Ethusdtsignal

Coinranger|ETHUSDT. Continuing decline to 2666🔥News
🔹No important news today. Only an old data on american market will be released, which is usually considered preliminary.
🔥ETH
🔹Fell and completed the first extension for the second set of downside waves:
1️⃣ Above a pullback to 2920 is taking place. Potentially, but unlikely, we could reach 3036.
2️⃣ There is 2858 level below. One of a possible extension. 2666 and 2621 are potential levels for a new set of downward waves, the third set in the decline.
A continuation of the decline is likely, especially if Bitcoin decides it's too early for pullback.
---------------
Share your thoughts in the comments!

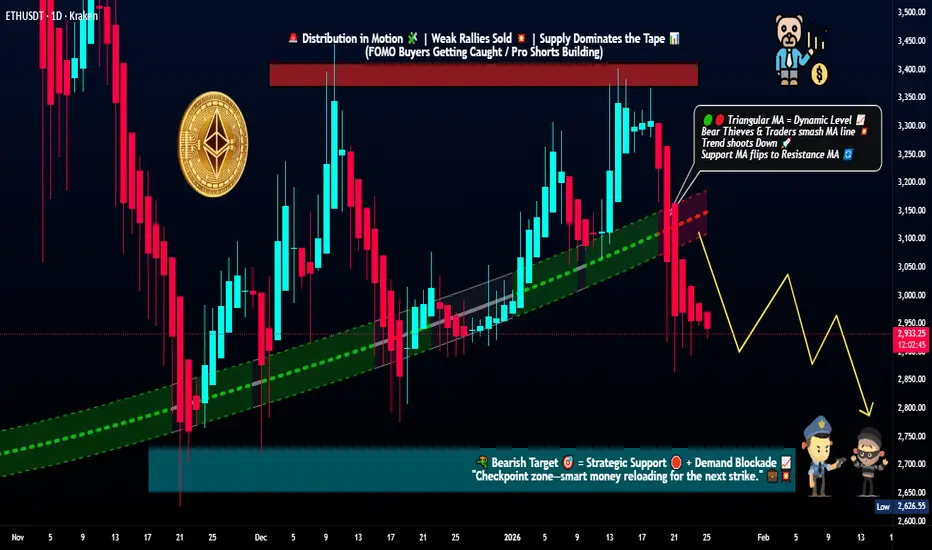
Ethereum Breaks Structure as Sellers Regain Control!🎯 ETH/USD: ETHEREUM vs TETHER - Crypto Market Profit Pathway Setup 💰
📊 Day/Swing Trade Opportunity | Bearish Momentum Confirmed ⚡
🔥 REAL-TIME MARKET DATA (January 25, 2026) 📈
Current ETH Price: $2,929 - $2,948 USD 💵
24H Volume: $8.1B - $25.89B (Extremely High Activity! 🚀)
Market Cap: $353.5B - $354.9B (#2 Crypto by Market Cap 👑)
24H Change: -0.06% to -3.07% (Bearish Pressure Building 🐻)
Market Rank: #2 Global Cryptocurrency 🥈
📉 TECHNICAL ANALYSIS & SETUP 🎨
🔴 Trade Plan: BEARISH CONFIRMATION
✅ Triangular Moving Average Breakout Confirmed
✅ Double-Top Pattern Formed at $4,000 Resistance (Major Reversal Signal! ⚠️)
✅ RSI Dropped Below 14-Week MA (Trend Reversal Confirmed 📉)
✅ Price Broke Below 100-Week EMA (5th Time Since 2022 - Historical Bearish Indicator! 🔻)
Chart Pattern: Symmetrical Triangle Breakdown + Structural Support Violation 📐
Momentum Indicators: Bearish divergence across multiple timeframes ⏱️
Bollinger Bands: Tight squeeze pattern (High Volatility Expected! 💥)
🎯 THIEF STRATEGY - LAYERED ENTRY EXECUTION 🏴☠️
💡 What is Thief Strategy?
Multiple Limit Orders (Layering Method) = Dollar-Cost Averaging into position across multiple price zones for optimal risk distribution! 🎲
🚨 RECOMMENDED SELL LIMIT LAYERS (Short Position):
Layer 1: 🔴 $3,150 (25% of Position Size)
Layer 2: 🟠 $3,100 (25% of Position Size)
Layer 3: 🟡 $3,050 (25% of Position Size)
Layer 4: 🟢 $3,000 (25% of Position Size)
Alternative Entry: Any current market price levels ($2,929 - $2,950 range) for aggressive traders 🎯
💎 Pro Tip: You can increase layer count based on your capital allocation and risk management strategy! Scale as you see fit, Thief OG's! 💪
🏆 PROFIT TARGET - "POLICE FORCE ZONE" 🚔
Primary Target: $2,700 🎯
Why This Level?
✅ Strong Historical Support Zone (Multiple bounces recorded 📊)
✅ Oversold Territory Expected (RSI < 30 anticipated 📉)
✅ Liquidity Trap Area (Institutional buyers likely positioned here 💰)
✅ Correlation with BTC Support Levels (Bitcoin dominance analysis confirms 🔗)
Potential Profit: ~8-15% from layered entries 💵
Risk-to-Reward Ratio: Approximately 1:2.5 to 1:3.5 📊
🛡️ RISK MANAGEMENT & STOP LOSS ⛔
Thief Stop Loss: $3,200 🚨
Invalidation Level: Price action above $3,200 negates bearish setup ❌
Risk Per Layer: Approximately 1.5-5% depending on entry point 📊
⚠️ IMPORTANT DISCLAIMER - READ CAREFULLY! 📢
Dear Ladies & Gentlemen (Thief OG's): 👋
I am NOT recommending you set only my TP/SL levels blindly! This is YOUR trade, YOUR capital, YOUR decision. 💯
You can make money, then TAKE MONEY at your own risk and comfort level! 🎰
Partial profits at $2,900? ✅ Your choice!
Exit at $2,850? ✅ Your prerogative!
Hold to $2,700 or beyond? ✅ Your strategy!
Risk Management is KING! 👑 Always trade with stop losses and position sizing! 📏
💱 RELATED PAIRS TO WATCH 👀
Correlated Assets for Multi-Pair Analysis:
BTC/USD (Bitcoin) 💰
Current: ~$89,100 - $93,700
Correlation: HIGH (BTC leads, ETH follows with amplified moves 📈📉)
Strategy: Watch BTC breaks below $88,000 support = ETH acceleration lower! ⚡
ETH/BTC (Ethereum vs Bitcoin Ratio) 🔄
Current: ~0.0346 BTC
Correlation: INVERSE strength indicator
Strategy: Weakening ratio confirms ETH underperformance 📉
SOL/USD (Solana) 🌟
Current: ~$137.45
Correlation: MEDIUM-HIGH (L1 blockchain competitor)
Strategy: Monitor for rotation signals from ETH to SOL 🔄
LINK/USD (Chainlink) 🔗
Correlation: MEDIUM (Ethereum ecosystem dependent)
Strategy: LINK weakness confirms ETH bearish momentum 📊
MATIC/USD (Polygon) 🟣
Correlation: HIGH (L2 scaling solution for Ethereum)
Strategy: Polygon decline = ETH infrastructure stress 🚨
AAVE/USD & UNI/USD (DeFi Leaders) 🏦
Correlation: HIGH (Ethereum DeFi ecosystem health)
Strategy: DeFi token weakness = ETH selling pressure ⚠️
Key Insight: Monitor these pairs for confirmation signals! When multiple correlated assets move together = HIGHER PROBABILITY SETUP! 🎯
🌍 FUNDAMENTAL & ECONOMIC FACTORS 📰
🔴 BEARISH CATALYSTS (Current Market Environment):
1. FEDERAL RESERVE POLICY UNCERTAINTY 🏦
❌ Interest Rates Held at 3.5%-3.75% (No immediate cuts expected! 🚫)
❌ Inflation Remains Above 2% Target (Wholesale prices +3%, Core CPI at 2.6% 📈)
❌ Jerome Powell's Tenure Ends May 2026 (Transition uncertainty ahead! ⚠️)
⚡ Impact: Risk assets under pressure as "higher for longer" narrative persists 📉
2. CRYPTO MARKET SENTIMENT - EXTREME FEAR 😨
📊 Fear & Greed Index: 24 (EXTREME FEAR ZONE!) 🔴
📊 BTC Dominance Rising: 59.8% (Capital fleeing altcoins including ETH! 🏃♂️)
📊 ETF Outflows Accelerating:
BTC ETFs: -$483M outflows (January 20) 💸
ETH ETFs: -$229M outflows (Breaking 2-month green streak!) 😱
3. GEOPOLITICAL TENSIONS & TARIFF CONCERNS 🌐
⚠️ US-Europe Tensions Escalating (Greenland disputes creating risk-off environment 🗺️)
⚠️ Tariff Threats on China (100% tariff increases = market instability! 💥)
⚡ Impact: "Crypto acts like ATM during uncertain times" - Recent 6.6% BTC drop confirms 📉
4. TECHNICAL BREAKDOWN SIGNALS 📉
🔻 Double-Top Pattern at $4,000 (Classic reversal formation! ⚠️)
🔻 $648M ETH Derivatives Liquidated (234,227 trader positions wiped! 💀)
🔻 Price Below $3,200 Key Support (January 19 breakdown confirmed 🚨)
🔻 25-Delta Skew Deterioration (Traders paying premium for downside protection! 🛡️)
🟢 POTENTIAL BULLISH CATALYSTS (Medium-Term, Post $2,700):
1. INSTITUTIONAL ACCUMULATION SIGNALS 💼
✅ Morgan Stanley ETH ETF Filing ($1.8T AUM entering market! 🏦)
✅ BitMine Aggressive Buying: 278,551 ETH purchased (30 days) = $13B+ total holdings 💰
✅ Stablecoin Growth: $300B supply, $1.1T monthly transactions (ETH ecosystem benefit! 📈)
2. ETHEREUM ECOSYSTEM DEVELOPMENTS 🛠️
✅ Pectra Upgrade Success (Improved scalability, lower gas fees ⚡)
✅ Upcoming: Glamsterdam & Hegota Upgrades (2026 implementation planned 🚀)
✅ DeFi Dominance: 68% Market Share ($68B TVL - Aave & Lido leading 👑)
✅ Layer-2 Scaling: Base & Arbitrum efficiency improvements 🔧
3. REGULATORY CLARITY POTENTIAL 📜
✅ CLARITY Act Progress (Could pass Senate in 2026 🏛️)
✅ Trump Administration Crypto-Friendly Stance (Despite current tariff concerns 🤝)
✅ Institutional Framework Development (Traditional finance integration advancing 🏦)
4. FUTURE FED POLICY EASING 📊
✅ 2+ Rate Cuts Expected 2026 (Mark Zandi, Moody's Analytics forecast 📉)
✅ Potential New Fed Chair (Kevin Hassett): "Cheaper car loans, easier mortgages" rhetoric 💰
✅ Historical Pattern: Past cycles peaked during rate hikes; current environment = rate cuts! 📈
🎲 UPCOMING ECONOMIC EVENTS TO MONITOR 📅
Critical Data Releases (Next 30 Days):
January 29, 2026: FOMC Meeting Decision 🏦
Impact: HIGH ⚡⚡⚡
Watch for: Rate guidance, Powell's press conference tone 🎤
February 2026: ISM Manufacturing PMI 📊
Impact: MEDIUM ⚡⚡
Watch for: <50 = economic slowdown = potential risk asset pressure 📉
February 2026: Monthly Jobs Report 💼
Impact: HIGH ⚡⚡⚡
Watch for: Weak job creation = Fed dovish pivot potential 🕊️
Q1 2026: Fed Chair Transition Announcements 🔄
Impact: HIGH ⚡⚡⚡
Watch for: Kevin Hassett confirmation = dovish policy expectations 📈
Ongoing: Trump Tariff Policy Updates 🌐
Impact: VERY HIGH ⚡⚡⚡⚡
Watch for: Escalation = risk-off / De-escalation = risk-on 🎢
📊 VOLUME & LIQUIDITY ANALYSIS 💧
24H Trading Volume: $3.8B - $25.89B (MASSIVE volume spike indicates institutional activity! 🐋)
Open Interest Changes: Declining futures OI = reduced speculative positioning 📉
Exchange Flows: Net outflows from exchanges = potential supply squeeze (bullish for reversal) 🔄
Whale Activity Alert: 🐋
Large liquidations observed ($648M derivatives wiped)
Smart money appears to be accumulating near support zones
Watch for $2,700-$2,750 zone for reversal signals! 👀
🎯 TRADE EXECUTION CHECKLIST ✅
Before Entering This Trade:
✅ Confirm your risk tolerance (Max 2-5% account risk recommended!)
✅ Set ALL limit orders if using layered strategy
✅ Place stop loss at $3,200 (or adjusted to your risk parameters)
✅ Monitor BTC/USD correlation (BTC leads the market!)
✅ Check upcoming FOMC announcements (Calendar marked?)
✅ Review your position size (Never over-leverage, Thief OG's! 🚫)
✅ Have profit-taking plan ready (Partial exits at multiple levels?)
✅ Confirm exchange liquidity for your order sizes
✅ Set price alerts at key levels ($3,000, $2,900, $2,700)
✅ Mentally prepare for volatility (Crypto never sleeps! 🎢)
🔥 FINAL THOUGHTS - THE THIEF OG PHILOSOPHY 🏴☠️
Trading is 90% Risk Management, 10% Entry Timing! 💯
This setup presents a HIGH-PROBABILITY bearish scenario based on:
✅ Technical breakdown patterns
✅ Macro economic headwinds
✅ Market sentiment extremes
✅ Historical correlation data
✅ Real-time volume analysis
BUT REMEMBER: 🧠
Markets can remain irrational longer than you can remain solvent!
Unexpected news can flip the script instantly!
ALWAYS protect your capital with stop losses!
NEVER trade with money you can't afford to lose!
Take profits when you have them - "Pigs get slaughtered" 🐷
💬 COMMUNITY ENGAGEMENT 🤝
Like this idea? Smash that 👍 button!
Disagree? Drop your counter-analysis in comments! 💬
Following this trade? Update us on your results! 📊
Let's make money together, Thief OG's! 💰🎯🔥
🏴☠️ Trade Smart. Trade Safe. Trade Like A Thief OG! 🏴☠️
#ETHUSD #Ethereum #CryptoTrading #TechnicalAnalysis #BearishSetup #DayTrading #SwingTrading #ThiefStrategy #TradingView #CryptoAnalysis #RiskManagement #FOMC #FederalReserve #DeFi #Layer1 #SmartContracts #Blockchain #TradingIdeas #ChartPatterns #PriceAction 🚀📊
Coinranger|ETHUSDT. Flat at 2826 - 3058?🔥News
🔹The WEF continues. Preliminary US manufacturing and services PMI data will issue at 17:45 (UTC+3) - no sharp movements expected.
🔥ETH
🔹Ethereum price situation is pretty the same as yesterday's:
1️⃣ The minor correction of levels above. Now there are: 3170, 3102, 3058.
2️⃣ 2826 below is still actual.
The price is forming triangle, and it's not as confident as Bitcoin's. Current prices look more like a continuation of the downward movement (but that's not a fact). I'd say Ethereum is more likely to breakout of 2826 and then pullback. Possibly by the end of the weekend.
---------------
Share your thoughts in the comments!

ETH Price Action – Smart Money Pullback TradeMarket Structure Overview
Higher Timeframe Bias: Bullish
ETH has been making Higher Highs (HH) & Higher Lows (HL) inside an ascending channel.
Multiple BOS (Break of Structure) confirm strong bullish momentum.
Recent CHoCH indicates a possible short-term pullback within the uptrend, not a full reversal.
📉 Current Price Action
Price is reacting at a premium zone / resistance near 3,320 – 3,350
Formation suggests distribution (equal highs + rejection wicks)
Liquidity resting above highs has likely been taken
📦 Key Zones
🔴 Supply Zone (Major)
3,320 – 3,350
Strong rejection area
Ideal zone for short-term shorts / pullback trades
🔵 Demand Zone (Strong)
3,080 – 3,120
Previous BOS + consolidation
High probability reaction zone
🎯 Trade Plan
📥 Entry
Around 3,290 – 3,300
After bearish confirmation (lower low on LTF)
🎯 Targets
TP1: 3,214 (partial profits)
Final TP: 3,040 – 3,030 (major demand & liquidity zone)
🛑 Stop Loss
Above 3,350
Above equal highs & supply

Coinranger|ETHUSDT. Will it grows yet?🔥News
🔹No important news today. Potentially, Trump could start doing something in Iran. And, as we remember, in such cases, crypto can go down rapidly.
🔥ETH
🔹Stays within yesterday's forecast:
1️⃣ Levels above: 3373 and 3460.
2️⃣ Levels below with the minor changes: 3264, 3230, and 3160.
We'll be following Bitcoin. For now, the priority is to go lower. The minimum target at the bottom is 3264. An upward move is fragile, but not impossible.

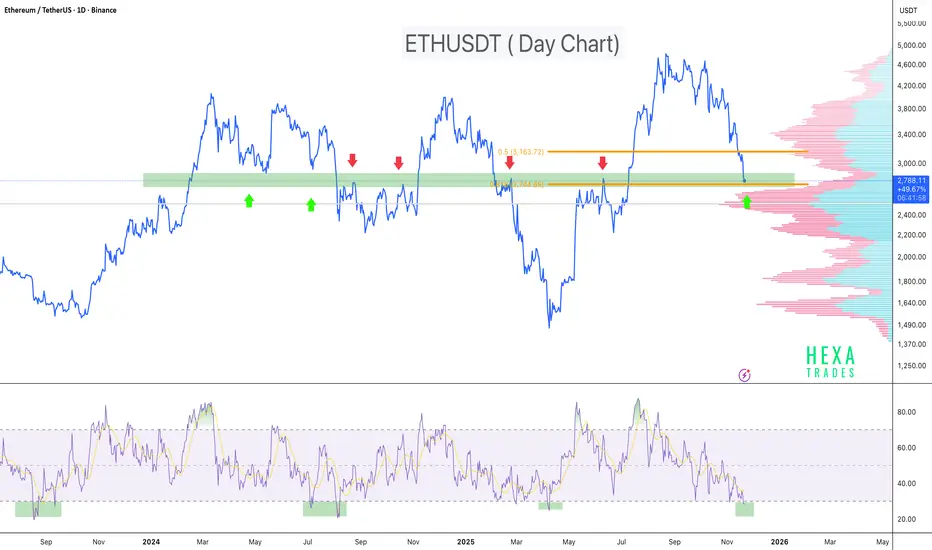
ETHUSDT Poised for Breakout: Triangle + Golden Fib Support AlignEthereum is currently compressing inside a triangle pattern on the daily timeframe, following a corrective move from recent highs. Price is building higher lows while facing descending resistance, suggesting volatility compression ahead of a potential expansion.
The yellow horizontal level marks the Fibonacci golden retracement zone, which has acted as a strong reaction level and is currently providing structural support. Price is also interacting with the 50, 100, and 200 EMAs, indicating a key decision area where trend direction is likely to be resolved.
Key technical points:
- Triangle pattern signaling imminent breakout
- Golden Fib retracement zone acting as support
- Price reclaiming / challenging the 50, 100 & 200 EMAs
Clear upside objective into the green target zone, a historical resistance area where price has been rejected multiple times over the past years
A confirmed daily breakout from the triangle, especially with strength above the EMAs, could open the path toward the green resistance zone. Failure to hold the Fib support would invalidate the setup and increase downside risk.
Cheers
Hexa

Coinranger|ETHUSDT. Is further growth possible?🔥News
🔹Today at 16:30 (UTC +3) will issue the US PPI data for December, and most likely for October at the same time. Also included are retail sales at the same time.
🔥ETH
🔹Roughly repeated BTC's success yesterday. Levels:
1️⃣ Above - 3373 and 3460.
2️⃣ Below: 3290, 3190, and 3135 (preliminary calculations)
We'll be following Bitcoin. For now, the priority is a decline. At best, we'll hit 3190 from below. Watch out for the news. 3460 is most likely from above, but not necessarily.

#ETHUSDT: Still Waiting For Price To Come Down $2000 LevelETHUSDT OVERVIEW! 🏆🚀
🔺The market is still showing signs of weakness. We’re seeing a lot of traders getting tired of buying at the $3400 level, which is a big deal for many swing traders. Right now, we’re still thinking it’s best to buy ETH when it’s at the lower price of $2000. To do this, we need the price to drop a lot, with lots of strong bearish trading happening each day.
🔺We’re aiming to get in at $2000, but it might take some time for the price to get there. We’re going to wait for a clear sign from the market.Right now, the main reason people are buying is because of what’s happening with the fundamentals, and we think those will settle down soon. Once they do, we expect the price to go down a bit.
🔺When you’re trading cryptocurrency, it’s really important to be careful with your risk. It can be risky and you could lose all your money. This analysis is just to help you learn, so please do your own research and make sure you understand the risks.
Team SetupsFX❤️🧠

Coinranger|ETHUSDT. Potential pullback to 3100 and below.🔹At 16:15 UTC+3 - ADP nonfarm payrolls data.
🔹At 18:00 UTC+3 - PMI in services and the JOLTS employment report. More important.
Volatility is possible on both news
🔥ETH
🔹Almost reached the ideal extension on h1:
1️⃣ 3336 and 3386 are still potentially significant.
2️⃣ 3152, 3100 (potential turning point), 3025, and 2960 is a full set of downward waves with extensions.
We're keeping an eye on Bitcoin. The advantage for price reduction.

ETHUSDT Price at Strong Demand Zone – Watching for Bullish Zone📊 ETHUSDT – 30M
Price Reacting at Key Demand Zone | Potential Bullish Reversal Setup
This ETHUSDT 30-minute chart shows price entering a well-defined bullish reversal (demand) zone after a sustained bearish move. The market appears to be transitioning from distribution into accumulation, with clear signs of buyer interest emerging near the lows.
🔍 Market Structure Breakdown & Technical Analysis
ETH previously formed a series of lower highs and lower lows, confirming a short-term bearish structure.
The recent sell-off drove price into a historically significant demand area, where aggressive buying previously occurred.
The current move down lacks strong follow-through, suggesting bearish momentum is weakening.
Price is now consolidating, indicating absorption of sell orders by larger participants.
🟩 Reversal Zone & Volume Burst
The highlighted green area marks a high-probability demand zone, supported by:
Strong bullish displacement in the past
High-volume reaction (Volume Burst)
Long downside wicks showing liquidity sweep and rejection
This behavior often precedes short-term trend reversals or deep pullbacks.
📌 What Confirmation Looks Like
No blind entries — waiting for price confirmation inside the zone.
Bullish confirmation may include:
Bullish engulfing candle on 30M or lower TF
Strong rejection with long lower wicks
Break in internal market structure (higher low)
Increasing volume on bullish candles
Once confirmed, the probability favors a relief rally.
🎯 Trade Expectations (If Confirmed)
Bias: Bullish reaction / intraday reversal
Entry: After confirmation inside the demand zone
Invalidation: Clean break and close below the zone
Targets:
First target: Internal resistance / range high
Second target: Previous lower high
Extended target: Liquidity above recent highs
Risk-to-reward remains attractive due to tight invalidation and clear structure.
🧠 Market Psychology Insight
This setup reflects smart money accumulation, where liquidity is taken below recent lows before price expansion. Retail panic selling often fuels these reversals — patience and confirmation separate professionals from gamblers.

Will Ethereum’s Market Flow Signal a New Bullish Phase?🎯 ETH/USD: The "Thief Strategy" Blueprint | Layer Your Way to Victory! 💰
📊 Market Overview
Asset: ETH/USD (Ethereum vs US Dollar)
Market: Crypto
Trade Type: Swing Trade
Bias: Bullish (Post-Breakout Setup)
🎭 The Thief's Master Plan
Ladies and gentlemen, gather 'round! 🎩 We're not just trading here—we're executing the legendary "Thief Strategy" where we sneak into multiple price levels like a professional heist crew. No single entry point for us, oh no. We layer up, diversify risk, and wait for the vault to open! 💎
🚀 Entry Strategy: The Layering Technique
Primary Entry Zone: Any price level AFTER a confirmed breakout above $4,200 ✅
The Thief's Layering Method (Multiple Limit Orders):
🥇 Layer 1: $3,900
🥈 Layer 2: $4,000
🥉 Layer 3: $4,100
🏆 Layer 4: $4,200
Pro Tip: Feel free to add more layers based on your capital allocation and risk appetite. The more layers, the smoother your average entry price! Think of it as building a ladder to success.
🛑 Stop Loss: Protect Your Treasure
Thief's Stop Loss: $3,700 🚨
⚠️ Important Disclaimer:
Dear Ladies & Gentlemen (Thief OG's), I'm NOT recommending you blindly follow my stop loss. This is MY risk tolerance. You need to assess YOUR own risk management strategy. Set your stop loss according to your capital size, risk appetite, and sleep-at-night comfort level. Remember: Your money, your rules! 💼
🎯 Take Profit Target: Know When to Exit the Heist
Primary Target: $4,600 🎰
Why This Level?
📈 Moving Average acting as a strong resistance zone (think of it as the police barricade!)
🔴 Overbought conditions on technical indicators
⚠️ Bull trap zone — smart money might be waiting to distribute here
Exit Strategy:
When you see the moving average resistance + overbought signals flashing, it's time to take your profits and vanish into the night! 🌙
⚠️ Important Disclaimer:
Dear Ladies & Gentlemen (Thief OG's), I'm NOT recommending you blindly follow my take profit level. This is MY analysis. Scale out profits at levels that make sense for YOUR trading plan. Partial profits, trailing stops, whatever works for YOU. Make money, then TAKE money—at your own discretion! 💵
🔗 Related Pairs to Watch
Keep an eye on these correlated assets to confirm the broader market direction:
BITSTAMP: BITSTAMP:BTCUSD — The king of crypto. When Bitcoin moves, ETH usually follows. Watch for BTC breakouts above resistance.
BINANCE: BINANCE:ETHBTC — Shows ETH's relative strength against Bitcoin. Rising = ETH outperformance.
TVC: TVC:DXY (US Dollar Index) — Inverse correlation. Weaker dollar = stronger crypto typically.
Total Crypto Market Cap — Confirms if capital is flowing INTO or OUT OF the crypto space.
COINBASE: COINBASE:SOLUSD , COINBASE: COINBASE:ADAUSD — Other major altcoins. If they're pumping too, it confirms alt season momentum.
Key Correlation Point: If Bitcoin is breaking resistance zones and the Dollar Index (DXY) is weakening, our ETH setup gets significantly stronger! 📊✨
🧠 Technical Analysis Breakdown
What We're Watching:
✅ Breakout Confirmation: Price must close above $4,200 with volume
✅ Support Levels: $3,900-$4,100 range acts as accumulation zone
✅ Resistance Zone: $4,600 where moving averages + overbought conditions converge
✅ Risk-Reward Ratio: Solid setup with layered entries minimizing average cost basis
The Thief Strategy Philosophy:
Instead of gambling on ONE entry point, we spread our risk across multiple price levels. This way, we're dollar-cost-averaging into the position BEFORE the breakout confirmation, positioning ourselves ahead of the crowd! 🎯
🎬 Final Words from the Thief
Remember, OG's: The best trades are the ones where you're positioned BEFORE the crowd rushes in. Layer your entries, manage your risk like a professional, and know when to take your profits and disappear! 👻
Stay disciplined, stay profitable, and let's make this heist a success! 🏆
✨ If you find value in my analysis, a 👍 and 🚀 boost is much appreciated — it helps me share more setups with the community!
#ETHUSD #Ethereum #CryptoTrading #SwingTrade #ThiefStrategy #LayeringStrategy #CryptoAnalysis #TechnicalAnalysis #TradingView #CryptoSetup #AltcoinSeason #ETHBreakout #RiskManagement #TradingStrategy #CryptoIdeas

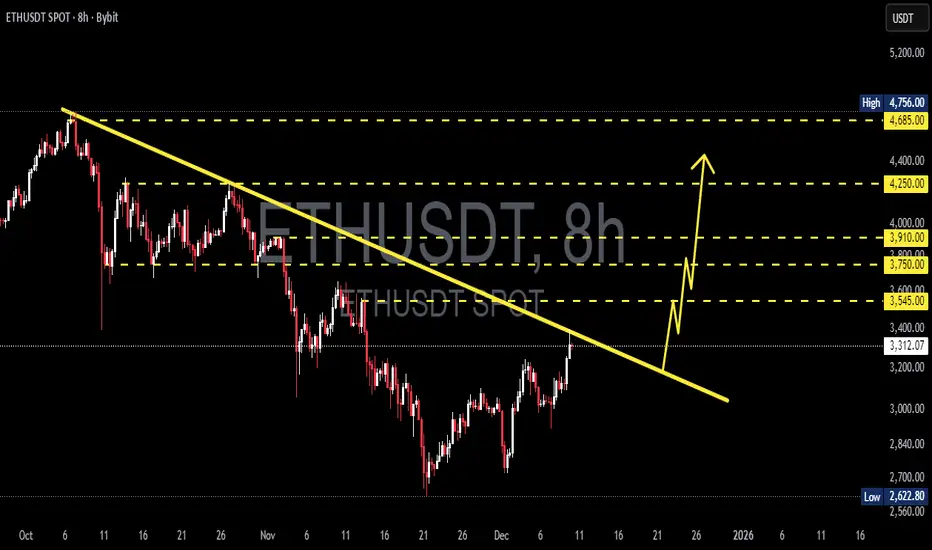
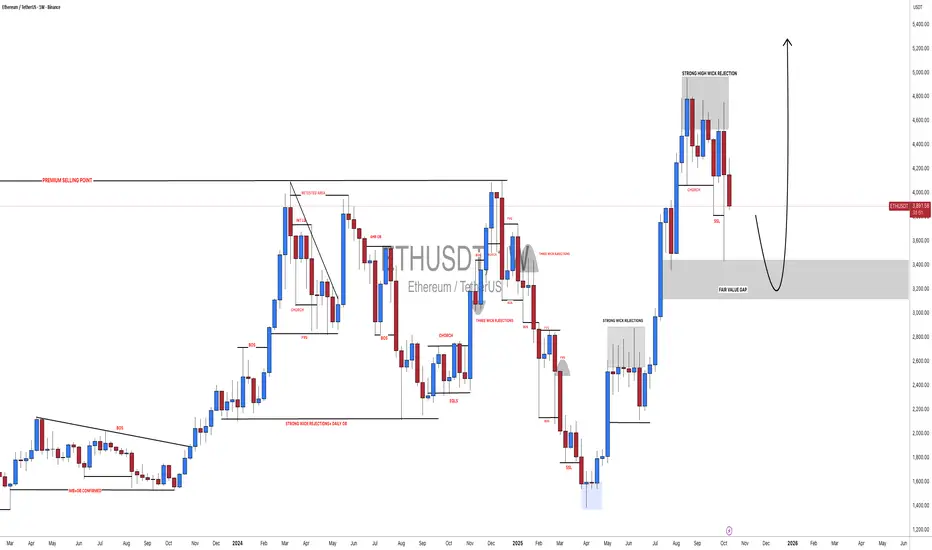
ETH/USDT — This Trendline Will Decide the Next Major MoveETH is now sitting at the most crucial level of Q4 —
directly attacking the descending trendline that has rejected every rally since early October.
This is not just a trendline.
This is the wall separating ETH from a full momentum breakout.
---
🔍 What’s Really Happening on the Chart?
ETH has formed a sequence of higher lows, showing growing buyer strength.
The descending trendline (yellow) remains the final defense for the bears.
Several major resistance zones above (3,545 → 3,750 → 3,910 → 4,250 → 4,685) are aligned perfectly if a breakout confirms.
Price is now sitting at a decision zone, and markets often expand aggressively after setups like this.
In simple terms:
ETH is preparing for a big move — only the direction is yet to be chosen.
---
🔥 Bullish Scenario — A Breakout That Changes Everything
If ETH manages to:
1. Close an 8H candle above the trendline, and
2. Show a clean retest afterward,
then a bullish expansion could unfold toward:
🎯 3,545 — first breakout confirmation
🎯 3,750 — structural shift
🎯 3,910 — major resistance
🎯 4,250 — expansion zone
🎯 4,685 – 4,756 — full breakout target
Trendline breaks like this often mark the start of large impulsive rallies, especially with rising volume.
---
⚠️ Bearish Scenario — A Sharp Rejection
If the trendline rejects price and the candle closes back below it:
ETH forms another lower high,
Bearish structure resumes,
Downside targets come into play:
🔻 3,000 – 2,840
🔻 2,700
🔻 2,622 (major support)
A rejection here frequently creates strong downward continuation, as this trendline is widely watched.
---
🎯 Key Takeaway
This is the most important ETH setup of the past several weeks.
Breakout → bullish momentum wave.
Rejection → trend continuation downward.
This level will likely dictate ETH’s direction going into early 2026.
For aggressive traders, this is an opportunity.
For conservative traders, this is a wait-for-confirmation zone.
#Ethereum #ETH #ETHUSDT #CryptoAnalysis #PriceAction #Breakout #Trendline #CryptoMarkets #Altcoins
#ETHUSDT: Price is yet to drop around $1780 area before bullsETHUSDT is likely to fall further to around $1900 or $1800. This area appears more promising and has strong bullish volume. We should wait for price confirmation before entering.
If you like our idea, please like and comment. Also, use accurate risk management.
Team Setupsfx_

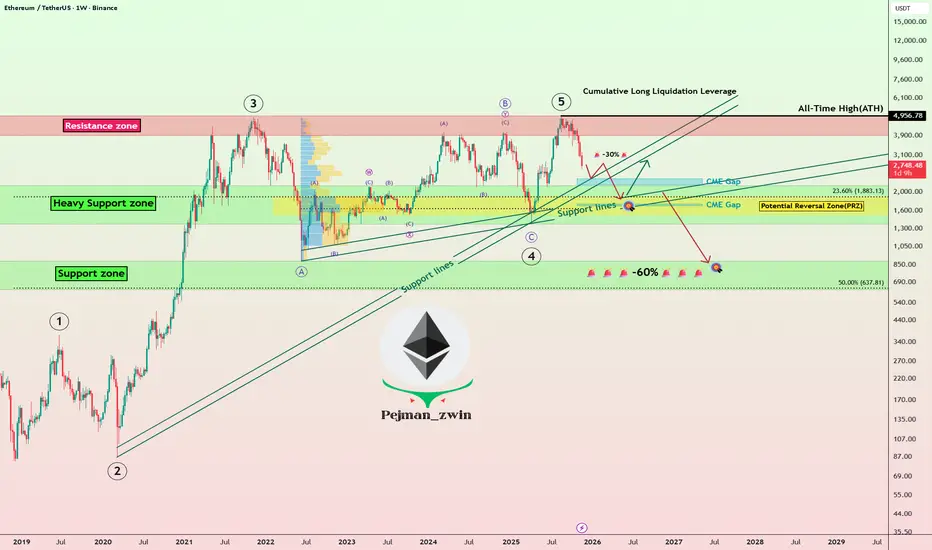
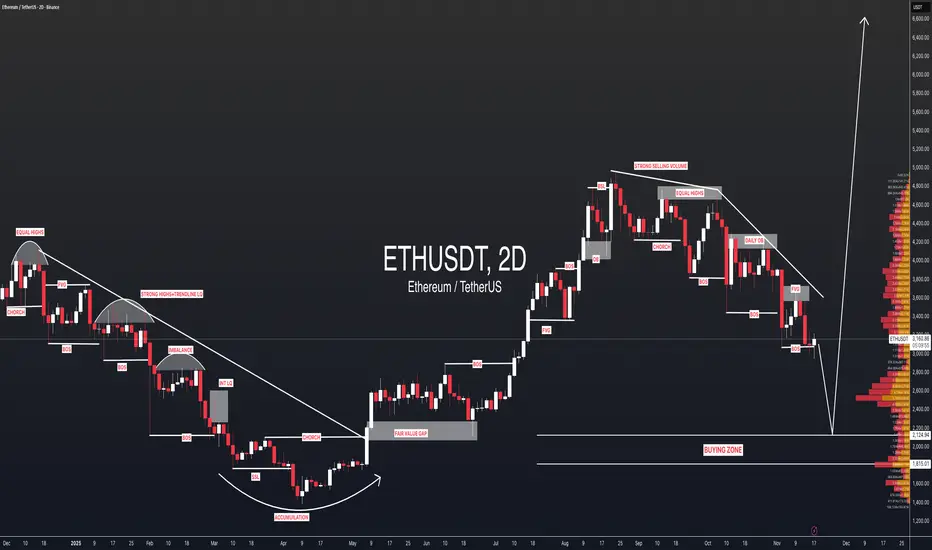
Ethereum Roadmap: Will ETH Bounce or Begin a Deeper Correction!?Today, I’d like to dive into an analysis of Ethereum ( BINANCE:ETHUSDT ). Given that over 80% of tokens in the crypto market are built on the Ethereum blockchain, Ethereum’s performance can serve as a roadmap for other tokens on the network.
So, stay tuned!
In recent times, Ethereum hasn’t been able to keep pace with Bitcoin’s growth and struggled to set a new All-Time High(ATH=$4,956). After Bitcoin’s decline, Ethereum also started to drop and is currently moving near the Heavy Support zone($2,160-$1,370), Support lines, Cumulative Long Liquidation Leverage($1,745-$1,629), and Potential Reversal Zone(PRZ) .
From an Elliott Wave perspective, it seems that Ethereum has completed its main five-wave impulsive. This suggests that we might now be entering a corrective phase. The extent of this correction will depend on multiple factors, and technical analysis alone won’t predict the exact magnitude of Ethereum’s decline in the coming days or weeks. Nonetheless, I’ll keep you updated step-by-step.
Looking at the USDT.D%( CRYPTOCAP:USDT.D ), it’s currently on an upward trend. This rising dominance can lead to further declines in Ethereum, reinforcing the bearish outlook.
Another important index is the US 10-Year Government Bond Yield ( TVC:US10 ). If the US 10-Year Government Bond Yield continues its upward movement, it can put additional pressure on risk assets like Bitcoin( BINANCE:BTCUSDT ) and Ethereum, leading to further declines.
Now, the question is: where might we see Ethereum resume its upward trajectory?
It’s likely that Ethereum will continue its downward movement(-30%), potentially filling the CME Gap($2,344-$2,186), CME Gap($1,745-$1,629) near the $2,000(Round Number). Once it stabilizes around that zone, we could look for signs of a recovery.
However, if Ethereum breaks below its Heavy Support zone($2,160-$1,370), we might face even more significant declines, potentially exceeding -60%.
Where do you think Ethereum will start to rise again? Or are more red days ahead?
💡 Please respect each other's opinions and express agreement or disagreement politely.
📌Ethereum Analyze (ETHUSDT), Weekly time frame.
🛑 Always set a Stop Loss(SL) for every position you open.
✅ This is just my idea; I’d love to see your thoughts too!
🔥 If you find it helpful, please BOOST this post and share it with your friends.
ETH : Oversold RSI + Fib Golden Zone = High-Probability ReversalETH is currently trading inside a major historical support zone, an area where price has repeatedly been rejected and bounced in the past. This level has acted as a strong demand zone multiple times, and the price is once again testing it.
On the momentum side, the RSI has dipped below 30 on the daily chart. Historically, every time ETH’s RSI dropped into the oversold region, it marked a strong bottom formation followed by a notable bounce.
Price is also sitting inside the Fibonacci golden zone, adding further confluence that this area could act as a potential reversal point.
Key Points:
- Strong multi-tested support zone
- Price reacting inside the Fib golden pocket
- Daily RSI oversold (<30) - historically reliable bottom signal for ETH
- High probability bounce zone if the support holds
- This is a critical level to watch for bullish reactions or early reversal signals.
Cheers
Hex
ETHUSDT: First Drop To $2100 And Bounce Up To $6500ETHUSDT is dropping nicely and we expect a smooth reversal around $2200. This area looks promising due to the significant volume sitting there. We just need to avoid liquidation. Once the entry is active, you can enter with strict risk management and set multiple take profit levels. This analysis is suitable for all traders from intraday to swing.
Good luck and feel free to like and comment for more!
Team Setupsfx_
ETHUSDT: Rebound Setup from Broadening Wedge SupportETH is currently respecting the lower boundary of a broadening wedge pattern, a structure known for sharp reversals once price taps the support zone. The latest reaction shows buyers defending this area, indicating a potential upside move.
Entry: Current support area of the broadening wedge, below $3200
Stop-Loss: $2900
Take-Profit: 10%, 20% , 40%
Cheers
Hexa

Ethereum Bulls Defending $3,500 Zone – Time to Rise?Today, I want to walk you through a quick 15-minute timeframe analysis of Ethereum ( BINANCE:ETHUSDT ), so stick around.
Right now, Ethereum is hovering near a Support zone($3,520-$3,348) and a Cumulative Long Liquidation Leverage($3,507-$3,460) .
From an Elliott Wave standpoint, it seems like Ethereum is wrapping up a microwave Y of the main wave 4.
Also, looking at the ETHBTC ( BINANCE:ETHBTC ) chart, Ethereum is in a favorable position there as well, which suggests that if Bitcoin ’s( BINANCE:BTCUSDT ) price increases, Ethereum might see an even stronger upward move.
My expectation is that in the coming hours, Ethereum can resume its bullish trend , push up toward the Resistance lines , and then aim for the next Resistance zone($3,726-$3,649) .
First Target: $3,631
Second Target: $3,665
Third Target: $3,707
Stop Loss(SL): $3,449
CME Gap: $3,513-$3,483
Cumulative Short Liquidation Leverage: $3,715-$3,671
Please respect each other's ideas and express them politely if you agree or disagree.
Ethereum Analyze (ETHUSDT), 15-time frame.
Be sure to follow the updated ideas.
Do not forget to put a Stop loss for your positions (For every position you want to open).
Please follow your strategy and updates; this is just my Idea, and I will gladly see your ideas in this post.
Please do not forget the ✅' like '✅ button 🙏😊 & Share it with your friends; thanks, and Trade safe.

#ETHUSDT: Fill The Gap At $3200, Target At $6000 The significant price gap has been closed and the market is now in correction mode. We anticipate a further decline of approximately $3200 which remains a key support level for buyers. Our next step is to observe the market’s reaction and remain patient.
Please note that this is not a guarantee and you should always conduct your own research before making any significant investment decisions.
Best regards,
Team Setupsfx
ETH/USDT — Golden Zone: Major Reversal or Deeper Correction!The 1W chart of Ethereum (ETH/USDT) displays a clear Elliott Wave impulsive structure, with the price currently moving within Wave (4) — a corrective phase that often determines whether the main trend will continue or reverse.
The 3,630–3,200 USDT yellow zone acts as a critical battleground where long-term buyers and short-term sellers collide. This zone will define whether Ethereum is preparing for its next major rally or entering a prolonged correction.
---
Structure and Key Pattern
Elliott Wave Count: Waves (1), (2), and (3) are complete; price is now in Wave (4), which typically precedes the final impulsive move (5) if the structure remains valid.
Golden Pocket Zone (0.5–0.618 Fib): The range between 3,630–3,200 is the golden retracement zone — a region where high-probability reversals often form.
Historical Flip Zone: This same area served as a major resistance during 2021–2022 and now acts as structural support, making it an extremely important pivot level.
Volume Profile: Historically, this zone attracts accumulation before a large breakout, indicating potential institutional interest.
---
Bullish Scenario — The Start of Wave (5)
If Ethereum holds above the yellow zone and prints a strong reaction, the structure supports a continuation rally toward new highs as Wave (5) develops.
Bullish Triggers
1. Strong rejection candles (e.g., long lower wick or bullish engulfing) from 3.2–3.6k zone.
2. Confirmation occurs once price reclaims 4.1k and breaks above 4.7k with weekly close.
3. First target: 4.95k (previous ATH resistance).
4. Extended targets: If momentum is strong, Fibonacci extensions point toward 6k–9k zones — marking the full completion of Wave (5).
5. Increasing weekly volume during breakout strengthens the bullish continuation signal.
> Bullish Summary:
As long as price stays above 3,200, the impulsive Elliott structure remains intact — making this zone a potential launchpad for the next major Ethereum rally.
---
Bearish Scenario — Breakdown and Deeper Correction
If price fails to hold the 3,200 support and breaks below, the impulsive structure will be invalidated, signaling a possible larger corrective phase (A–B–C).
Bearish Triggers
1. Weekly close below 3,200 confirms support breakdown.
2. Next target would be ~2,700 USDT — the next key support zone.
3. If bearish momentum continues, the price could extend lower toward 1,700–900 USDT (0.786–0.886 retracement).
4. The structure then transitions from an impulsive rally into a corrective macro phase, indicating that the larger bullish wave is temporarily over.
> Bearish Summary:
A weekly close below 3,200 signals structural failure and the start of a long-term distribution or deeper correction phase before forming a new accumulation base below 3k.
---
Visual Interpretation
5-Wave Impulsive Pattern: Indicates that the macro trend remains bullish until 3,200 breaks.
Yellow Zone = Decision Point: This “golden battlefield” determines whether Ethereum resumes its major uptrend or shifts into correction.
If strong bounce occurs, a parabolic Wave (5) could unfold — usually accompanied by extreme optimism and renewed market euphoria.
---
Trading Strategy & Risk Management
Use weekly timeframe for structural confirmation; use daily for precise entries.
Scaling strategy: Gradually build positions within 3.63–3.2k zone; add more upon bullish weekly close.
Stop-loss: Below 3.1k to protect structure integrity.
Conservative approach: Wait for breakout above 4.7k before confirming trend continuation.
Keep an eye on macro news and Ethereum ecosystem updates, which could add volatility beyond technical patterns.
---
Final Takeaway
> Ethereum stands at its Golden Crossroads — between renewal and decline.
If the 3.630–3.200 zone holds, ETH could ignite Wave (5) and push toward new all-time highs (6k–9k).
But if it breaks, the market might enter a deep corrective phase lasting months.
This zone will likely decide Ethereum’s direction for the next 6–12 months.
#Ethereum #ETHUSDT #CryptoTA #ElliottWave #CryptoAnalysis #TechnicalAnalysis #ETHPrice #Fibonacci #CryptoTrading #BullishScenario #BearishScenario #CryptoInvesting

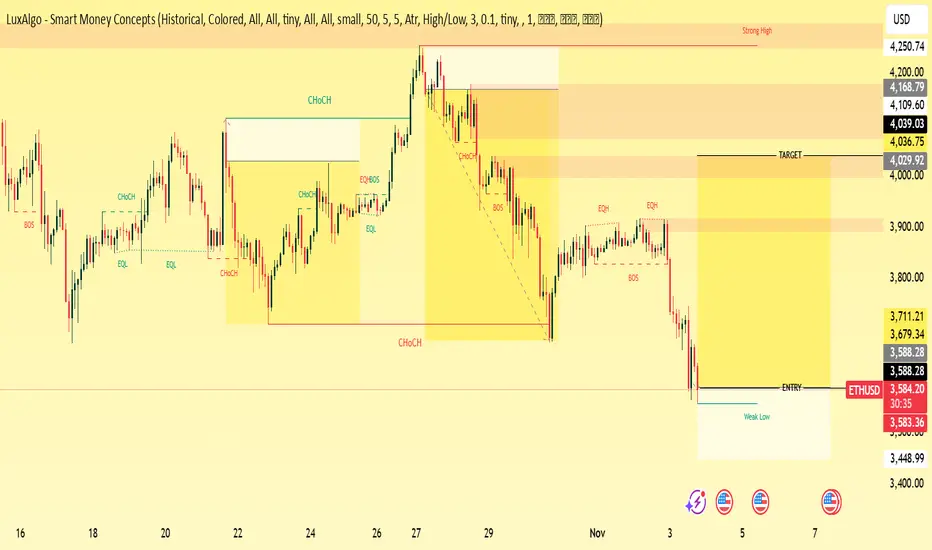
ETH/USD TECHNICAL ANALYSIS BULLISH SETUP1. Market Structure Overview
The chart has shown multiple Change of Character (CHoCH) and Break of Structure (BOS) points, confirming shifts between bullish and bearish phases.
After forming a strong high near 4,250, ETH has been in a bearish market structure, with lower highs and lower lows.
2. Liquidity & Key Levels
Equal Highs (EQH) and Equal Lows (EQL) mark liquidity pools.
The most recent EQH near 3,900 was swept, indicating liquidity grab before price continuation down.
Weak low identified around 3,579–3,550, suggesting potential liquidity inducement for a bullish reversal soon.
3. Current Zone & Entry Area
Price has tapped into the entry zone (3,579–3,588) after a sharp decline, aligning with a discounted price zone within the previous bearish leg.
This area could serve as an accumulation point before a reversal if demand is confirmed.
4. Possible Scenarios
Bullish Scenario:
Price holds above the weak low and forms a BOS to the upside.
Upside target zones:
3,711.21 (first internal structure)
3,900 (EQH region / liquidity zone)
4,029–4,039 (major target & imbalance fill zone)
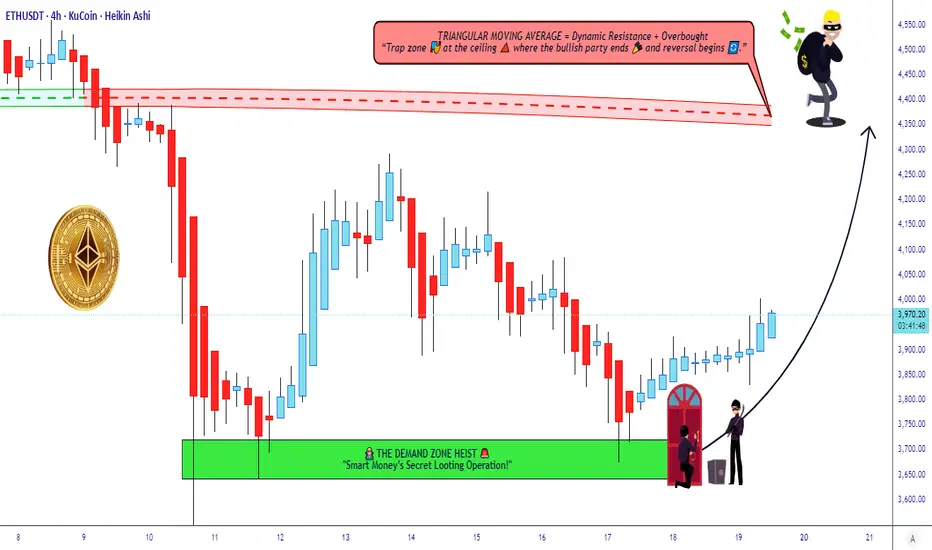
Ethereum Technical Map – Bulls Leading the Charge!🎯 ETH/USDT: The Gentleman Thief's Swing Play | 3600→4350 Target 🚀
📊 MARKET OVERVIEW
Asset: ETHEREUM/TETHER (ETH/USDT)
Timeframe: Swing/Day Trade
Bias: 🐂 BULLISH
Strategy Type: Wealth Accumulation Map
🎭 THE SETUP (A.K.A. "THE HEIST PLAN")
🟢 ENTRY ZONE
Flexible Entry: Any current price level accepted
Translation: We're not picky—grab your ticket to the moon wherever you are!
🛑 STOP LOSS (THE "THIEF'S INSURANCE")
SL: $3,600
⚠️ Important Note for OG Thieves:
Listen up, Ladies & Gentlemen! This is MY stop loss level, not a divine commandment. You've got your own vault to protect—set YOUR stop loss based on YOUR risk appetite. Your money, your rules, your responsibility. Don't blame me if you ignore risk management! 💼
🎯 TAKE PROFIT TARGET
TP: $4,350
📍 Technical Confluence:
Triangular Moving Average acting as strong resistance
Overbought conditions developing
Potential bull trap zone forming
⚠️ Another Friendly Reminder:
Dear OG Thieves, this is MY target—not financial advice carved in stone! Scale out, take profits along the way, or let it ride. YOU decide when to count your loot. Exit strategy is YOUR masterpiece! 🎨
🔍 KEY TECHNICAL LEVELS
Resistance Zones:
Primary: $4,350 (TMA + Overbought)
Watch for rejection wicks at this level
Support Foundation:
$3,600 (Our safety net)
Strategy:
Classic "buy the dip, sell the rip" with proper risk management. We're riding the wave, not fighting the tide! 🌊
👀 RELATED PAIRS TO WATCH
Correlated Assets:
BTC/USDT ( CRYPTOCAP:BTC ) - King leads, ETH follows (usually)
SOL/USDT ( CRYPTOCAP:SOL ) - Alt season companion
MATIC/USDT ( SEED_DONKEYDAN_MARKET_CAP:MATIC ) - Ethereum ecosystem play
BNB/USDT ( CRYPTOCAP:BNB ) - Exchange token correlation
AVAX/USDT ( CRYPTOCAP:AVAX ) - Smart contract platform peer
💡 Correlation Notes:
When BTC pumps, ETH typically follows with stronger percentage moves. Watch Bitcoin dominance—if it drops while BTC rises, expect explosive alt season momentum. SOL and AVAX often move in tandem with ETH as the "Layer 1 trio."
⚙️ RISK MANAGEMENT (THE GENTLEMAN'S CODE)
✅ Never risk more than 1-2% of portfolio per trade
✅ Consider partial profit-taking at resistance levels
✅ Trail your stop loss as price advances
✅ Don't marry your position—take the money and run when it's time! 💰
🎩 FINAL WORDS FROM YOUR FRIENDLY NEIGHBORHOOD CHART THIEF
This analysis combines technical indicators, market structure, and a healthy dose of swagger. Remember: The market doesn't care about your feelings, your bills, or your dreams. Protect your capital like it's the Crown Jewels! 👑
Trade smart, stay humble, and may the pips be ever in your favor! 🎲
✨ If you find value in my analysis, a 👍 and 🚀 boost is much appreciated — it helps me share more setups with the community!
#ETHUSDT #Ethereum #CryptoTrading #SwingTrading #DayTrading #TechnicalAnalysis #CryptoTA #ETHUSD #AltcoinTrading #CryptoStrategy #TradingIdeas #CryptoSignals #BullishSetup #RiskManagement #TradingView #ETH #Cryptocurrency #DigitalAssets #CryptoMarket #TradingCommunity
📈 Chart Analysis | 🎯 Swing Trading | 💎 Crypto Markets | 🚀 To The Moon