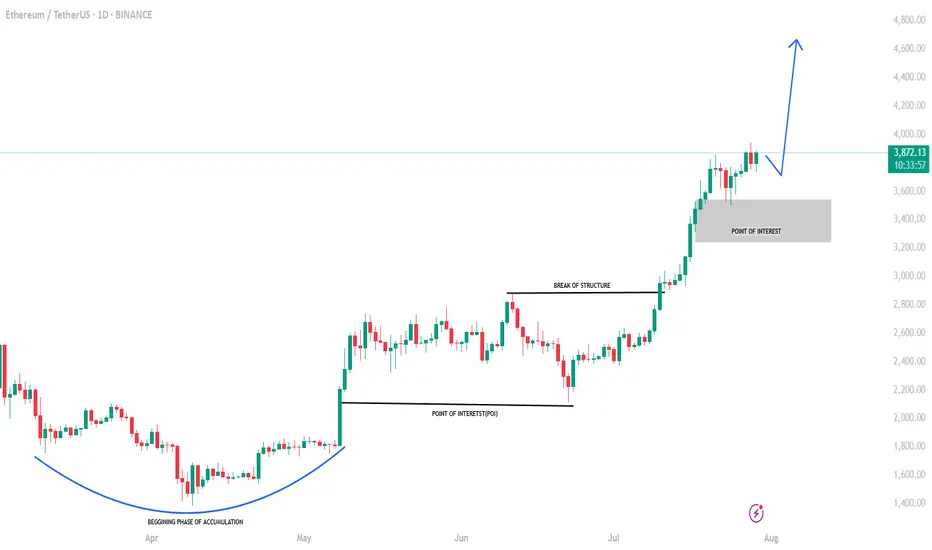
Ethereum Eyes $5K Breakout — Is a New ATH Coming?Ethereum is approaching its major resistance zone near $5,000, showing strong bullish momentum after bouncing off the supportive trendline. The recent candle confirms a macro bullish reversal.
If CRYPTOCAP:ETH breaks and closes above the resistance zone, it could open the path toward new all-time highs. As long as it holds above $2,900–$3,000, the structure remains bullish.
DYOR, NFA
Ethusdtsignal

Ethereum Correction Ending? Next Bullish Wave Loading!In the previous idea , I was able to find the Ethereum price top at $4,788 . The question is, has the Ethereum correction begun, or is there still hope for the creation of a new All-Time High(ATH)?
Ethereum ( BINANCE:ETHUSDT ) is currently trading near the Support zone($4,240-$4,186) , Cumulative Long Liquidation Leverage($4,205-$4,158) , and important Support lines .
In terms of Elliott Wave theory , it seems that Ethereum has completed a corrective wave . The corrective wave has a Double Three Correction structure(WXY) . If the Resistance zone($4,410-$4,324) and Cumulative Short Liquidation Leverage($4,416-$4,375) are broken, we can confirm the end of the corrective wave .
I expect Ethereum to start rising from important support lines and rise to at least $4,373 .
Second Target: $4,484
Third Target: $4,607
Stop Loss: $4,097
Note: Today's Fed Chair Powell Speaks can create excitement in financial markets, especially crypto.
Please respect each other's ideas and express them politely if you agree or disagree.
Ethereum Analyze (ETHUSDT), 1-hour time frame.
Be sure to follow the updated ideas.
Do not forget to put a Stop loss for your positions (For every position you want to open).
Please follow your strategy and updates; this is just my Idea, and I will gladly see your ideas in this post.
Please do not forget the ✅' like '✅ button 🙏😊 & Share it with your friends; thanks, and Trade safe.
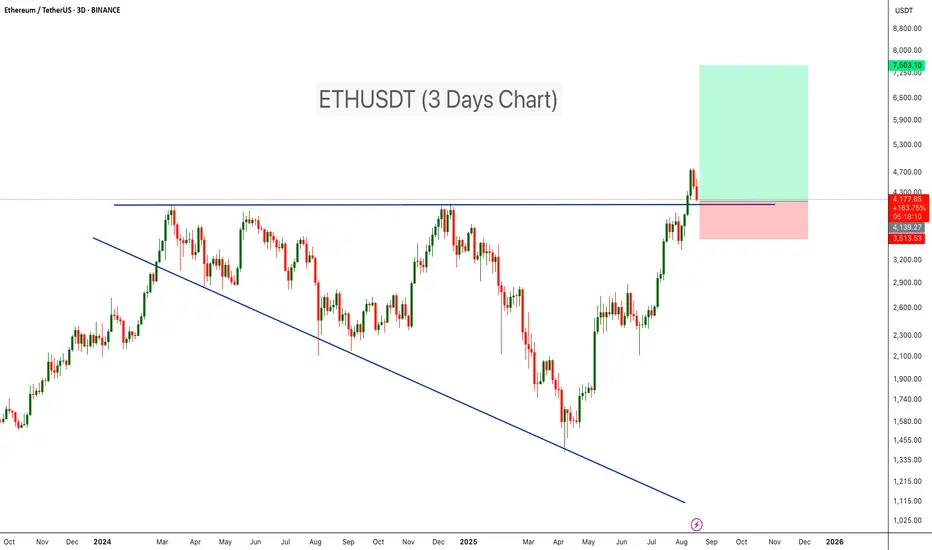
Ethereum Retesting Major Breakout ZoneBINANCE:ETHUSDT has completed a major breakout from a Broadening Wedge Pattern and is now retesting the wedge’s resistance line as support — a bullish continuation signal on the higher timeframe.
- Broadening Wedge Formation: ETH traded within a large broadening wedge throughout 2024 into early 2025, forming expanding highs and lows.
- Breakout Confirmation: The breakout above wedge resistance ($4,10) confirms bullish momentum and shifts market structure in favor of buyers.
-Retest in Progress: Price is currently pulling back, testing the former wedge resistance as fresh support — a textbook technical setup.
-Volume Validation: The breakout was accompanied by a surge in volume, strengthening the case for continuation.
🔷Entry Zone: $4,100 – $4,300
🔷Stop Loss: Below $3,500 to protect against a failed retest.
🔷Targets: $6,500 – $7,500
Cheers
Hexa
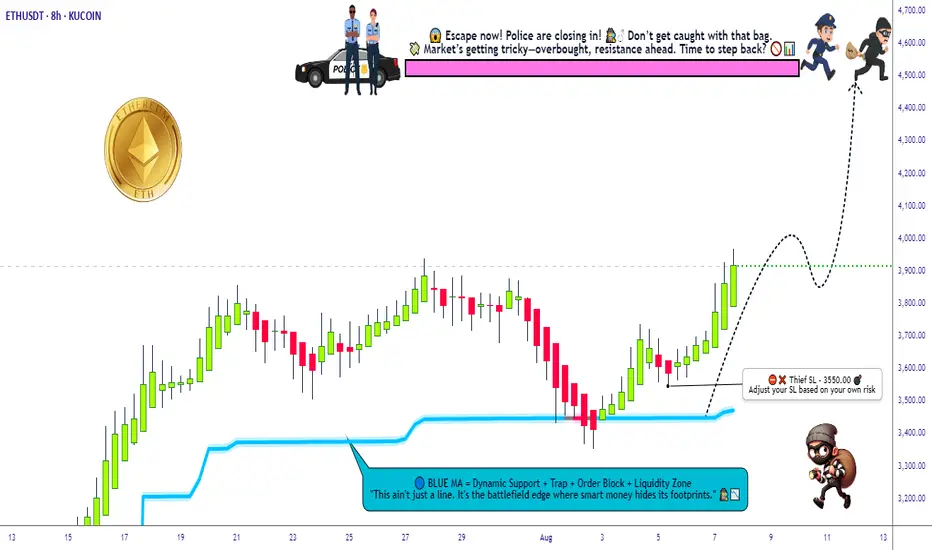
ETH/USDT Grid Plan » Bullish Loadout » Stealing the Top🚨ETH/USDT Crypto Heist Plan 🔓💰
Asset: ETH/USDT "Ethereum vs Tether"
Plan: 🟢 Bullish – Multi-Layered Entry Grid
Strategy: Thief-style limit orders (GRID / DCA stacking)
Entry: Any Dip is a Heist Opportunity 💸
Stop Loss: 🔻 3550.00
Target: 🎯 4500.00
👋 Hey Thieves & Money Makers!
Get your gear ready – it's time to loot the Ethereum Vault 💎🚀
🔥Thief Trader's ETH/USDT Master Robbery Blueprint🔥
This ain’t your average plan — we break in with layered entries, lock in on breakout volatility, and ride the bullish train to the moon 🌕.
💼 Entry Strategy:
No need to overthink. Any dip = loot zone!
Stack multiple limit orders like a pro (15M–1H level).
We're playing the grid game. The more dips, the bigger the stash! 🧱🪙
🚨 Stop Loss:
Set SL at 🔻3550 or under recent swing lows.
Adjust by risk appetite and how many entries you stack.
Thieves don’t chase – they calculate risk.
🎯 Target Zone:
We're eyeing the 4500 mark. But remember – exit before the vault shuts if momentum slows. 🏃♂️💨💰
🔁 Scalpers Alert:
Only long. Only bullish. Only profit. 🧲💥
Stack it, trail it, and let it run with a sniper's precision. 🎯🧠
📊 Market Context:
ETH bulls gaining control post-accumulation.
Strong on-chain metrics, solid macro tailwinds.
Bears trapped in the shadows – we move in daylight. 🐂🆚🐻
📰 Warning – News Bombs Ahead!
💣 Avoid fresh positions during high-impact events.
🎯 Use Trailing SLs to protect your loot.
Smart robbers never get caught unguarded.
💥BOOST This Idea if you're part of the robbery crew 🔐💰
Every boost powers our next move.
Let's rob the crypto market together – one breakout at a time! 🏴☠️📈🤑
Thief Trader™ – Locking Targets. Looting Charts.
💎🕵️♂️📊 #CryptoHeist #ThiefStyle #ETHBreakout #GridGang #BullMode
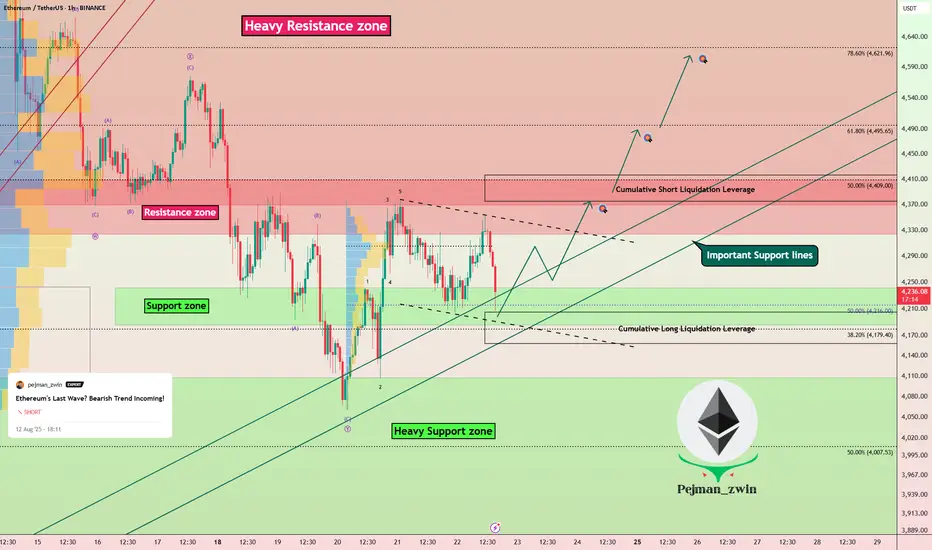
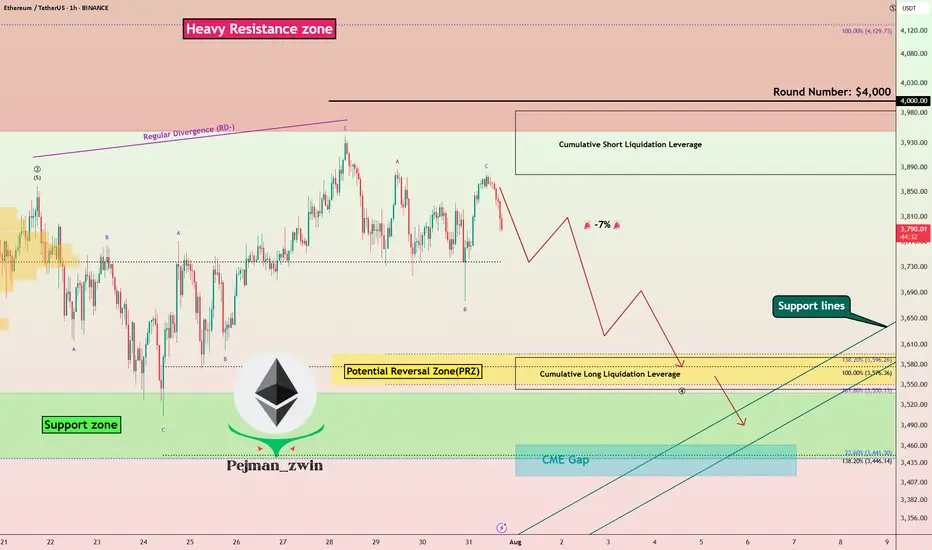
Ethereum's Last Wave? Bearish Trend Incoming!Ethereum ( BINANCE:ETHUSDT ) started to rise and pump as I expected in the previous idea .
Ethereum is currently trading in a Heavy Resistance zone($4,868(ATH)-$3,977) near the Potential Reversal Zone(PRZ) , Cumulative Short Liquidation Leverage($4,527-$4,452) , and the upper line of the ascending channel(potential) .
In terms of Elliott Wave theory , Ethereum appears to be completing microwave 5 of main wave 5 . Main wave 5 could complete at the Potential Reversal Zone(PRZ) .
Also, we can see the Regular Divergence(RD-) between Consecutive Peaks .
Before any conclusions, let's take a look at the ETHBTC ( BINANCE:ETHBTC ) chart.
ETHBTC also indicates the end of the uptrend, and if the market falls , we can expect ETH and the tokens on the Ethereum blockchain to undergo a correction this time.
I expect Ethereum to bearish trend in the coming days and at least close the CME Gap($4,185-$4,080) .
One of the tokens that we can use for short positions alongside Ethereum is the ENS token ( BINANCE:ENSUSDT ). ENS is the decentralized naming system built directly on the Ethereum blockchain, simplifying crypto addresses into human-readable names .
Cumulative Long Liquidation Leverage: $4,145-$4,094
CME Gap: $3,461-$3,417
Note: Stop Loss: $4,780
Do you think Ethereum will create a new All-Time High(ATH) soon, or should we wait for a correction?
Please respect each other's ideas and express them politely if you agree or disagree.
Ethereum Analyze (ETHUSDT), 4-hour time frame.
Be sure to follow the updated ideas.
Do not forget to put a Stop loss for your positions (For every position you want to open).
Please follow your strategy and updates; this is just my Idea, and I will gladly see your ideas in this post.
Please do not forget the ✅' like '✅ button 🙏😊 & Share it with your friends; thanks, and Trade safe.

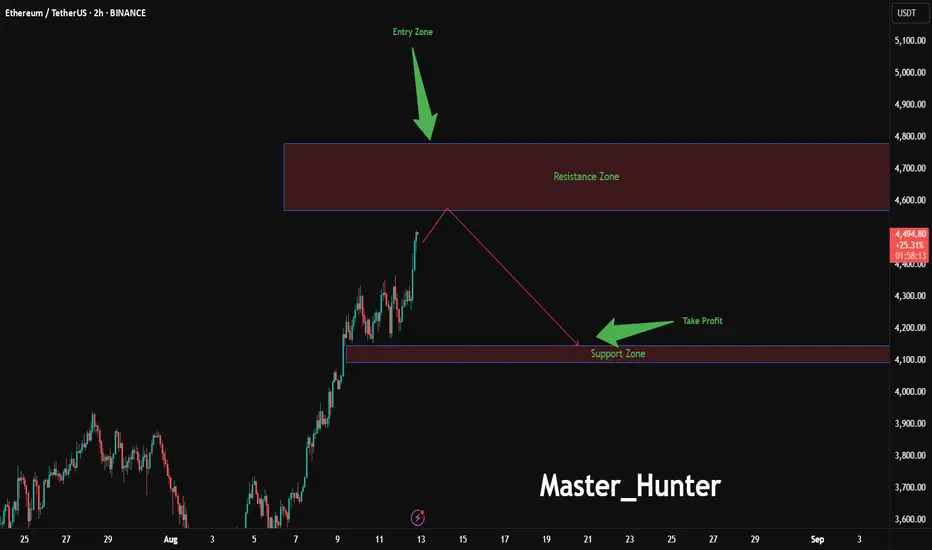
Ethereum Drop Zone Approaching?BINANCE:ETHUSDT is flashing warning signs on the 2-hour chart, with an entry zone between 4570-4780 near a critical resistance level that has capped recent rallies.
This setup suggests a potential reversal , targeting a profit zone between 4145-4093 where strong support and the 200-day EMA converge. Set a stop loss at 4780 on a close above to protect against a false breakout, keeping risk tightly controlled. A break below 4550 with increasing volume could confirm the downward move, especially if Bitcoin leads the market lower.
Keep an eye on Ethereum network upgrades and overall crypto market sentiment, as these could act as key catalysts. This trade offers a strategic opportunity for those ready to navigate the volatility—share your insights below!
#ETHUSDT #EthereumTrading #CryptoSignals #TechnicalAnalysis #TradingView #DayTrading #MarketAnalysis
ETHUSDT, Is it time for the biggest Altcoin?Hi fellow traders, ETHUSDT will be ready to make a move higher from the blue box after it completes the flag correction in ABC formation. Target will be 3429.75. Good luck and trade safe!

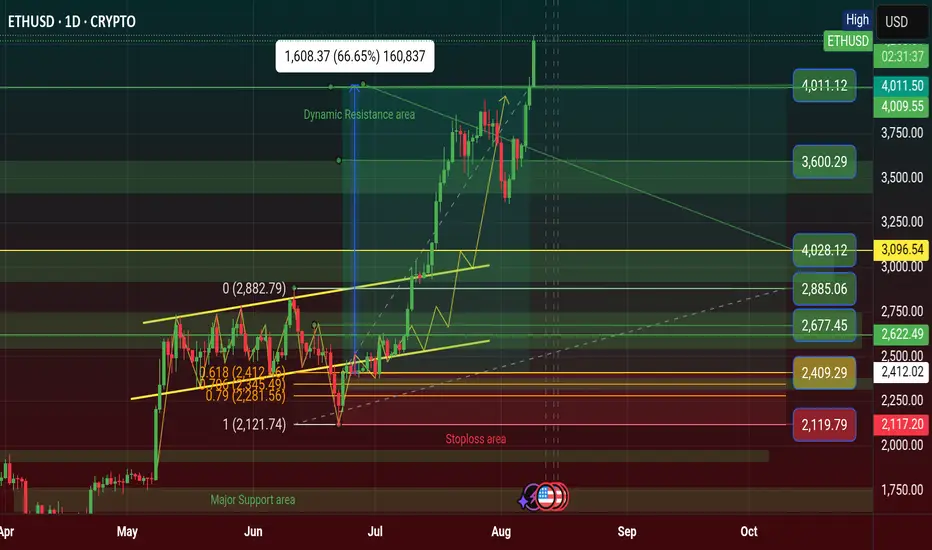
$ETH Finally $4,011 Profit Done Again, Breakout $4K price areaIf CRYPTOCAP:ETH price will be touch $4.5K and it's Breakout it will be happened $5K of new historical ATH.
Ethereum Price Target $4K as Trader Plans Partial Exit
Ethereum Maintains Market Leadership
The Ethereum Price Target $4K narrative is gaining traction as ETH continues to outperform the broader crypto market. Despite volatility, Ethereum’s resilience and strong fundamentals have kept it at the forefront of investor attention.
One experienced trader noted that ETH is “still the strongest asset in the crypto market,” following their lower time frame (LTF) plan closely. They believe the market could be nearing a local top, potentially with a brief spike — or deviation — above the $4,000 level.
Planned Exit Strategy Between $4K and $4.3K
The trader shared a specific strategy: selling 50% of their spot Ethereum holdings between $4,000 and $4,300. This position has been held for nearly two years, with an average entry price of around $2,400, meaning the planned sale would lock in substantial profits.
Such an approach reflects disciplined risk management — capturing gains after a strong rally while maintaining exposure in case the trend continues higher.
What This Means for the Market
If Ethereum does approach the $4K–$4.3K range, several scenarios are possible:
A deviation above $4K followed by a retracement could confirm a local top.
Sustained momentum beyond $4.3K could signal a stronger-than-expected breakout.
Broader crypto market sentiment will likely play a major role in price direction.
With ETH’s fundamentals stronger than ever and network upgrades continuing, the medium- to long-term outlook remains bullish — even if short-term corrections occur.
#highlights #BinanceSquareFamily #Binance #ETH #SUBROOFFICIAL
Disclaimer: This article is for informational purposes only and does not constitute financial advice. Always conduct your own research before making any investment decisions. Digital asset prices are subject to high market risk and price volatility. The value of your investment may go down or up, and you may not get back the amount invested. You are solely responsible for your investment decisions and Binance is not available for any losses you may incur. Past performance is not a reliable predictor of future performance. You should only invest in products you are familiar with and where you understand the risks. You should carefully consider your investment experience, financial situation, investment objectives and risk tolerance and consult an independent financial adviser prior to making any investment.

ETH/USDT — Resistance Around $4.0k: Breakout or Rejection?Summary
The weekly chart shows Ethereum testing a multi-year horizontal resistance zone around $3.9k–$4.1k, a level repeatedly tested since 2021. The measured move on the chart projects a potential target of $4,868 — about +$868 or ~21–22% upside — if a confirmed breakout occurs on the weekly timeframe.
---
Technical Analysis (based on chart)
Timeframe: Weekly (1W). The current test is highly significant due to the higher timeframe, with medium- to long-term implications.
Key Levels:
Major resistance zone: ≈ $3,950 – $4,100 (yellow line).
Breakout target: $4,868 (≈ +$868 or ~+21–22% from the breakout zone).
First support if rejected: ≈ $3,300 – $3,600. Stronger support at $2,100 – $2,750.
Price Action: Price has made multiple peaks at this zone (multiple tops), signaling strong supply. However, recent higher lows suggest growing bullish momentum — if a breakout occurs.
Pattern: Multi-year horizontal resistance. Possible outcomes:
Rejection: Acts as a triple-top / horizontal supply zone.
Breakout: Transitions into a range breakout setup with measured target.
---
Bullish Scenario (confirmation needed)
1. Confirmation signal: Weekly close above $4.0k zone with strong follow-through in the next week.
2. Entry strategies:
Conservative: Wait for a retest (resistance → support) before entering, with stop below retest (~$3.7k).
Aggressive: Enter on breakout, stop below breakout candle low.
3. Target: First target ~$4,868 (measured move). If momentum persists, higher targets may be reached.
4. Invalidation: Weekly close back below $3.7k–3.8k after breakout.
---
Bearish Scenario (if rejection occurs)
1. Confirmation signal: Bearish rejection candle (pin bar / engulfing) on weekly + no breakout close.
2. Entry strategies: Short or take profit on longs after confirmed rejection; ideally backed by bearish follow-through next week.
3. Target downside: First support $3.3k–3.6k; stronger drop could retest $2.1k–2.8k zone.
4. Invalidation: Weekly close back above $4.1k with strong bullish volume.
---
Risk Management & Notes
Weekly close is key — avoid reacting solely to intraday wicks.
Volume matters: No volume = higher risk of false breakout.
Position sizing: Keep risk controlled (e.g., 1–2% per trade), stops in logical zones.
Multi-timeframe check: Use daily chart for precise entries and watch for orderflow/news catalysts.
---
Pattern Notes
Multiple Tops / Horizontal Supply: Sellers have consistently defended this level.
Ascending pressure: Higher lows into resistance can increase breakout probability.
Measured Move: Distance from breakout zone to target is about $868 — matching the chart’s projection.
---
Hashtags
#ETH #ETHUSDT #Ethereum #Crypto #Breakout #Resistance #WeeklyChart #CryptoAnalysis #TechnicalAnalysis

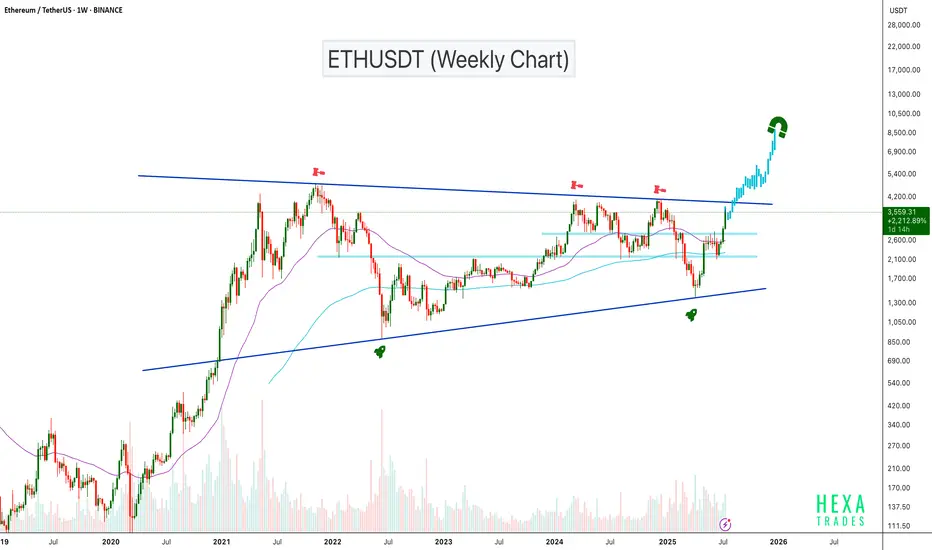
ETH Testing Critical $4K Resistance!BINANCE:ETHUSDT is trading inside an ascending triangle on the weekly chart, with price compressing between the resistance line and a rising support line. After a strong rally from the $1,500 demand area, ETH has reclaimed the 100- and 200-week EMAs and is testing the triangle’s upper trendline with increasing volume.
A weekly close above $4,000–$4,200 would confirm a triangle breakout and open upside toward $6,000–$7,500, while a rejection could send price back toward $3,200–$3,000 for further consolidation. Wait for a clear weekly close and volume confirmation.
Cheers
Hexa
BITSTAMP:ETHUSD CRYPTOCAP:ETH

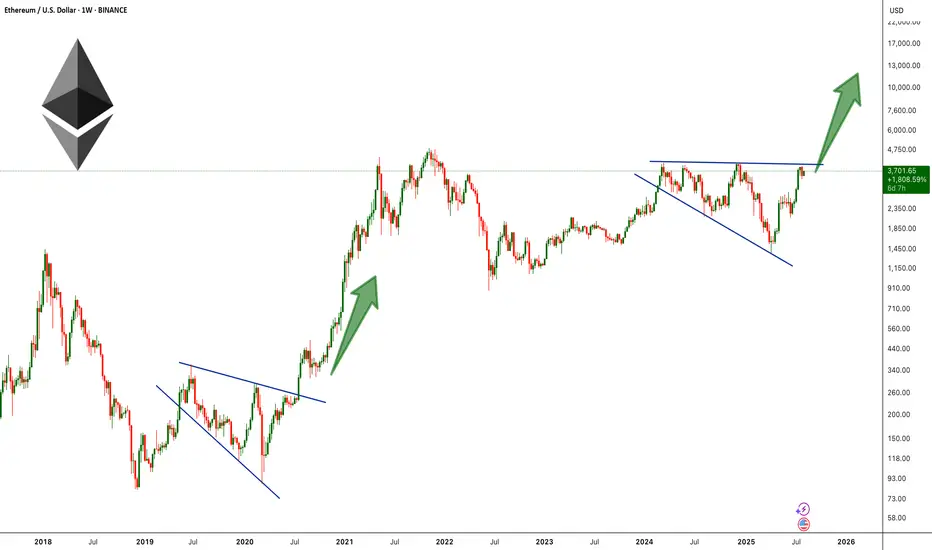
ETH Broadening Wedge Formation !BINANCE:ETHUSDT is forming a broadening wedge pattern on the weekly chart, a structure that often signals high volatility and strong momentum once the price breaks out. This setup is reminiscent of ETH’s 2019–2020 pattern, which also formed as a broadening wedge before breaking to the upside and triggering a historic rally to new all-time highs.
Currently, ETH is pressing against the upper resistance line of the wedge near the $3,900–$4100 zone, a level that has acted as major resistance multiple times in recent months. A decisive breakout above this barrier could ignite strong bullish momentum, opening the path toward the $6,000–$10,000 range.
Cheers
Hexa
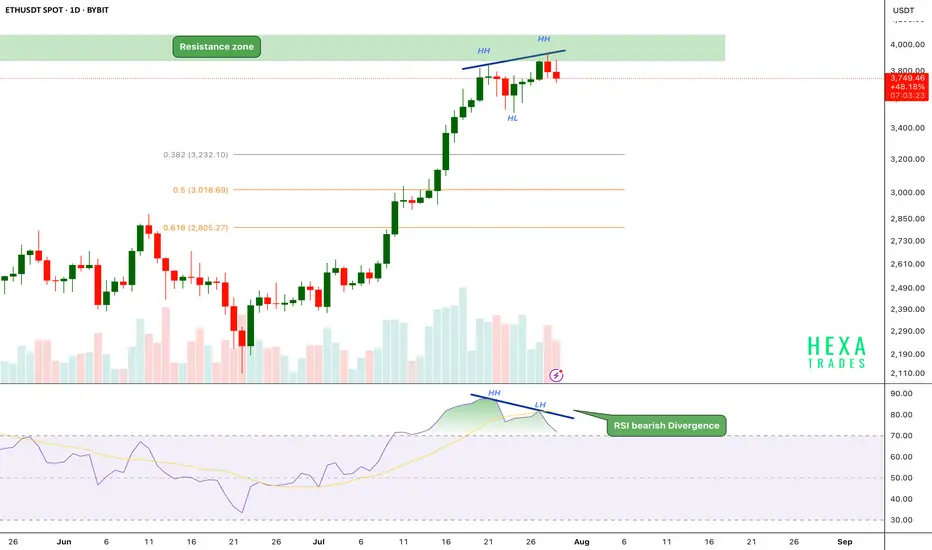
ETH Bearish Divergence!CRYPTOCAP:ETH has been in a strong uptrend, printing consistent higher highs (HH) and higher lows (HL). However, on the daily chart, the price has now reached a critical resistance zone near the $3,800–$4,000 range.
Key Points:
🔸 Bearish RSI Divergence
While price action has formed a new higher high, the RSI has printed a lower high, signaling bearish divergence.
This indicates that upward momentum is weakening even as price attempts to push higher — a common early warning of a possible short-term reversal.
🔸 Fibonacci Retracement Levels
The fib 0.382 at $3240 and 0.5 and 0.618 retracement levels are sitting around $3,000 and $2,800, respectively, potential targets if a correction follows.
🔸 Volume Profile
Volume is gradually declining as price approaches resistance, suggesting buyer exhaustion.
If the price breaks above the $4,000 psychological resistance, we could see a strong bullish move.
ETH is facing strong resistance after a powerful rally, with RSI bearish divergence and weakening momentum hinting at a possible short-term pullback. We should be cautious entering fresh longs here without confirmation.
Support: $3,200, $3,000, and $2,800
Cheers
Hexa
BINANCE:ETHUSDT BITSTAMP:ETHUSD
ETH at Critical Resistance + Liquidation Zone | Time to Short?Today I want to analyze Ethereum ( BINANCE:ETHUSDT ) on the 1-hour time frame . Is there a short position opportunity?
Please stay with me.
Ethereum is currently trading near a Heavy Resistance zone($4,390-$3,950) , Cumulative Short Liquidation Leverage($3,983-$3,878) and the $4,000 ( round number ). $4,000 could be a psychological number to sell .
In terms of Elliott Wave theory , Ethereum appears to have completed the main wave 3 at $3,860 and is currently completing the main wave 4 . The main wave 4 could have a Double Three Correction(WXY) or Expanding Flat(ABC/3-3-5) , with the Expanding Flat structure being more likely .
One of the reasons why shorting Ethereum could be better than shorting Bitcoin right now is that ETHBTC ( BINANCE:ETHBTC ) is currently trading above the ascending channel and is likely to correct to Fibonacci levels .
Also, we can see the Regular Divergence(RD-) between Consecutive Peaks.
I expect Ethereum to drop to at least the Potential Reversal Zone(PRZ) and attack the Support lines ( Second target ) .
Cumulative Long Liquidation Leverage: $3,591-$3,543
CME Gap: $3,461-$3,417
Note: Stop Loss: $4,023
Please respect each other's ideas and express them politely if you agree or disagree.
Ethereum Analyze (ETHUSDT), 1-hour time frame.
Be sure to follow the updated ideas.
Do not forget to put a Stop loss for your positions (For every position you want to open).
Please follow your strategy and updates; this is just my Idea, and I will gladly see your ideas in this post.
Please do not forget the ✅' like '✅ button 🙏😊 & Share it with your friends; thanks, and Trade safe.
ETHUSDT - FUTURES SIGNAL FUTURES SIGNAL
Coin: ETH
Direction: LONG
🟢Input range: market/3578
✔️ТР: 3726/3902
❌SL: 3501
We work from the order block zone, in which I expect a price reversal.

ETH: Will Price Continue Upwards Movement! ETH has been steadily bullish in recent times, as the crypto market experienced a significant increased a safer option to invest around the global investment community. DXY and other major currencies currently experiencing a major drawdown in prices which indirectly helping the crypto market to remain bullish. While looking at how eth has performed in recent past, we can see it creating a record high in coming weeks.
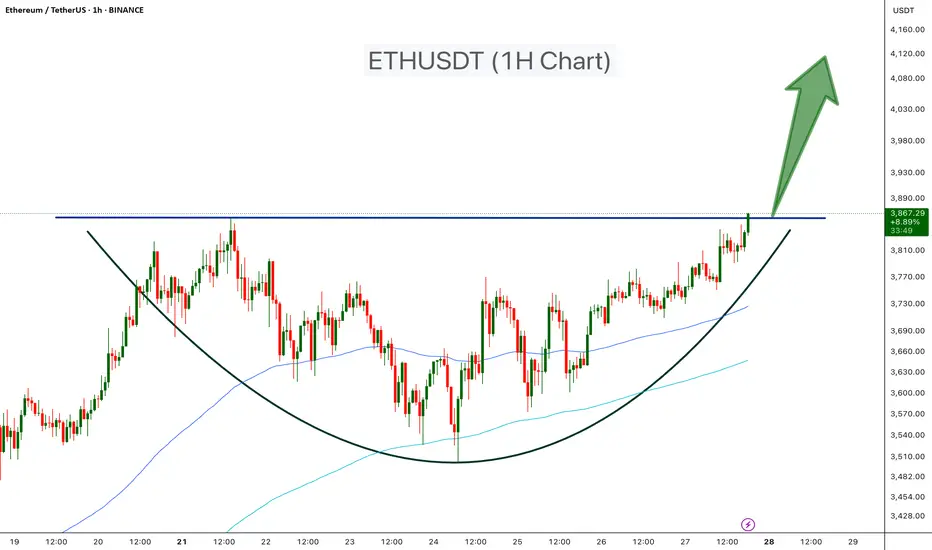
ETHUSDT Classic Cup PatternEthereum is forming a textbook Cup pattern on the 1H chart, signaling a strong bullish setup. After a rounded bottom forming the “cup,” ETH is now pushing toward the neckline resistance around $3,870. A confirmed breakout above this level could lead to a powerful upward move.
Cheers
Hexa
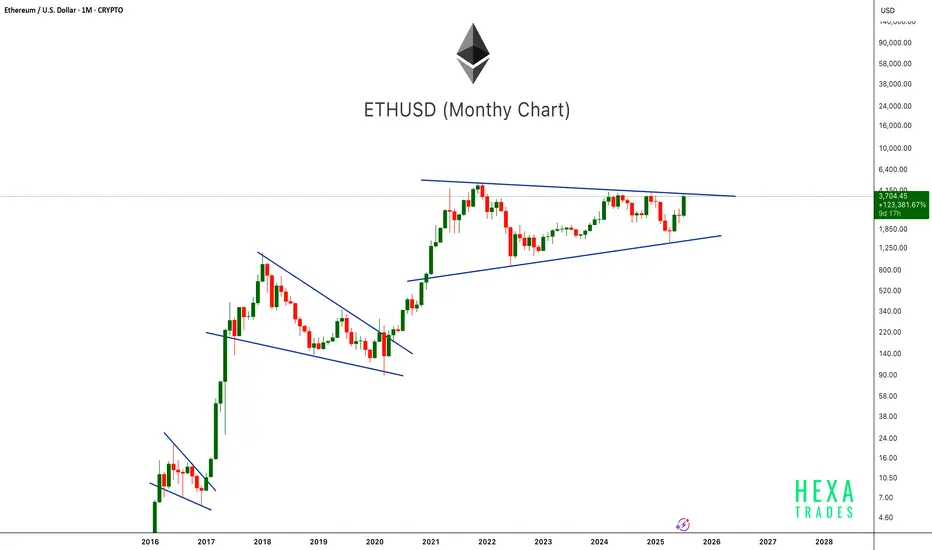
ETH Ready to Pop!ETHUSD is once again testing the upper boundary of a long-term symmetrical triangle on the monthly chart. This pattern has been forming since the 2021 peak, showing consistently higher lows and lower highs. Previous breakouts from similar consolidation patterns (2017 and 2020) led to massive rallies. With the current monthly candle showing strong bullish momentum, a confirmed breakout above this structure could mark the beginning of Ethereum's next major bull run. Keep an eye on the breakout level for confirmation.
Cheers
Hexa
ETHUSDT Gearing Up for Explosive MoveBINANCE:ETHUSDT has been trading inside an ascending triangle pattern for the past 1,600 days. The price is now moving toward the triangle's resistance zone with strong volume support. A confirmed breakout above this resistance could trigger a powerful bullish move, with potential targets in the $6,000–$8,000 range.
Cheers
Hexa🧘♀️
BITSTAMP:ETHUSD
ETHUSDT BUY / Long SetupThis 4hrs candle closes above the mentioned level, then took long from 50% fib level of the fvg, and put sl below the recent swing low, I will update the trade whether it's active or not? tp towards 3.3-3.4k , while btc.d getting recked so becareful shorting any altcoin.

#ETHUSDT: Time For Big Price Distribution! Get Ready $5000ETH is currently in distribution and is on our target list. We expect a smooth price movement, potentially reaching $3100, $3800, and $5000. Use the entry zone to take a position; anything below the entry will invalidate the idea. Please use accurate risk management while trading.
Like, comment, and share this idea to encourage us to post more.
Team Setupsfx_

ETH Long / Buy SetupAs of many times mentioned that, will short eth above 3k or 3k, but it still shows Bullish momentum no sign of weakness, maybe this entry triggers during weekend due too low volume, search for ifvg, if any 1D or 4hr Bullish fvg truns into bearish ifvg then will take short on ETH. For now will take long with SL and proper risk management.

Ethereum Analysis – Vitalik’s Gas Cap Proposal Adds PressureToday, I want to show you the possible moves for Ethereum ( BINANCE:ETHUSDT ) this week.
Please stay with me .
Let’s first take a look at the important news that has come for Ethereum in the last 24 hours :
Ethereum’s Gas Cap Proposal Sparks Concerns
Ethereum co-founder Vitalik Buterin recently proposed EIP-7983 , introducing a gas limit cap to prevent potential DoS (Denial of Service) attacks on the network.
Bearish Takeaways:
This proposal reveals a current vulnerability in Ethereum’s infrastructure. If gas limits grow unchecked, nodes may fail to sync, leading to possible network instability.
Imposing a gas cap could temporarily reduce transaction throughput, affecting DeFi protocols and NFT platforms that rely on Ethereum’s scalability.
The market tends to react cautiously to core protocol changes, and this uncertainty could trigger short-term selling pressure.
Bullish Counterpoints:
The cap aims to strengthen the network’s long-term stability against spam and DoS attacks.
It’s still in the proposal stage, with no immediate impact on users or network performance.
Conclusion:
While the long-term impact may be positive, the short-term uncertainty and exposed risks provide a bearish narrative for Ethereum, especially amid growing competition from alternative chains.
--------------------------------------
Now let's take a look at the Ethereum chart on the 4-hour time frame .
Ethereum is currently trading near the Heavy Resistance zone($2,929-$2,652) and Resistance lines , and is also trying to break the Support line .
In terms of the Elliott Wave theory , it seems that Ethereum has completed the Zigzag Correction(ABC/5-3-5) , so we can expect the next bearish wave .
I expect Ethereum to fall to at least $2,433 AFTER breaking the Support line, and if the Support zone($2,491-$2,323) is broken, we should expect further declines.
Second Target: $2,374
Note: Stop Loss (SL) = $2,689= Worst Stop Loss(SL)
Please respect each other's ideas and express them politely if you agree or disagree.
Ethereum Analyze (ETHUSDT), 4-hour time frame.
Be sure to follow the updated ideas.
Do not forget to put a Stop loss for your positions (For every position you want to open).
Please follow your strategy and updates; this is just my Idea, and I will gladly see your ideas in this post.
Please do not forget the ✅' like '✅ button 🙏😊 & Share it with your friends; thanks, and Trade safe.
