EUR/USD – Falling Wedge Breakout | Bulls Eye Key Resistance ZoneTICKMILL:EURUSD The EUR/USD Pair , Price has been trading within a Wedge Pattern on the H1 chart, forming consistent higher highs and higher lows. Price action is now testing the upper boundary of the Pattern, signalling a possible breakout.
✅Market Context:
1️⃣Strong Upward Structure Inside the Pattern.
2️⃣Buyers are showing strength near Resistance.
3️⃣Breakout above the Trendline indicates Momentum continuation toward higher zones.
✅Trade Plan:
Entry: Buy after Confirmed Breakout above the Resistance (H1 candle close above trendline or retest of the breakout).
💰Take Profit (TP): At the Key Zone – a Major Resistance area identified ahead.
🛑Stop Loss (SL): Below the Pattern Structure.
🟢 Technical Outlook:
Pattern: Falling Wedge (Bullish Reversal)
Confirmation: Breakout & Retest
Targets: 1.1650 → 1.1770
Support Zone: 1.1500 – 1.1450
Momentum: Bullish bias gaining strength
✅Psychological Discipline :
1️⃣Stick to plan – No Revenge Trades.
2️⃣Accept losing trades as Part of the Strategy.
3️⃣Risk only 1–2% of your account balance per trade.
📊 Fundamental View:
The Euro is gaining momentum after recent comments from ECB officials indicating cautious optimism around inflation stability. Meanwhile, the USD faces mild pressure as traders anticipate possible rate cuts by the Federal Reserve in the coming months. Market sentiment currently favors risk assets, giving EUR/USD short-term upside potential.
✅ Support this analysis with a
LIKE 👍 | COMMENT 💬 | FOLLOW 🔔
It helps a lot & keeps the ideas coming!
⚠️ Disclaimer: This analysis is for educational purposes only and does not constitute financial advice. Forex trading involves high risk. Trade only with capital you can afford to lose and always do your own research.
EUR

Could ongoing Fed rate-cut expectations keep boosting the euro?
Dollar weakness driven by Fed rate-cut expectations and a softening US labor market has supported the euro’s appreciation. However, views within the ECB on further easing remain divided.
Croatian National Bank Governor Vujčić noted that inflation risks in the Eurozone are broadly balanced and growth is strengthening more than expected, implying that additional rate cuts are unlikely in the near term.
On the other hand, ECB Rehn warned that persistent declines in energy prices and ongoing economic risks could push inflation below the 2% target.
EURUSD continues to trend higher within the ascending channel, forming higher lows. The price remains above the diverging bullish EMAs, indicating a potential extension of bullish momentum.
If EURUSD holds above EMA21 and within the ascending channel, the price may advance toward the resistance at 1.1670.
Conversely, if EURUSD breaks below EMA21 and the channel’s lower bound, the price could retreat toward the support at 1.1580.

EUR/USD - Multi Timeframe Analysis🧭 WEEKLY – Big Picture Bias (HTF Boss Level)
The weekly is consolidating inside a massive range between the mid-1.14s and the mid-1.18s.
Price has been stuck in that orange consolidation box for ages — building orders, trapping both longs and shorts.
But here’s the key:
🔥 Wave count wants a (3) push up
🔥 Structure is still bullish
🔥 Lows are protected
🔥 Liquidity is stacked ABOVE
Weekly is screaming:
➡️ “When I break out of this range, I’m sending it toward 1.20+.”
This is the expansion phase loading.
📅 DAILY – The Transition Zone
Daily just broke structure (BOS) and is pulling back into a clean Daily demand block.
This is the “engine room” for the next leg.
✔️ Trendline retest
✔️ Clean demand
✔️ Deviation → reclaim
✔️ Rejection of lower channel
And above?
📌 External BSL at the top of the channel
Price LOVES that level.
Daily bias:
➡️ Pullback → continuation into 1.17 – 1.18 zone
Daily wants to go UP.
⏳ 4H – Execution Level (Where You Actually Enter)
This is where the chess game gets spicy.
4H is sitting right above strong support with:
🔹 BOS
🔹 Retest of weak resistance
🔹 Re-entry into the channel
🔹 Daily demand just below
🔹 Perfect wave (1)(2)(3)(4)(5) corrective structure already completed
4H is showing small bearish trendline pressure,
but it’s weak — not impulsive, not HTF aligned.
So the play is:
🔻 Let price tag the daily demand (grey box)
🔺 Load the buy
🚀 Send to 1.17 – 1.1850 entry zone
Once 4H breaks that weak resistance?
It becomes a clean runway.
🎯 Full Forecast Summary (Simple Version)
HTF (Weekly)
🚀 Bullish
📌 Consolidating before expansion
🎯 Target: 1.2000 area (after breakout)
Daily
🔻 Pullback into demand
🔺 Reversal expected
🎯 Target: 1.17000 – 1.18000
4H
🟦 Buy zone: Daily demand (grey box)
🔥 BOS already complete
🎯 First target: 1.17000
🎯 Second target: 1.18500
Bias :
➡️ Bullish after retest
➡️ Continuation move is building
➡️ Lows are protected, highs are exposed
⚡ The Story the Chart is Telling
“Let me correct into demand, tag the daily block, kick the weak trendline away…
then I’m flying to take every BSL above.”
This is clean SMC + Elliott alignment.
Textbook.

EUR/USD – H4 Wedge Pattern | Dollar Weakness & Fed Cut Bets🧠 Setup Overview:
EUR/USD is forming a falling wedge pattern on the H4 chart — a potential bullish reversal structure after weeks of downside pressure. The pair is testing the upper wedge trendline, suggesting a possible breakout, but confirmation is still pending. FX:EURUSD
📊 Trading Plan: ✅ Bullish Scenario:
🟢Watch for a confirmed breakout above the wedge and cloud resistance zone.
🟢If confirmed, expect a move toward 1.1730 (1st Resistance) and 1.1800 (2nd Resistance).
⚙️ Technical Levels:
🟢 1st Resistance: 1.1732
🟢 2nd Resistance: 1.1804
🔴 Support Zone: 1.1500 – 1.1470
🧩 Fundamental Updates (Today – 9 Nov 2025):
1️⃣ U.S. Treasury yields slipped slightly as surveys showed weaker consumer confidence, softening the dollar’s tone.
2️⃣ Fed rate cut expectations increased — markets now price a 66% chance of a 25 bps cut in December, according to CME FedWatch.
3️⃣ Government funding worries: renewed concerns over a potential U.S. government shutdown weighed on sentiment and limited USD demand.
🔴These factors combined create short-term bearish pressure on USD, which may fuel a EUR/USD rebound if momentum sustains above the wedge.🔴
#EURUSD #Forex #PriceAction #TechnicalAnalysis #ChartPattern #FallingWedge
#FundamentalAnalysis #FedWatch #USD #EUR #ForexSignals #KABHI_TA_TRADING #ChartsDontLieTradersDontQuit #SwingTrading #ForexEducation #FXMarket #TradingView
⚠️ Disclaimer:
This post is for educational purposes only — not financial advice. Always perform your own analysis and manage risk carefully before entering trades.
💬 Support My Work ❤️
If you like this analysis — drop a LIKE 👍, leave a COMMENT 💭, and FOLLOW 🔔 to stay updated with more Forex setups, price action insights, and live market fundamentals!

EURUSD FRGNT Daily Forecast -Q4 | W46 | D14 | Y25 | 📅 Q4 | W46 | D14 | Y25 |
📊 EURUSD FRGNT Daily Forecast
FRGNT FUN COUPON FRIDAY
🔍 Analysis Approach:
I’m applying Smart Money Concepts, focusing on:
Identifying Points of Interest on the Higher Time Frames (HTFs) 🕰️
Using those POIs to define a clear trading range 📐
Refining those zones on Lower Time Frames (LTFs) 🔎
Waiting for a Break of Structure (BoS) for confirmation ✅
This method allows me to stay precise, disciplined, and aligned with the market narrative, rather than chasing price.
💡 My Motto:
"Capital management, discipline, and consistency in your trading edge."
A positive risk-to-reward ratio, paired with a high win rate, is the backbone of any solid trading plan 📈🔐
⚠️ Losses?
They’re part of the mathematical game of trading 🎲
They don’t define you — they’re necessary, they happen, and we move forward 📊➡️
🙏 I appreciate you taking the time to review my Daily Forecast.
Stay sharp, stay consistent, and protect your capital
— FRNGT 🚀
OANDA:EURUSD

Falling towards key support?Fiber (EUR/USD) is pulling back toward the pivot level, which has been identified as an overlap support aligning with the 38.2% Fibonacci retracement. From this area, the pair has the potential to bounce toward the first resistance, which corresponds to a key swing-high level.
Pivot: 1.1585
1st Support: 1.1527
1st Resistance: 1.1712
Disclaimer:
The opinions given above constitute general market commentary and do not constitute the opinion or advice of IC Markets or any form of personal or investment advice.
Any opinions, news, research, analyses, prices, other information, or links to third-party sites contained on this website are provided on an "as-is" basis, are intended to be informative only, and are not advice, a recommendation, research, a record of our trading prices, an offer of, or solicitation for, a transaction in any financial instrument and thus should not be treated as such. The information provided does not involve any specific investment objectives, financial situation, or needs of any specific person who may receive it. Please be aware that past performance is not a reliable indicator of future performance and/or results. Past performance or forward-looking scenarios based upon the reasonable beliefs of the third-party provider are not a guarantee of future performance. Actual results may differ materially from those anticipated in forward-looking or past performance statements. IC Markets makes no representation or warranty and assumes no liability as to the accuracy or completeness of the information provided, nor any loss arising from any investment based on a recommendation, forecast, or any information supplied by any third party.

Bullish momentum to continue?EUR/CAD is reacting off the support level and could potentially rise from this zone toward our take-profit target.
Entry: 1.6317
Why we like it:
Price is pulling back into a well-defined support level.
Stop Loss: 1.6248
Why we like it:
It sits just below the pullback support, providing logical downside protection.
Take Profit: 1.6440
Why we like it:
This aligns with a previous swing-high resistance level.
Enjoying your TradingView experience? Review us!
Please be advised that the information presented on TradingView is provided to Vantage (‘Vantage Global Limited’, ‘we’) by a third-party provider (‘Everest Fortune Group’). Please be reminded that you are solely responsible for the trading decisions on your account. There is a very high degree of risk involved in trading. Any information and/or content is intended entirely for research, educational and informational purposes only and does not constitute investment or consultation advice or investment strategy. The information is not tailored to the investment needs of any specific person and therefore does not involve a consideration of any of the investment objectives, financial situation or needs of any viewer that may receive it. Kindly also note that past performance is not a reliable indicator of future results. Actual results may differ materially from those anticipated in forward-looking or past performance statements. We assume no liability as to the accuracy or completeness of any of the information and/or content provided herein and the Company cannot be held responsible for any omission, mistake nor for any loss or damage including without limitation to any loss of profit which may arise from reliance on any information supplied by Everest Fortune Group.

EUR/USD - Repeat of 2015 Cycle?🔁 Is History Repeating Itself on EUR/USD?
(Monthly timeframe breakdown — impulse, consolidation, sweep, impulse, pullback… all lining up again)
Your chart highlights two major market cycles, years apart, that look almost identical in structure. Let’s walk through it clearly.
✅ 1. First Cycle (2015–2018)
A) Consolidation Phase (Orange Box)
Price moved sideways for months.
No clear direction — accumulation/distribution.
Market was building energy.
B) Sweep / Manipulation
Price dipped below consolidation lows (labelled X).
Classic liquidity grab.
Smart money entry zone.
C) Impulse Phase (Green)
Strong bullish move immediately after the sweep.
Buyers stepped in aggressively.
Market structure shifted bullish.
D) Pullback Phase (Red)
First correction after the strong impulse.
Healthy sign — market resetting before continuation.
This forms the classic 4-step macro cycle:
👉 Consolidation → Sweep → Impulse → Pullback
✅ 2. Current Cycle (2023–2025)
Your right-side circle mirrors the exact same pattern.
A) Consolidation Phase (Orange Box)
Range-bound market identical to 2015–2016.
Energy building again.
B) Sweep / Manipulation
Price runs liquidity under the range.
Same "grab the lows before reversing" behaviour.
C) Impulse Phase (Green)
Strong bullish run out of the sweep.
Again, identical structure as the previous cycle.
D) Pullback Phase (Red)
Market currently correcting.
Exactly like the 2017 correction before continuation.
🔥 3. Are We Literally Repeating the Same Playbook?
Yes — the structure is almost a 1:1 replica.
Both cycles show:
✔ Long consolidation
✔ Sweep of the lows
✔ Major bullish impulse
✔ Initial corrective pullback
This suggests that EUR/USD is following the same macro script it used last time before rallying even further.
📈 4. What This Might Mean for Traders
If history continues to rhyme:
The current pullback may be the “reset” before another bullish leg.
The last time this pattern formed, price continued higher for months.
Smart money behaviour (sweep → impulse → pullback) indicates bullish continuation is likely, unless the pullback breaks the previous swing low.
🎯 5. Bottom Line
Yes — history is repeating itself.
The same 4-stage macro cycle is unfolding again:
Consolidation → Sweep → Impulse → Pullback → (Potential continuation)
Your chart perfectly highlights the symmetry, and traders should take note:
📍 If the macro structure remains valid, EUR/USD may be gearing up for another HTF bullish continuation.

EUR/USD - Im still Bearish until HTF followsEUR/USD – 4H Outlook (HTF SMC Breakdown)
🟤 1. HTF Range & Macro Context
Price is still trading inside a large higher-time-frame bearish range, with the entire structure sitting below the previous major BSL that got taken earlier in the chart.
The massive orange zone at the bottom is your HTF demand range — the last big corrective area before the external sell-side at 1.13–1.14.
This zone has been tested, respected, and held strongly.
HTF takeaway:
👉 Market is still bearish overall, but short-term bullish from HTF demand.
🔶 2. Reaction From HTF Demand
Price dipped into the HTF demand block, tapped the 71% discount level, swept internal SSL, and then gave a clean BOS to the upside.
Inside that orange zone:
Strong rejection wick
Multiple BOS confirmations
Mitigation of IMB/FVG
Clean liquidity sweep
This gives bulls temporary control.
This is the origin of the current bullish leg.
⚪ 3. Current 4H Structure
Price is now working its way back toward the 4H supply zone (your grey box), which also aligns with:
A BSL sitting above
4H imbalance
Micro premium zone
Unmitigated distribution candles
We’re in a mid-range climb from HTF demand → into 4H supply.
4H view:
👉 Expect bullish continuation until supply is reached.
🎯 4. Key Levels To Watch
🟢 Upside Targets
4H Supply Zone → First reaction area
BSL above supply → Liquidity draw
If price breaks, next target → 1.1750 region
🟠 Downside Levels
Your marked arrow shows price may:
Tap into 4H supply
Reject
Either return back into HTF demand
Or create a higher low for continuation
Most probable based on your chart:
👉 Tap supply → pullback → continuation up
(as long as HTF demand holds)
🧭 5. Bias Going Forward
Short-term = Bullish
Macro = Still bearish but correcting
Flow = Bullish until 4H supply
Your chart implies a bullish path:
Liquidity above (BSL) is the next draw
Price is climbing cleanly
No weakness until supply is met
After hitting the grey zone:
📍 Look for rejection + change of character
OR
📍 Strong break + retest for bullish continuation
(depends on reaction)
🔥 Summary (Quick Version)
HTF demand respected beautifully
Price created BOS after SSL sweep → bullish
Now climbing to 4H supply
Expect a reaction there
If supply breaks → next leg to 1.17
If supply holds → pullback into mid-range or demand

EURUSD Potential UpsidesHey Traders, in today's trading session we are monitoring EURUSD for a buying opportunity around 1.15600 zone, EURUSD is trading in an uptrend and currently is in a correction phase in which it is approaching the trend at 1.15600 support and resistance area.
Trade safe, Joe.

Bearish reversal off Fib onfluence?EUR/JPY is rising toward the pivot, which aligns with the 127.2% Fibonacci extension, as well as the 100% and 61.8% Fibonacci projections. A potential reversal could occur from this level toward the 1st support level.
Pivot: 179.74
1st Support: 18.65
1st Resistance: 180.73
Disclaimer:
The opinions given above constitute general market commentary and do not constitute the opinion or advice of IC Markets or any form of personal or investment advice.
Any opinions, news, research, analyses, prices, other information, or links to third-party sites contained on this website are provided on an "as-is" basis, are intended to be informative only, and are not advice, a recommendation, research, a record of our trading prices, an offer of, or solicitation for, a transaction in any financial instrument and thus should not be treated as such. The information provided does not involve any specific investment objectives, financial situation, or needs of any specific person who may receive it. Please be aware that past performance is not a reliable indicator of future performance and/or results. Past performance or forward-looking scenarios based upon the reasonable beliefs of the third-party provider are not a guarantee of future performance. Actual results may differ materially from those anticipated in forward-looking or past performance statements. IC Markets makes no representation or warranty and assumes no liability as to the accuracy or completeness of the information provided, nor any loss arising from any investment based on a recommendation, forecast, or any information supplied by any third party.

EURUSD H4 | Bearish Reversal Off Pullback ResistanceMomentum: Bearish
The price is currently reacting off the sell entry, which aligns with the 61.8% Fibonacci retracement level. It is also trading below the descending trendline that has at least three confirmed touches in the past.
Sell Entry: 1.1599
Pullback resistance
61.8% Fibonacci retracement
Stop Loss: 1.1668
Swing high resistance
Take Profit: 1.1533
Pullback support
61.8% Fibonacci retracement
High Risk Investment Warning
Stratos Markets Limited (tradu.com ), Stratos Europe Ltd (tradu.com ):
CFDs are complex instruments and come with a high risk of losing money rapidly due to leverage. 70% of retail investor accounts lose money when trading CFDs with this provider. You should consider whether you understand how CFDs work and whether you can afford to take the high risk of losing your money.
Stratos Global LLC (tradu.com ): Losses can exceed deposits.
Please be advised that the information presented on TradingView is provided to Tradu (‘Company’, ‘we’) by a third-party provider (‘TFA Global Pte Ltd’). Please be reminded that you are solely responsible for the trading decisions on your account. Any information and/or content is intended entirely for research, educational and informational purposes only and does not constitute investment or consultation advice or investment strategy. The information is not tailored to the investment needs of any specific person and therefore does not involve a consideration of any of the investment objectives, financial situation or needs of any viewer that may receive it. Past performance is not a reliable indicator of future results. Actual results may differ materially from those anticipated in forward-looking or past performance statements. We assume no liability as to the accuracy or completeness of any of the information and/or content provided herein and the Company cannot be held responsible for any omission, mistake nor for any loss or damage including without limitation to any loss of profit which may arise from reliance on any information supplied by TFA Global Pte Ltd.

Bearish drop off?EUR/CAD has rejected the pivot level, which serves as a pullback resistance, aligning with the 50% Fibonacci retracement. The pair could potentially drop toward the first support, which coincides with a previous swing low.
Pivot: 1.62489
1st Support: 1.61407
1st Resistance: 1.63091
Disclaimer:
The opinions given above constitute general market commentary and do not constitute the opinion or advice of IC Markets or any form of personal or investment advice.
Any opinions, news, research, analyses, prices, other information, or links to third-party sites contained on this website are provided on an "as-is" basis, are intended to be informative only, and are not advice, a recommendation, research, a record of our trading prices, an offer of, or solicitation for, a transaction in any financial instrument and thus should not be treated as such. The information provided does not involve any specific investment objectives, financial situation, or needs of any specific person who may receive it. Please be aware that past performance is not a reliable indicator of future performance and/or results. Past performance or forward-looking scenarios based upon the reasonable beliefs of the third-party provider are not a guarantee of future performance. Actual results may differ materially from those anticipated in forward-looking or past performance statements. IC Markets makes no representation or warranty and assumes no liability as to the accuracy or completeness of the information provided, nor any loss arising from any investment based on a recommendation, forecast, or any information supplied by any third party.

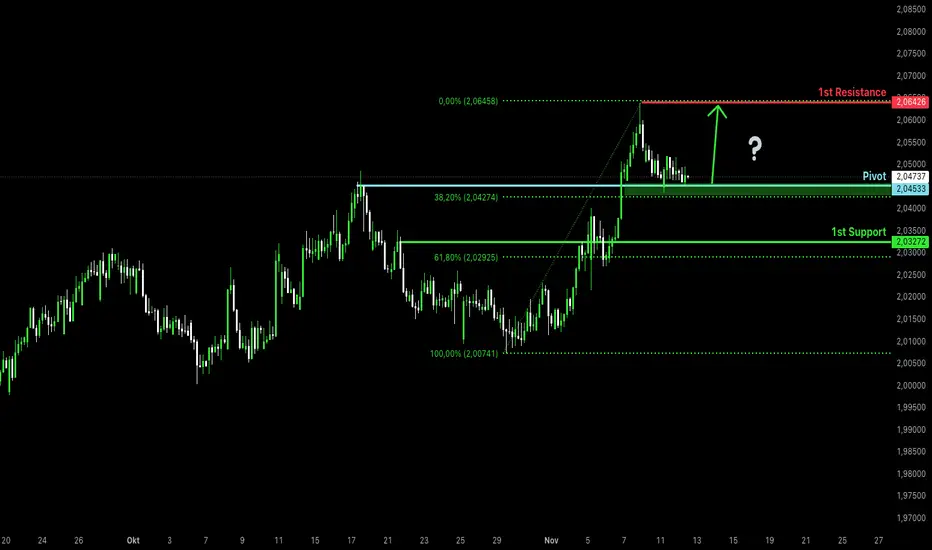
Bullish bounce off?EUR/NZD has bounced off the pivot and could rise to the swing high resistance.
Pivot: 2.04533
1st Support: 2.03272
1st Resistance: 2.06426
Disclaimer:
The above opinions given constitute general market commentary, and do not constitute the opinion or advice of IC Markets or any form of personal or investment advice.
Any opinions, news, research, analyses, prices, other information, or links to third-party sites contained on this website are provided on an "as-is" basis, are intended only to be informative, is not an advice nor a recommendation, nor research, or a record of our trading prices, or an offer of, or solicitation for a transaction in any financial instrument and thus should not be treated as such. The information provided does not involve any specific investment objectives, financial situation and needs of any specific person who may receive it. Please be aware, that past performance is not a reliable indicator of future performance and/or results. Past Performance or Forward-looking scenarios based upon the reasonable beliefs of the third-party provider are not a guarantee of future performance. Actual results may differ materially from those anticipated in forward-looking or past performance statements. IC Markets makes no representation or warranty and assumes no liability as to the accuracy or completeness of the information provided, nor any loss arising from any investment based on a recommendation, forecast or any information supplied by any third-party.

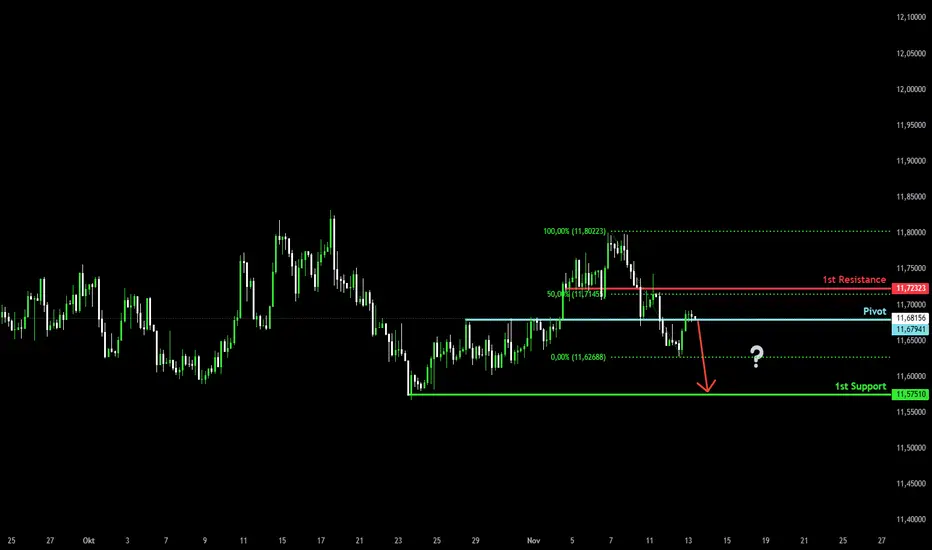
Bearish reversal setup?EUR/NOK is reacting off the pivot, which is acting as a pullback resistance, and could drop to the first support level, which serves as a swing low support.
Pivot: 11.67941
1st Support: 11.57510
1st Resistance: 11.72323
Disclaimer:
The above opinions given constitute general market commentary, and do not constitute the opinion or advice of IC Markets or any form of personal or investment advice.
Any opinions, news, research, analyses, prices, other information, or links to third-party sites contained on this website are provided on an "as-is" basis, are intended only to be informative, is not an advice nor a recommendation, nor research, or a record of our trading prices, or an offer of, or solicitation for a transaction in any financial instrument and thus should not be treated as such. The information provided does not involve any specific investment objectives, financial situation and needs of any specific person who may receive it. Please be aware, that past performance is not a reliable indicator of future performance and/or results. Past Performance or Forward-looking scenarios based upon the reasonable beliefs of the third-party provider are not a guarantee of future performance. Actual results may differ materially from those anticipated in forward-looking or past performance statements. IC Markets makes no representation or warranty and assumes no liability as to the accuracy or completeness of the information provided, nor any loss arising from any investment based on a recommendation, forecast or any information supplied by any third-party.
Bearish reversal off Fib levels?EUR/USD is rising toward the resistance level, which serves as a pullback resistance aligning with the 61.8% Fibonacci retracement and the 161.8% Fibonacci extension. The pair could potentially reverse from this level toward our take-profit target.
Entry: 1.1629
Why we like it:
A pullback resistance aligns with the 61.8% Fibonacci retracement and the 161.8% Fibonacci extension, indicating a potential reversal zone.
Stop Loss: 1.1668
Why we like it:
A swing-high resistance level aligns with the 78.6% Fibonacci projection, providing a strong technical barrier.
Take Profit: 1.1567
Why we like it:
A pullback support level provides a potential reaction area for price reversal.
Enjoying your TradingView experience? Review us!
Please be advised that the information presented on TradingView is provided to Vantage (‘Vantage Global Limited’, ‘we’) by a third-party provider (‘Everest Fortune Group’). Please be reminded that you are solely responsible for the trading decisions on your account. There is a very high degree of risk involved in trading. Any information and/or content is intended entirely for research, educational and informational purposes only and does not constitute investment or consultation advice or investment strategy. The information is not tailored to the investment needs of any specific person and therefore does not involve a consideration of any of the investment objectives, financial situation or needs of any viewer that may receive it. Kindly also note that past performance is not a reliable indicator of future results. Actual results may differ materially from those anticipated in forward-looking or past performance statements. We assume no liability as to the accuracy or completeness of any of the information and/or content provided herein and the Company cannot be held responsible for any omission, mistake nor for any loss or damage including without limitation to any loss of profit which may arise from reliance on any information supplied by Everest Fortune Group.

EURAUD to find buyers at current market price?EURAUD - 24h expiry
Indecisive price action has resulted in sideways congestion on the intraday chart.
Pivot support is at 1.7600.
Risk/Reward would be poor to call a buy from current levels.
A move through 1.7750 will confirm the bullish momentum.
The measured move target is 1.7875.
We look to Buy at 1.7700 (stop at 1.7625)
Our profit targets will be 1.7850 and 1.7875
Resistance: 1.7750 / 1.7800 / 1.7850
Support: 1.7725 / 1.7700 / 1.7650
Risk Disclaimer
The trade ideas beyond this page are for informational purposes only and do not constitute investment advice or a solicitation to trade. This information is provided by Signal Centre, a third-party unaffiliated with OANDA, and is intended for general circulation only. OANDA does not guarantee the accuracy of this information and assumes no responsibilities for the information provided by the third party. The information does not take into account the specific investment objectives, financial situation, or particular needs of any particular person. You should take into account your specific investment objectives, financial situation, and particular needs before making a commitment to trade, including seeking, under a separate engagement, as you deem fit.
You accept that you assume all risks in independently viewing the contents and selecting a chosen strategy.
Where the research is distributed in Singapore to a person who is not an Accredited Investor, Expert Investor or an Institutional Investor, Oanda Asia Pacific Pte Ltd (“OAP“) accepts legal responsibility for the contents of the report to such persons only to the extent required by law. Singapore customers should contact OAP at 6579 8289 for matters arising from, or in connection with, the information/research distributed.

Bullish momentum to extend?EUR/JPY could fall to the pivot, which acts as pullback support, and may bounce to the 1st resistance.
Pivot: 178.54
1st Support: 177.79
1st Resistance: 179.75
Disclaimer:
The opinions given above constitute general market commentary and do not constitute the opinion or advice of IC Markets or any form of personal or investment advice.
Any opinions, news, research, analyses, prices, other information, or links to third-party sites contained on this website are provided on an "as-is" basis, are intended to be informative only, and are not advice, a recommendation, research, a record of our trading prices, an offer of, or solicitation for, a transaction in any financial instrument and thus should not be treated as such. The information provided does not involve any specific investment objectives, financial situation, or needs of any specific person who may receive it. Please be aware that past performance is not a reliable indicator of future performance and/or results. Past performance or forward-looking scenarios based upon the reasonable beliefs of the third-party provider are not a guarantee of future performance. Actual results may differ materially from those anticipated in forward-looking or past performance statements. IC Markets makes no representation or warranty and assumes no liability as to the accuracy or completeness of the information provided, nor any loss arising from any investment based on a recommendation, forecast, or any information supplied by any third party.

Bearish drop off?EUR/CAD has rejected at the pivot and could drop to the 1st support, which acts as swing low support.
Pivot: 1.6249
1st Support: 1.61407
1st Resistance: 1.63091
Disclaimer:
The opinions given above constitute general market commentary and do not constitute the opinion or advice of IC Markets or any form of personal or investment advice.
Any opinions, news, research, analyses, prices, other information, or links to third-party sites contained on this website are provided on an "as-is" basis, are intended to be informative only, and are not advice, a recommendation, research, a record of our trading prices, an offer of, or solicitation for, a transaction in any financial instrument and thus should not be treated as such. The information provided does not involve any specific investment objectives, financial situation, or needs of any specific person who may receive it. Please be aware that past performance is not a reliable indicator of future performance and/or results. Past performance or forward-looking scenarios based upon the reasonable beliefs of the third-party provider are not a guarantee of future performance. Actual results may differ materially from those anticipated in forward-looking or past performance statements. IC Markets makes no representation or warranty and assumes no liability as to the accuracy or completeness of the information provided, nor any loss arising from any investment based on a recommendation, forecast, or any information supplied by any third party.

Bullish continuation?EUR/NZD is reacting off the pivot, which serves as a pullback support, and could bounce toward the 1st resistance, which acts as swing high resistance.
Pivot: 2.04533
1st Support: 2.03272
1st Resistance: 2.05426
Disclaimer:
The opinions given above constitute general market commentary and do not constitute the opinion or advice of IC Markets or any form of personal or investment advice.
Any opinions, news, research, analyses, prices, other information, or links to third-party sites contained on this website are provided on an "as-is" basis, are intended to be informative only, and are not advice, a recommendation, research, a record of our trading prices, an offer of, or solicitation for, a transaction in any financial instrument and thus should not be treated as such. The information provided does not involve any specific investment objectives, financial situation, or needs of any specific person who may receive it. Please be aware that past performance is not a reliable indicator of future performance and/or results. Past performance or forward-looking scenarios based upon the reasonable beliefs of the third-party provider are not a guarantee of future performance. Actual results may differ materially from those anticipated in forward-looking or past performance statements. IC Markets makes no representation or warranty and assumes no liability as to the accuracy or completeness of the information provided, nor any loss arising from any investment based on a recommendation, forecast, or any information supplied by any third party.
Bearish drop off?EUR/NOK has reacted off the pivot and could drop to the 1st support, which acts as a swing low support.
Pivot: 1.67941
1st Support: 1.57510
1st Resistance: 11.72323
Disclaimer:
The opinions given above constitute general market commentary and do not constitute the opinion or advice of IC Markets or any form of personal or investment advice.
Any opinions, news, research, analyses, prices, other information, or links to third-party sites contained on this website are provided on an "as-is" basis, are intended to be informative only, and are not advice, a recommendation, research, a record of our trading prices, an offer of, or solicitation for, a transaction in any financial instrument and thus should not be treated as such. The information provided does not involve any specific investment objectives, financial situation, or needs of any specific person who may receive it. Please be aware that past performance is not a reliable indicator of future performance and/or results. Past performance or forward-looking scenarios based upon the reasonable beliefs of the third-party provider are not a guarantee of future performance. Actual results may differ materially from those anticipated in forward-looking or past performance statements. IC Markets makes no representation or warranty and assumes no liability as to the accuracy or completeness of the information provided, nor any loss arising from any investment based on a recommendation, forecast, or any information supplied by any third party.

EURUSD could target 1.0300 if this level breaks.The EURUSD pair has been trading within an 11-year Channel Down and has found itself on a 2-month pull-back currently ever since the September 17 2025 market High.
Technically that was a Lower High for this long-term pattern and was formed while the 1W RSI has been on Lower Highs, against the price's Higher Highs, which is a huge Bearish Divergence.
This is the same kind of divergence that was present during the Channel's last two Lower Highs in January 2021 and February 2018. Both tops initiated Bearish Legs that got confirmed when the price broke below its 1W MA50 (blue trend-line).
On both occasions, the price hit at least the 0.618 Fibonacci retracement level of the Channel Down, declining by at least -15.25%.
As a result, if the 1W MA50 breaks again, being the market's last Support, we expect EURUSD to target at least 1.0300.
---
** Please LIKE 👍, FOLLOW ✅, SHARE 🙌 and COMMENT ✍ if you enjoy this idea! Also share your ideas and charts in the comments section below! This is best way to keep it relevant, support us, keep the content here free and allow the idea to reach as many people as possible. **
---
💸💸💸💸💸💸
👇 👇 👇 👇 👇 👇

Bearish reversal off key resistance?EUR/GBP is rising towards the resistance level, which is a pullback resistance slightly above the 38.2% Fibonacci retracement, and could potentially reverse from this level to our take-profit.
Entry: 0.878
Why we like it:
There is a pullback resistance that is slightly above the 38.2% Fibonacci retracement.
Stop loss: 0.8795
Why we like it:
There is a pullback resistance that aligns with the 61.8% Fibonacci retracement.
Take profit: 0.8764
Why we like it:
There is a pullback support level.
Enjoying your TradingView experience? Review us!
Please be advised that the information presented on TradingView is provided to Vantage (‘Vantage Global Limited’, ‘we’) by a third-party provider (‘Everest Fortune Group’). Please be reminded that you are solely responsible for the trading decisions on your account. There is a very high degree of risk involved in trading. Any information and/or content is intended entirely for research, educational and informational purposes only and does not constitute investment or consultation advice or investment strategy. The information is not tailored to the investment needs of any specific person and therefore does not involve a consideration of any of the investment objectives, financial situation or needs of any viewer that may receive it. Kindly also note that past performance is not a reliable indicator of future results. Actual results may differ materially from those anticipated in forward-looking or past performance statements. We assume no liability as to the accuracy or completeness of any of the information and/or content provided herein and the Company cannot be held responsible for any omission, mistake nor for any loss or damage including without limitation to any loss of profit which may arise from reliance on any information supplied by Everest Fortune Group.Please be advised that the information presented on TradingView is provided to Vantage (‘Vantage Global Limited’, ‘we’) by a third-party provider (‘Everest Fortune Group’). Please be reminded that you are solely responsible for the trading decisions on your account. There is a very high degree of risk involved in trading. Any information and/or content is intended entirely for research, educational and informational purposes only and does not constitute investment or consultation advice or investment strategy. The information is not tailored to the investment needs of any specific person and therefore does not involve a consideration of any of the investment objectives, financial situation or needs of any viewer that may receive it. Kindly also note that past performance is not a reliable indicator of future results. Actual results may differ materially from those anticipated in forward-looking or past performance statements. We assume no liability as to the accuracy or completeness of any of the information and/or content provided herein and the Company cannot be held responsible for any omission, mistake nor for any loss or damage including without limitation to any loss of profit which may arise from reliance on any information supplied by Everest Fortune Group.
