EURUSD H4 | Bearish Drop OffEUR/USD is rising towards the sell entry which is a pullback resistance and could reverse from this level to the downside.
Sell entry is at 1.1612, whichis a pullback resistance.
Stop loss is at 1.1664, whichis a pullback resistance that aligns with the 50% Fibonacci retracement.
Take profit is at 1.1530, which is a pullback support.
High Risk Investment Warning
Trading Forex/CFDs on margin carries a high level of risk and may not be suitable for all investors. Leverage can work against you.
Stratos Markets Limited (tradu.com ):
CFDs are complex instruments and come with a high risk of losing money rapidly due to leverage. 65% of retail investor accounts lose money when trading CFDs with this provider. You should consider whether you understand how CFDs work and whether you can afford to take the high risk of losing your money.
Stratos Europe Ltd (tradu.com ):
CFDs are complex instruments and come with a high risk of losing money rapidly due to leverage. 66% of retail investor accounts lose money when trading CFDs with this provider. You should consider whether you understand how CFDs work and whether you can afford to take the high risk of losing your money.
Stratos Global LLC (tradu.com ):
Losses can exceed deposits.
Please be advised that the information presented on TradingView is provided to Tradu (‘Company’, ‘we’) by a third-party provider (‘TFA Global Pte Ltd’). Please be reminded that you are solely responsible for the trading decisions on your account. There is a very high degree of risk involved in trading. Any information and/or content is intended entirely for research, educational and informational purposes only and does not constitute investment or consultation advice or investment strategy. The information is not tailored to the investment needs of any specific person and therefore does not involve a consideration of any of the investment objectives, financial situation or needs of any viewer that may receive it. Kindly also note that past performance is not a reliable indicator of future results. Actual results may differ materially from those anticipated in forward-looking or past performance statements. We assume no liability as to the accuracy or completeness of any of the information and/or content provided herein and the Company cannot be held responsible for any omission, mistake nor for any loss or damage including without limitation to any loss of profit which may arise from reliance on any information supplied by TFA Global Pte Ltd.
The speaker(s) is neither an employee, agent nor representative of Tradu and is therefore acting independently. The opinions given are their own, constitute general market commentary, and do not constitute the opinion or advice of Tradu or any form of personal or investment advice. Tradu neither endorses nor guarantees offerings of third-party speakers, nor is Tradu responsible for the content, veracity or opinions of third-party speakers, presenters or participants.
EUR

EURAUD to find buyers at previous swing low?EURAUD - 24h expiry
Pivot support is at 1.7600. We expect a reversal in this move.
Risk/Reward would be poor to call a buy from current levels.
A move through 1.7675 will confirm the bullish momentum.
The measured move target is 1.7775.
We look to Buy at 1.7600 (stop at 1.7525)
Our profit targets will be 1.7750 and 1.7775
Resistance: 1.7675 / 1.7700 / 1.7750
Support: 1.7600 / 1.7550 / 1.7525
Risk Disclaimer
The trade ideas beyond this page are for informational purposes only and do not constitute investment advice or a solicitation to trade. This information is provided by Signal Centre, a third-party unaffiliated with OANDA, and is intended for general circulation only. OANDA does not guarantee the accuracy of this information and assumes no responsibilities for the information provided by the third party. The information does not take into account the specific investment objectives, financial situation, or particular needs of any particular person. You should take into account your specific investment objectives, financial situation, and particular needs before making a commitment to trade, including seeking, under a separate engagement, as you deem fit.
You accept that you assume all risks in independently viewing the contents and selecting a chosen strategy.
Where the research is distributed in Singapore to a person who is not an Accredited Investor, Expert Investor or an Institutional Investor, Oanda Asia Pacific Pte Ltd (“OAP“) accepts legal responsibility for the contents of the report to such persons only to the extent required by law. Singapore customers should contact OAP at 6579 8289 for matters arising from, or in connection with, the information/research distributed.

Bearish reversal off pullback resistance?EUR/CAD is rising towards the resistance level, which is a pullback resistance that aligns with the 38.2% Fibonacci retracement and could reverse from this level to our take profit.
Entry: 1.62549
Why we like it:
There is a pullback resistance level that lines up with the 38.2% Fibonacci retracement.
Stop loss: 1.6398
Why we like it:
There is a swing high resistance level.
Take profit: 1.60909
Why we like it:
There is a pullback support level that is slightly below the 127.2% Fibonacci extension.
Enjoying your TradingView experience? Review us!
Please be advised that the information presented on TradingView is provided to Vantage (‘Vantage Global Limited’, ‘we’) by a third-party provider (‘Everest Fortune Group’). Please be reminded that you are solely responsible for the trading decisions on your account. There is a very high degree of risk involved in trading. Any information and/or content is intended entirely for research, educational and informational purposes only and does not constitute investment or consultation advice or investment strategy. The information is not tailored to the investment needs of any specific person and therefore does not involve a consideration of any of the investment objectives, financial situation or needs of any viewer that may receive it. Kindly also note that past performance is not a reliable indicator of future results. Actual results may differ materially from those anticipated in forward-looking or past performance statements. We assume no liability as to the accuracy or completeness of any of the information and/or content provided herein and the Company cannot be held responsible for any omission, mistake nor for any loss or damage including without limitation to any loss of profit which may arise from reliance on any information supplied by Everest Fortune Group.

EURCAD – Waiting for the Perfect ConfluenceEURCAD remains overall bullish while trading inside a rising channel.
At the moment, price is approaching the intersection of the channel’s lower trendline and the horizontal structure zone.
That’s where I’ll be watching closely for trend-following long setups, ideally a rejection or reversal confirmation around that confluence area.
As long as this structure holds, the bulls remain in control, and we could see a continuation toward the upper bound of the channel.
⚠️ Disclaimer: This is not financial advice. Always do your own research and manage risk properly.
📚 Stick to your trading plan regarding entries, risk, and management.
Good luck! 🍀
All Strategies Are Good; If Managed Properly!
~Richard Nasr

Bearish Reversal in PlayThe Fiber (EUR/USD is reacting off the pivot, which is a pullback resistance and could drop to the 1st support, which is a pullback support.
Pivot: 1.1639
1st Support: 1.2533
1st Resistance: 1.1691
Disclaimer:
The above opinions given constitute general market commentary, and do not constitute the opinion or advice of IC Markets or any form of personal or investment advice.
Any opinions, news, research, analyses, prices, other information, or links to third-party sites contained on this website are provided on an "as-is" basis, are intended only to be informative, is not an advice nor a recommendation, nor research, or a record of our trading prices, or an offer of, or solicitation for a transaction in any financial instrument and thus should not be treated as such. The information provided does not involve any specific investment objectives, financial situation and needs of any specific person who may receive it. Please be aware, that past performance is not a reliable indicator of future performance and/or results. Past Performance or Forward-looking scenarios based upon the reasonable beliefs of the third-party provider are not a guarantee of future performance. Actual results may differ materially from those anticipated in forward-looking or past performance statements. IC Markets makes no representation or warranty and assumes no liability as to the accuracy or completeness of the information provided, nor any loss arising from any investment based on a recommendation, forecast or any information supplied by any third-party.

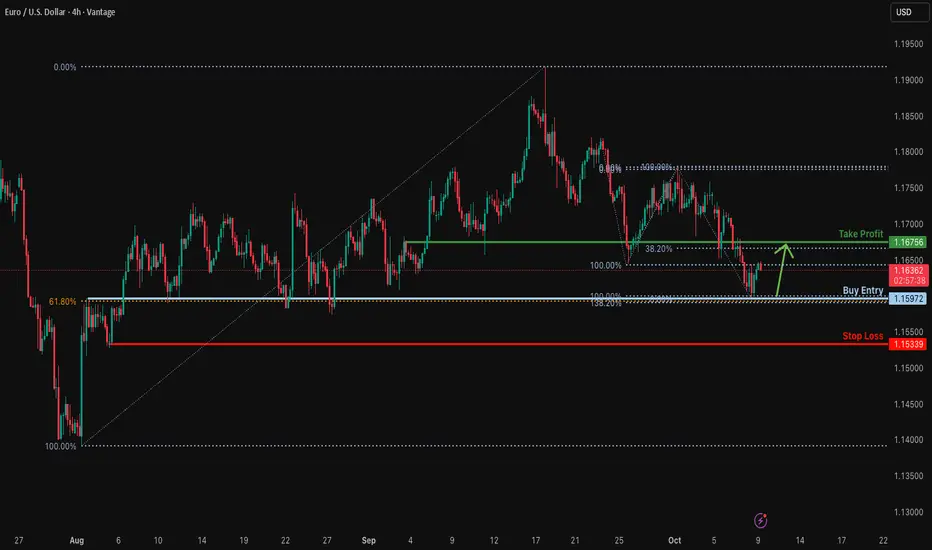
Bullish bounce off Fibonacci confluence?EUR/USD has rebounded from a support level, which is an overlap support aligning with the 100% Fibonacci projection, 132.2% Fibonacci extension, and the 61.8% Fibonacci retracement. The pair could potentially rise from this level toward the take-profit target.
Entry: 1.1597
Why we like it:
which is an overlap support aligning with the 100% Fibonacci projection, 132.2% Fibonacci extension, and the 61.8% Fibonacci retracement.
Stop loss: 1.1533
Why we like it: which is a pullback support.
Take profit: 1.1675
Why we like it:
There is an overlap resistance that aligns with the 38.2% Fibonacci retracement.
Enjoying your TradingView experience? Review us!
Please be advised that the information presented on TradingView is provided to Vantage (‘Vantage Global Limited’, ‘we’) by a third-party provider (‘Everest Fortune Group’). Please be reminded that you are solely responsible for the trading decisions on your account. There is a very high degree of risk involved in trading. Any information and/or content is intended entirely for research, educational and informational purposes only and does not constitute investment or consultation advice or investment strategy. The information is not tailored to the investment needs of any specific person and therefore does not involve a consideration of any of the investment objectives, financial situation or needs of any viewer that may receive it. Kindly also note that past performance is not a reliable indicator of future results. Actual results may differ materially from those anticipated in forward-looking or past performance statements. We assume no liability as to the accuracy or completeness of any of the information and/or content provided herein and the Company cannot be held responsible for any omission, mistake nor for any loss or damage including without limitation to any loss of profit which may arise from reliance on any information supplied by Everest Fortune Group.
Going Long on the Euro-USDFX:EURUSD
Nice hammer candle today. The trend is up; the trend is your friend. And it seems like it can continue climbing all year to finish its 5th wave impulse, which looks like it is going to be an ending diagonal triangle.
Fed will continue to lower interest rates, which would support the rise of the Euro against the US Dollar.
Going long here with target at $1.22 USD. Stop $1.16 USD. It may take several weeks to reach the target.
Good luck to you.

EURUSD: Buying Interest Builds at 1.1610 as Shutdown DragsHey Traders, in today’s trading session we are monitoring EURUSD for a potential buying opportunity around the 1.16100 zone. The pair remains in a broader uptrend and is currently in a correction phase, approaching a strong daily support area at 1.16100 that aligns with the ascending trendline.
Structure: The market has been maintaining higher highs and higher lows, with the current retracement offering a potential continuation setup within the bullish structure.
Key level in focus: 1.16100 — a critical zone of confluence between daily support and trend structure, where buyers have previously shown strong interest.
Fundamentals: The US Dollar Index (DXY) is nearing the 98.800 daily resistance while facing headwinds from the ongoing US government shutdown. Extended fiscal uncertainty and a weakening DXY backdrop strengthen the bullish case for EURUSD.
Next move: Watching price reaction at 1.16100 for potential bullish continuation — sustained buying pressure here could pave the way for a move toward recent highs.
Trade safe,
Joe.
Potential bearish drop?EUR/GBP has rejected off the pivot and could drop to the 1st support.
Pivot: 0.8695
1st Support: 0.8637
1st Resistance: 0.8719
Disclaimer:
The above opinions given constitute general market commentary, and do not constitute the opinion or advice of IC Markets or any form of personal or investment advice.
Any opinions, news, research, analyses, prices, other information, or links to third-party sites contained on this website are provided on an "as-is" basis, are intended only to be informative, is not an advice nor a recommendation, nor research, or a record of our trading prices, or an offer of, or solicitation for a transaction in any financial instrument and thus should not be treated as such. The information provided does not involve any specific investment objectives, financial situation and needs of any specific person who may receive it. Please be aware, that past performance is not a reliable indicator of future performance and/or results. Past Performance or Forward-looking scenarios based upon the reasonable beliefs of the third-party provider are not a guarantee of future performance. Actual results may differ materially from those anticipated in forward-looking or past performance statements. IC Markets makes no representation or warranty and assumes no liability as to the accuracy or completeness of the information provided, nor any loss arising from any investment based on a recommendation, forecast or any information supplied by any third-party.

Bearish continuation?EUR/AUD is rising towards the pivot and could reverse to the 1st support, which is a swing low support.
Pivot: 1.77882
1st Support: 1.75970
1st Resistance: 1.79133
Disclaimer:
The above opinions given constitute general market commentary, and do not constitute the opinion or advice of IC Markets or any form of personal or investment advice.
Any opinions, news, research, analyses, prices, other information, or links to third-party sites contained on this website are provided on an "as-is" basis, are intended only to be informative, is not an advice nor a recommendation, nor research, or a record of our trading prices, or an offer of, or solicitation for a transaction in any financial instrument and thus should not be treated as such. The information provided does not involve any specific investment objectives, financial situation and needs of any specific person who may receive it. Please be aware, that past performance is not a reliable indicator of future performance and/or results. Past Performance or Forward-looking scenarios based upon the reasonable beliefs of the third-party provider are not a guarantee of future performance. Actual results may differ materially from those anticipated in forward-looking or past performance statements. IC Markets makes no representation or warranty and assumes no liability as to the accuracy or completeness of the information provided, nor any loss arising from any investment based on a recommendation, forecast or any information supplied by any third-party.

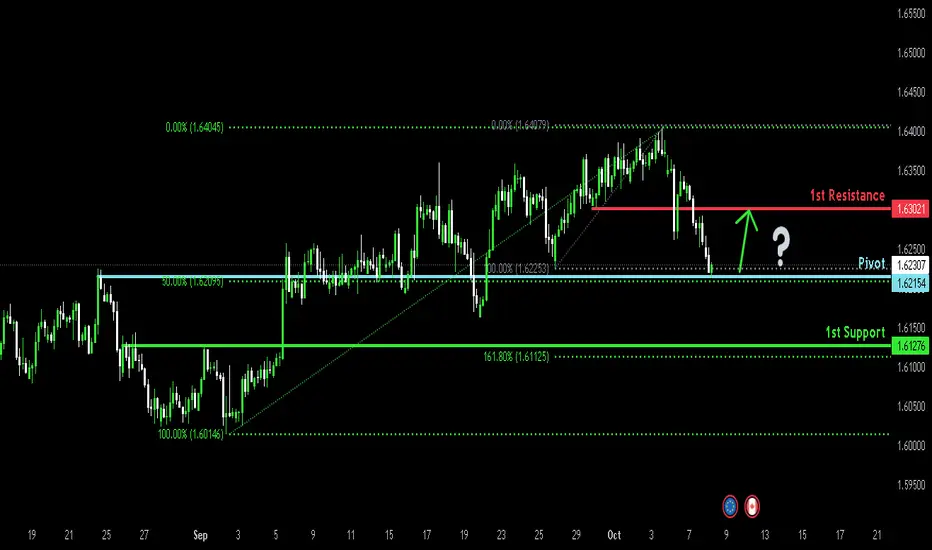
Bullish reversal?EUR/CAD is reacting off the pivot, which has been identified as an overlap support that aligns with the 50% Fibonacci retracement and could bounce to the 1st resistance.
Pivot: 1.62154
1st Support: 1.61276
1st Resistance: 1.63021
Disclaimer:
The above opinions given constitute general market commentary, and do not constitute the opinion or advice of IC Markets or any form of personal or investment advice.
Any opinions, news, research, analyses, prices, other information, or links to third-party sites contained on this website are provided on an "as-is" basis, are intended only to be informative, is not an advice nor a recommendation, nor research, or a record of our trading prices, or an offer of, or solicitation for a transaction in any financial instrument and thus should not be treated as such. The information provided does not involve any specific investment objectives, financial situation and needs of any specific person who may receive it. Please be aware, that past performance is not a reliable indicator of future performance and/or results. Past Performance or Forward-looking scenarios based upon the reasonable beliefs of the third-party provider are not a guarantee of future performance. Actual results may differ materially from those anticipated in forward-looking or past performance statements. IC Markets makes no representation or warranty and assumes no liability as to the accuracy or completeness of the information provided, nor any loss arising from any investment based on a recommendation, forecast or any information supplied by any third-party.
Eurgbp looks bearish recently breaks horizontal support area, and on verge of trend line breakout, this breakout can lead 100 pips bearish rally.
note always keep in mind wait for breakout

eurcad getting ready for 250 pips bearish wave got rejected from long ascending channel range, formed rising wedge in lower time frame, expecting 250 bearish rally once wedge broke towards downside, keep in mind breakout is crucial, don,t enter without breakout

GBPUSD H4 | Bearish Drop OffGBP/USD has reacted off the sell entry, which is a pullback resistance, and could drop from this level to the take profit.
Sell entry is at 1.3432, which is a pullback resistance.
Stop loss is at 1.3526, which is a pullback resistance that aligns with the 50% Fibonacci retracement.
Take profit is at 1.3337, which is a multi swing low support.
High Risk Investment Warning
Trading Forex/CFDs on margin carries a high level of risk and may not be suitable for all investors. Leverage can work against you.
Stratos Markets Limited (tradu.com ):
CFDs are complex instruments and come with a high risk of losing money rapidly due to leverage. 65% of retail investor accounts lose money when trading CFDs with this provider. You should consider whether you understand how CFDs work and whether you can afford to take the high risk of losing your money.
Stratos Europe Ltd (tradu.com ):
CFDs are complex instruments and come with a high risk of losing money rapidly due to leverage. 66% of retail investor accounts lose money when trading CFDs with this provider. You should consider whether you understand how CFDs work and whether you can afford to take the high risk of losing your money.
Stratos Global LLC (tradu.com ):
Losses can exceed deposits.
Please be advised that the information presented on TradingView is provided to Tradu (‘Company’, ‘we’) by a third-party provider (‘TFA Global Pte Ltd’). Please be reminded that you are solely responsible for the trading decisions on your account. There is a very high degree of risk involved in trading. Any information and/or content is intended entirely for research, educational and informational purposes only and does not constitute investment or consultation advice or investment strategy. The information is not tailored to the investment needs of any specific person and therefore does not involve a consideration of any of the investment objectives, financial situation or needs of any viewer that may receive it. Kindly also note that past performance is not a reliable indicator of future results. Actual results may differ materially from those anticipated in forward-looking or past performance statements. We assume no liability as to the accuracy or completeness of any of the information and/or content provided herein and the Company cannot be held responsible for any omission, mistake nor for any loss or damage including without limitation to any loss of profit which may arise from reliance on any information supplied by TFA Global Pte Ltd.
The speaker(s) is neither an employee, agent nor representative of Tradu and is therefore acting independently. The opinions given are their own, constitute general market commentary, and do not constitute the opinion or advice of Tradu or any form of personal or investment advice. Tradu neither endorses nor guarantees offerings of third-party speakers, nor is Tradu responsible for the content, veracity or opinions of third-party speakers, presenters or participants.

Bullish bounce off?EUR/NZD has bounced off the pivot, which has been identified as an overlap support that aligns with the 38.2% Fibonacci retracement and could rise to the swing high resistance.
Pivot: 2.00180
1st Support: 2.98927
1st Resistance: 2.02961
Disclaimer:
The above opinions given constitute general market commentary, and do not constitute the opinion or advice of IC Markets or any form of personal or investment advice.
Any opinions, news, research, analyses, prices, other information, or links to third-party sites contained on this website are provided on an "as-is" basis, are intended only to be informative, is not an advice nor a recommendation, nor research, or a record of our trading prices, or an offer of, or solicitation for a transaction in any financial instrument and thus should not be treated as such. The information provided does not involve any specific investment objectives, financial situation and needs of any specific person who may receive it. Please be aware, that past performance is not a reliable indicator of future performance and/or results. Past Performance or Forward-looking scenarios based upon the reasonable beliefs of the third-party provider are not a guarantee of future performance. Actual results may differ materially from those anticipated in forward-looking or past performance statements. IC Markets makes no representation or warranty and assumes no liability as to the accuracy or completeness of the information provided, nor any loss arising from any investment based on a recommendation, forecast or any information supplied by any third-party.

Bearish momentum building?EUR/NOK is rising towards the pivot, which aligns with the 50% Fibonacci retracement and could reverse to the 1st support.
Pivot: 11.66459
1st Support: 11.54492
1st Resistance: 11.73724
Disclaimer:
The above opinions given constitute general market commentary, and do not constitute the opinion or advice of IC Markets or any form of personal or investment advice.
Any opinions, news, research, analyses, prices, other information, or links to third-party sites contained on this website are provided on an "as-is" basis, are intended only to be informative, is not an advice nor a recommendation, nor research, or a record of our trading prices, or an offer of, or solicitation for a transaction in any financial instrument and thus should not be treated as such. The information provided does not involve any specific investment objectives, financial situation and needs of any specific person who may receive it. Please be aware, that past performance is not a reliable indicator of future performance and/or results. Past Performance or Forward-looking scenarios based upon the reasonable beliefs of the third-party provider are not a guarantee of future performance. Actual results may differ materially from those anticipated in forward-looking or past performance statements. IC Markets makes no representation or warranty and assumes no liability as to the accuracy or completeness of the information provided, nor any loss arising from any investment based on a recommendation, forecast or any information supplied by any third-party.

EUR/USD - 4H Forecast (Full Breakdown Linked)🔥 EUR/USD – 4H Forecast 🔥
Alright traders, here’s the 4H play for the Fiber 👇
🧠 Bias:
Short-term bearish, baby. Price just printed a Break of Structure (BOS) after a clean shift in momentum from the upside. The bulls are losing steam, and sellers are creeping back into the driver’s seat.
🧩 Technical Breakdown:
Price rejected beautifully from a 4H supply zone around 1.1750–1.1770, confirming bearish intent.
We’ve got a solid BOS and shift, setting the tone for a potential continuation leg down.
A minor pullback into the 4H zone could act as the sniper’s entry area.
Below sits a juicy imbalance and SSL (sell-side liquidity) near 1.1530–1.1560, waiting to get cleared.
🎯 Trade Idea:
Entry Zone: 1.1700–1.1740 (4H supply retest)
Target 1: 1.1580 (mid-range demand)
Target 2: 1.1440 (major liquidity pocket)
Invalidation: Above 1.1780 (if price reclaims the 4H supply, bias flips)
⚙️ Risk Management:
Stick to your plan — 1–2% risk max. Wait for confirmation candles or lower-TF rejection before diving in. No FOMO entries.
💬 Summary :
EUR/USD looks primed for a bearish continuation unless the bulls pull off a miracle reclaim. Eyes on that 4H zone — rejection there could kickstart the next drop.

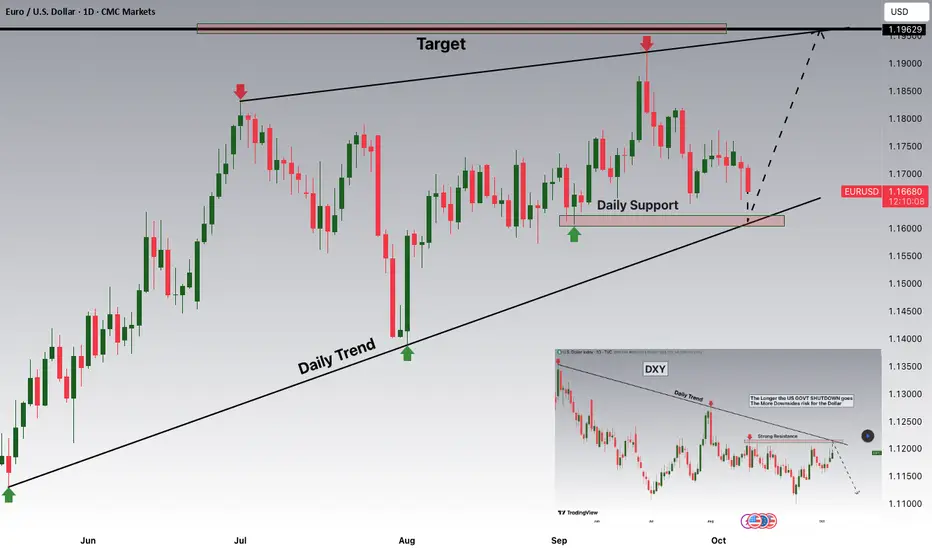
EURUSD Last chance to maintain the long-term bullish trend.The EURUSD pair has been trading within a Channel Up since the April 21 High and today it came to the closest its been to the 1D MA100 (green trend-line). That is the trend-line that formed its last Higher Low on August 01.
As long as it holds, we expect a rebound, targeting at least Resistance 1 at 1.19190. A 1D candle close below it though, would be the first strong sign of a potential long-term bearish reversal on the market, targeting Support 2 and a potential contact with the 1D MA200 (orange trend-line) at 1.13905.
The fact that the price is so close to the 1D MA100 makes it perfect for a tight SL strategy implementation on either case.
-------------------------------------------------------------------------------
** Please LIKE 👍, FOLLOW ✅, SHARE 🙌 and COMMENT ✍ if you enjoy this idea! Also share your ideas and charts in the comments section below! This is best way to keep it relevant, support us, keep the content here free and allow the idea to reach as many people as possible. **
-------------------------------------------------------------------------------
💸💸💸💸💸💸
👇 👇 👇 👇 👇 👇

Potential bearish drop?EUR/GBP has reacted off the resistance level, which is a pullback resistance and could drop from this level to our take profit.
Entry: 0.87114
Why we like it:
There is a pullback resistance level.
Stop loss: 0.8750
Why we like it:
There is a swing high resistance level.
Take profit: 0.8640
Why we like it:
There is a pullback support.
Enjoying your TradingView experience? Review us!
Please be advised that the information presented on TradingView is provided to Vantage (‘Vantage Global Limited’, ‘we’) by a third-party provider (‘Everest Fortune Group’). Please be reminded that you are solely responsible for the trading decisions on your account. There is a very high degree of risk involved in trading. Any information and/or content is intended entirely for research, educational and informational purposes only and does not constitute investment or consultation advice or investment strategy. The information is not tailored to the investment needs of any specific person and therefore does not involve a consideration of any of the investment objectives, financial situation or needs of any viewer that may receive it. Kindly also note that past performance is not a reliable indicator of future results. Actual results may differ materially from those anticipated in forward-looking or past performance statements. We assume no liability as to the accuracy or completeness of any of the information and/or content provided herein and the Company cannot be held responsible for any omission, mistake nor for any loss or damage including without limitation to any loss of profit which may arise from reliance on any information supplied by Everest Fortune Group.

EURUSD M30 | Price Signals a Bearish Drop After RejectionEUR/USD has rejected off the sell entry, which is a pullback resistance that aligns with the 50% Fibonacci retracement and could drop from his level to the downside.
Sell entry is at 1.1732, which is a pullback resistance that aligns with the 50% Fibonacci retracement.
Stop loss is at 1.1757, which is a multi-swing high resistance.
Take profit is at 1.1688, which is a pullback support.
High Risk Investment Warning
Trading Forex/CFDs on margin carries a high level of risk and may not be suitable for all investors. Leverage can work against you.
Stratos Markets Limited (tradu.com ):
CFDs are complex instruments and come with a high risk of losing money rapidly due to leverage. 65% of retail investor accounts lose money when trading CFDs with this provider. You should consider whether you understand how CFDs work and whether you can afford to take the high risk of losing your money.
Stratos Europe Ltd (tradu.com ):
CFDs are complex instruments and come with a high risk of losing money rapidly due to leverage. 66% of retail investor accounts lose money when trading CFDs with this provider. You should consider whether you understand how CFDs work and whether you can afford to take the high risk of losing your money.
Stratos Global LLC (tradu.com):
Losses can exceed deposits.
Please be advised that the information presented on TradingView is provided to Tradu (‘Company’, ‘we’) by a third-party provider (‘TFA Global Pte Ltd’). Please be reminded that you are solely responsible for the trading decisions on your account. There is a very high degree of risk involved in trading. Any information and/or content is intended entirely for research, educational and informational purposes only and does not constitute investment or consultation advice or investment strategy. The information is not tailored to the investment needs of any specific person and therefore does not involve a consideration of any of the investment objectives, financial situation or needs of any viewer that may receive it. Kindly also note that past performance is not a reliable indicator of future results. Actual results may differ materially from those anticipated in forward-looking or past performance statements. We assume no liability as to the accuracy or completeness of any of the information and/or content provided herein and the Company cannot be held responsible for any omission, mistake nor for any loss or damage including without limitation to any loss of profit which may arise from reliance on any information supplied by TFA Global Pte Ltd.
The speaker(s) is neither an employee, agent nor representative of Tradu and is therefore acting independently. The opinions given are their own, constitute general market commentary, and do not constitute the opinion or advice of Tradu or any form of personal or investment advice. Tradu neither endorses nor guarantees offerings of third-party speakers, nor is Tradu responsible for the content, veracity or opinions of third-party speakers, presenters or participants.

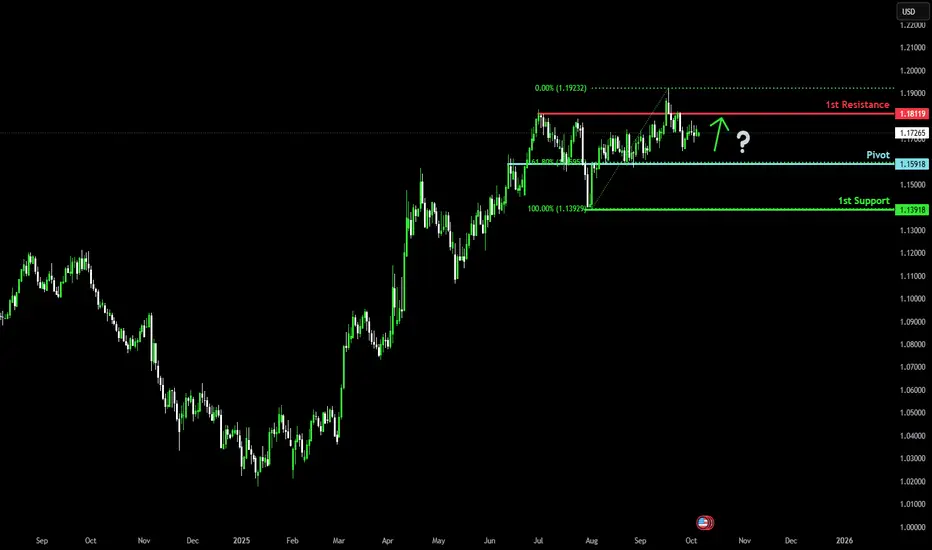
Potential bullish bounce setup?The Fiber (EUR/USD) is falling towards the pivot, which acts as an overlap support and could bounce to the 1st resistance.
Pivot: 1.1591
1st Support: 1.1391
1st Resistance: 1.1811
Disclaimer:
The above opinions given constitute general market commentary, and do not constitute the opinion or advice of IC Markets or any form of personal or investment advice.
Any opinions, news, research, analyses, prices, other information, or links to third-party sites contained on this website are provided on an "as-is" basis, are intended only to be informative, is not an advice nor a recommendation, nor research, or a record of our trading prices, or an offer of, or solicitation for a transaction in any financial instrument and thus should not be treated as such. The information provided does not involve any specific investment objectives, financial situation and needs of any specific person who may receive it. Please be aware, that past performance is not a reliable indicator of future performance and/or results. Past Performance or Forward-looking scenarios based upon the reasonable beliefs of the third-party provider are not a guarantee of future performance. Actual results may differ materially from those anticipated in forward-looking or past performance statements. IC Markets makes no representation or warranty and assumes no liability as to the accuracy or completeness of the information provided, nor any loss arising from any investment based on a recommendation, forecast or any information supplied by any third-party.
Bullish rise?EUR/USD is reacting off the support level which is a pullback support and could bounce from this level to our take profit.
Entry: 1.1709
Why we like it:
There is a pullback support level.
Stop loss: 1.1663
Why we like it:
There is a pullback support level.
Take profit: 1.1816
Why we like it:
There is a swing high resistance.
Enjoying your TradingView experience? Review us!
Please be advised that the information presented on TradingView is provided to Vantage (‘Vantage Global Limited’, ‘we’) by a third-party provider (‘Everest Fortune Group’). Please be reminded that you are solely responsible for the trading decisions on your account. There is a very high degree of risk involved in trading. Any information and/or content is intended entirely for research, educational and informational purposes only and does not constitute investment or consultation advice or investment strategy. The information is not tailored to the investment needs of any specific person and therefore does not involve a consideration of any of the investment objectives, financial situation or needs of any viewer that may receive it. Kindly also note that past performance is not a reliable indicator of future results. Actual results may differ materially from those anticipated in forward-looking or past performance statements. We assume no liability as to the accuracy or completeness of any of the information and/or content provided herein and the Company cannot be held responsible for any omission, mistake nor for any loss or damage including without limitation to any loss of profit which may arise from reliance on any information supplied by Everest Fortune Group.

Bearish reversal off 38.2% Fibonacci resistance?EUR/JPY is reacting off the pivot, which is an overlap resistance that aligns with the 38.2% Fibonacci retracement and could reverse to the 1st support.
Pivot: 173.26
1st Support: 171.97
1st Resistance: 174.11
Disclaimer:
The above opinions given constitute general market commentary, and do not constitute the opinion or advice of IC Markets or any form of personal or investment advice.
Any opinions, news, research, analyses, prices, other information, or links to third-party sites contained on this website are provided on an "as-is" basis, are intended only to be informative, is not an advice nor a recommendation, nor research, or a record of our trading prices, or an offer of, or solicitation for a transaction in any financial instrument and thus should not be treated as such. The information provided does not involve any specific investment objectives, financial situation and needs of any specific person who may receive it. Please be aware, that past performance is not a reliable indicator of future performance and/or results. Past Performance or Forward-looking scenarios based upon the reasonable beliefs of the third-party provider are not a guarantee of future performance. Actual results may differ materially from those anticipated in forward-looking or past performance statements. IC Markets makes no representation or warranty and assumes no liability as to the accuracy or completeness of the information provided, nor any loss arising from any investment based on a recommendation, forecast or any information supplied by any third-party.
