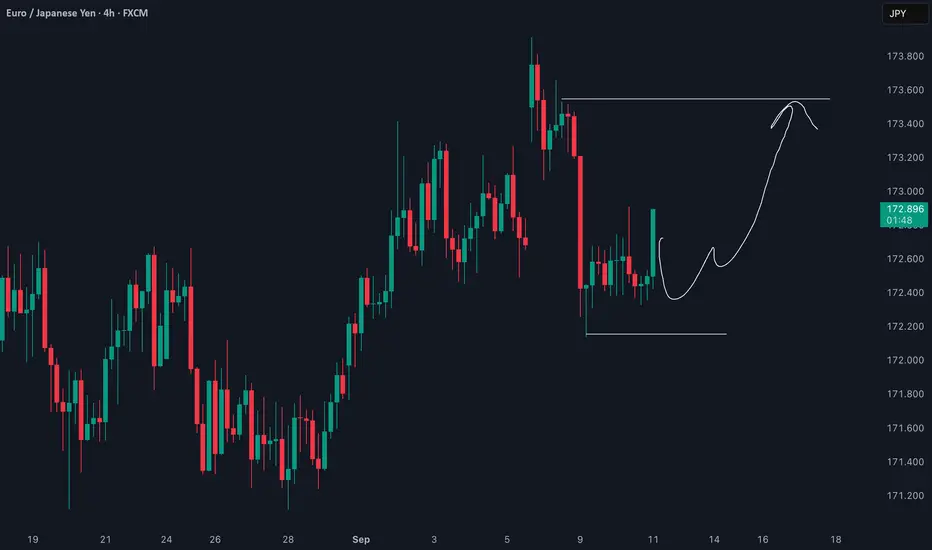
EURJPY - BUY OPPORTUNITYBUYING EJ from BUY AREA to TP AREA
entry criteria:
Executing on signs of reversal, rejections etc
Do not buy on strong bearish break through of buy area!
Trade Safe
Eurjpy!

EURJPY Short, 15 SeptemberHTF Bullish, but 4H OB Reaction + 15m Bearish Shift
Setup aligns as a counter-trend short inside HTF bullish context, with clean intraday bearish structure confirmation.
📈 HTF Context:
✅ Price reacting from 4H OB
✅ Daily structure bullish but forming double top liquidity above
⚠️ Trade is against overall HTF bias → requires tighter risk
📉 LTF Confirmation:
💤 Asia range formed
📉 15m broke last relevant low → clear bearish structure shift
🔑 75% probability we create a new LH from current zone (HTF alignment)
🎯 Entry Plan:
⚡ 1m BOS confirmed inside 15m decisional OB
🔑 Entry refined at 5m OB
🛡️ Risk: 0.5% (conservative since against HTF trend)
🎯 TP: Target liquidity below recent 15m low / Asia low

EURJPY What Next? SELL!
My dear friends,
EURJPY looks like it will make a good move, and here are the details:
The market is trading on 173.30 pivot level.
Bias - Bearish
Technical Indicators: Supper Trend generates a clear short signal while Pivot Point HL is currently determining the overall Bearish trend of the market.
Goal - 172.84
About Used Indicators:
Pivot points are a great way to identify areas of support and resistance, but they work best when combined with other kinds of technical analysis
Disclosure: I am part of Trade Nation's Influencer program and receive a monthly fee for using their TradingView charts in my analysis.
———————————
WISH YOU ALL LUCK

EURJPY LONGEurjoy looking clean for a good chance of buying ,and staying there for a while as there’s some really cool fresh new highs that go along and correlate with our price structure

EURJPY — H1/H4 agree → continuationChronex | EURJPY - Bullish - Conviction - Med | Follow trend; avoid counter-moves
Structure Bullish
Market Phase Expansion
Order Flow Bullish
LQ - ERL (Target)

Bullish Structure Holds for EUR/JPY on the 4-Hour ChartEUR/JPY Technical Analysis
What we're looking at on this 4-hour chart is a classic example of a bullish trend undergoing a healthy correction and potentially preparing for its next move higher. The market is giving us some very clear clues. 🧐
1. Market Structure & Dominant Trend 📈
Overall Trend: The dominant, overarching trend is clearly bullish. Looking at the price action from late August through early September, the market has been consistently printing higher highs and higher lows. This is the primary context, and we generally want to trade in the direction of the main trend.
Corrective Phase: After reaching a peak around $173.80, the price experienced a sharp and aggressive sell-off. This is a typical corrective move or profit-taking phase after a strong impulse leg up.
Consolidation / Accumulation: Price has now stopped falling and is moving sideways, contained within a well-defined range. This is often a sign of accumulation, where buyers are absorbing selling pressure and building positions for a potential move higher.
2. Key Levels to Watch 🎯
Resistance 🛡️: The upper boundary of the current range is at approximately $173.55 - $173.60. This is the immediate ceiling that buyers need to break through to confirm a continuation of the uptrend. It's the "line in the sand" for the bears.
Support: The lower boundary is clearly defined around $172.15 - $172.20. This level has been tested and has held firm, showing that buyers are stepping in to defend this price. As long as we stay above this level, the bullish case remains intact.
Potential Double Bottom / Inverse Head & Shoulders: The price action within the consolidation range is carving out what looks like a Double Bottom or a potential Inverse Head and Shoulders pattern.
Bullish Intention: These are classic bullish reversal/continuation patterns. They signal that the downward momentum of the correction has been exhausted and that buyers are regaining control. The recent strong green candles moving away from the support zone reinforce this buying pressure.
4. Potential Scenarios 🚀 vs. 📉
Bullish Scenario (High Probability): This aligns with your projection. The price continues to respect the support level, completes the right side of the pattern, and breaks through the minor resistance within the range (around $173.00). A confirmed break and close above this level would likely propel the price towards the main resistance at $173.55. A break of that level would signal a full continuation of the bullish trend, with sights on new highs.
Bearish Scenario (Lower Probability): We must always consider the alternative. If buyers fail to push the price higher and we see a strong, decisive 4-hour candle close below the support at $172.15, the bullish setup would be invalidated. This would suggest that the correction is not over and could lead to a deeper move down towards the next major structural support levels.
This is a potential setup that favors the buyers. Patience and risk management are key.
EUR /JPY Near Strongest Res Area , Short Valid To Get 200 Pips !Here is my opinion on 4H EUR/JPY Chart , the price touch a very strong res area that forced the price to respect it and go down for more than 400 pips for 2 times , and Last Week the price touch it and moved 150 pips to downside so now i`m waiting the price to go back to retest the same area again and give me a good bearish price action to can enter a sell trade and we can targeting from 100 : 200 pips . if we have a daily closure above my res area this idea will not be valid anymore .
Entry Reasons :
1- Very Strong Daily Res Area .
2- Perfect Bearish Price Action .
3- Bigger Time Frames Confirmed .

DeGRAM | EURJPY reached the resistance area📊 Technical Analysis
● EUR/JPY is rejecting the 173.50 resistance area, with repeated failures near the resistance line signaling exhaustion of bullish momentum.
● Price action shows a likely rotation lower, targeting 172.46 support initially, with further risk toward 171.60 if pressure persists.
💡 Fundamental Analysis
● The yen is supported by stronger JGB yields and renewed BoJ commentary on potential normalization, while the euro faces pressure from softer eurozone trade data.
✨ Summary
Bearish below 173.50; targets 172.46 → 171.60. Invalidation on a close above 173.50.
-------------------
Share your opinion in the comments, and support the idea with a like. Thanks for your support!

EURJPY Will Go Up! Long!
Here is our detailed technical review for EURJPY.
Time Frame: 8h
Current Trend: Bullish
Sentiment: Oversold (based on 7-period RSI)
Forecast: Bullish
The market is on a crucial zone of demand 173.084.
The oversold market condition in a combination with key structure gives us a relatively strong bullish signal with goal 173.910 level.
P.S
The term oversold refers to a condition where an asset has traded lower in price and has the potential for a price bounce.
Overbought refers to market scenarios where the instrument is traded considerably higher than its fair value. Overvaluation is caused by market sentiments when there is positive news.
Like and subscribe and comment my ideas if you enjoy them!

EUR/JPY BEST PLACE TO SELL FROM|SHORT
EUR/JPY SIGNAL
Trade Direction: short
Entry Level: 172.979
Target Level: 171.265
Stop Loss: 174.125
RISK PROFILE
Risk level: medium
Suggested risk: 1%
Timeframe: 12h
Disclosure: I am part of Trade Nation's Influencer program and receive a monthly fee for using their TradingView charts in my analysis.
✅LIKE AND COMMENT MY IDEAS✅

EUR-JPY Move Down Ahead! Sell!
Hello,Traders!
EUR-JPY is approaching
A key horizontal
Resistance around 174.000
So after the retest a local
Pullback is to be expected
On Monday as it is a strong level
Sell!
Comment and subscribe to help us grow!
Check out other forecasts below too!
Disclosure: I am part of Trade Nation's Influencer program and receive a monthly fee for using their TradingView charts in my analysis.

EURJPY Is Overbought!
HI,Traders !
#EURJPY is trading in a
Strong uptrend and the pair
Will soon hit a horizontal
Resistance of 173.756
So after the retest a
Local bearish pullback
Is to be expected !
Comment and subscribe to help us grow !

EURJPY Bulls Struggle Near 174, Bears Eye Room to Push LowerEURJPY has been testing the upper resistance near 174.00, but repeated failures to hold above suggest exhaustion. With the euro under pressure from softening European growth data and the yen showing signs of life as BOJ policies evolve, this area looks like a pivot zone. The chart structure points toward potential downside back into the 172.40 and 171.30 supports if sellers step in.
Current Bias
Bearish – Price rejected near 174.00 and is showing signs of topping.
Key Fundamental Drivers
Eurozone: Weakening growth signals (stagnation in Germany and Italy CPI moderation) weigh on the euro.
Japan: Higher JGB yields and BOJ’s quiet policy shift toward tighter conditions give JPY some support.
Global risk sentiment: If equity markets retreat, yen demand could rise as a safe haven.
Macro Context
Interest rate expectations: ECB is unlikely to hike further, with markets leaning toward cuts in 2025; BOJ may gradually tighten through yield control tweaks.
Economic growth: Eurozone is flatlining, while Japan shows modest resilience through services PMI strength.
Geopolitical themes: Energy-driven inflation in Europe and tariff uncertainties continue to cloud EUR outlook.
Primary Risk to the Trend
A sudden rebound in euro sentiment (better PMI data or ECB hawkish signals) could invalidate bearish bias.
Most Critical Upcoming News/Event
Eurozone PMI & inflation updates – key for EUR direction.
BOJ communications and JGB auctions – important for JPY momentum.
Leader/Lagger Dynamics
EURJPY tends to be a lagger, reflecting flows from broader EURUSD and USDJPY moves. However, shifts in Japanese yields can make it temporarily a leader in JPY crosses.
Key Levels
Support Levels: 172.40, 171.30
Resistance Levels: 173.90, 174.30
Stop Loss (SL): 174.30 (above resistance and recent highs)
Take Profit (TP): 171.30 (major support level)
Summary: Bias and Watchpoints
EURJPY bias is bearish with SL at 174.30 and TP at 171.30. The euro is weighed down by stagnant growth and subdued inflation, while the yen is supported by creeping BOJ policy adjustments and higher yields. The main risk is an upside surprise from eurozone data or ECB rhetoric. If sellers hold below 174.00, downside momentum could accelerate toward 171.30.

EURJPY Double-Top Rejection Signals Potential DownsideEURJPY has stalled after testing the 173.80–174.00 resistance zone, with sellers stepping in to defend this multi-week high. The rejection aligns with fading Euro momentum and renewed strength in the yen as safe-haven demand returns. With price action showing a clean rejection candle at resistance, the pair looks vulnerable to a deeper pullback toward key support levels.
Current Bias
Bearish downside favored after rejection at resistance with momentum shifting toward sellers.
Key Fundamental Drivers
Eurozone: Inflation is cooling, and growth remains sluggish, keeping ECB policy dovish in tone.
Japan: Wages and household spending recently turned positive y/y, with BOJ maintaining a cautious stance but under pressure from rising JGB yields.
Risk Sentiment: Ongoing geopolitical tensions (Middle East and Russia sanctions) support yen as a safe-haven.
Macro Context
Interest Rates: ECB leaning dovish with little scope to tighten further; BOJ cautious but rising yields keep pressure for policy adjustment.
Growth Trends: Eurozone faces weak industrial output; Japan showing modest resilience in services.
Commodity Flows: Lower oil prices benefit Japan’s import bill, slightly yen-positive.
Geopolitical Themes: Uncertainty in Israel-Gaza conflict, U.S. tariff battles, and OPEC+ supply risks continue to drive safe-haven demand for JPY.
Primary Risk to the Trend
A sudden ECB hawkish shift or stronger-than-expected Eurozone CPI could flip the bias bullish.
Rapid improvement in global risk appetite would weaken yen demand.
Most Critical Upcoming News/Event
ECB commentary on inflation expectations and growth outlook.
Japan’s wage and CPI data alongside BOJ policy signals.
Leader/Lagger Dynamics
EUR/JPY often acts as a lagger, following EUR/USD direction and broader risk sentiment. Yen moves are highly correlated with USD/JPY and gold, meaning strong flows into havens could amplify downside.
Key Levels
Support Levels: 172.65, 171.36
Resistance Levels: 173.87, 174.38
Stop Loss (SL): 174.38
Take Profit (TP): 172.65 (first), 171.36 (extended)
Summary: Bias and Watchpoints
EURJPY has rejected resistance near 174.00, setting up a bearish bias toward 172.65 and possibly 171.36. A stop above 174.38 protects against upside risk. Fundamentals favor yen strength via safe-haven demand and weaker Eurozone growth momentum. The key watchpoint is whether upcoming ECB commentary reinforces dovish policy; if so, downside pressure should continue. For now, sellers maintain the upper hand as risk-off dynamics align with technical rejection.

DeGRAM | EURJPY rebounded from the boundary of the channel📊 Technical Analysis
● EUR/JPY is trending inside an ascending channel, bouncing from 172.56 support and regaining bullish momentum toward the mid-range.
● Price structure points to continuation higher, with a projected test of 173.90 resistance as long as support holds firm.
💡 Fundamental Analysis
● Euro gains are supported by ECB policymakers reaffirming restrictive stance, while yen remains pressured by widening yield spreads as BoJ stays cautious on policy shifts.
✨ Summary
Bullish above 172.56; targets 173.26 → 173.90. Invalidation on a close below 172.56.
-------------------
Share your opinion in the comments, and support the idea with a like. Thanks for your support!

EURJPY Will Go Higher! Buy!
Please, check our technical outlook for EURJPY.
Time Frame: 2h
Current Trend: Bullish
Sentiment: Oversold (based on 7-period RSI)
Forecast: Bullish
The market is trading around a solid horizontal structure 172.847.
The above observations make me that the market will inevitably achieve 173.348 level.
P.S
The term oversold refers to a condition where an asset has traded lower in price and has the potential for a price bounce.
Overbought refers to market scenarios where the instrument is traded considerably higher than its fair value. Overvaluation is caused by market sentiments when there is positive news.
Disclosure: I am part of Trade Nation's Influencer program and receive a monthly fee for using their TradingView charts in my analysis.
Like and subscribe and comment my ideas if you enjoy them!

EURJPY: Uptrend ContinuationSeveral observations over on the daily and H1 timeframes.
Daily Timeframe:
EMA20 remains above EMA60, which indicates uptrend from a technical standpoint.
Price is also crossing above HTL so that's no longer holding as resistance.
H1 Timeframe:
Price crosses above ATL, pulls back, and holds above breakout level.
The demand zone is subjective but price's pull-back did remain above this zone.

Potential bearish dropEUR/JPY has rejected off the resistance level, which is a pullback resistance that is slightly below the 50% Fibonacci retracement and could drop from this level to our take profit.
Entry: 172.83
Why we like it:
There is a pullback resistance that is slightly below the 50% Fibonacci retracement.
Stop loss: 173.55
Why we like it:
There is a pullback resistance level.
Take profit: 171.99
Why we like it:
There is a pullback support that is slightly above the 127.2% Fibonacci extension.
Enjoying your TradingView experience? Review us!
Please be advised that the information presented on TradingView is provided to Vantage (‘Vantage Global Limited’, ‘we’) by a third-party provider (‘Everest Fortune Group’). Please be reminded that you are solely responsible for the trading decisions on your account. There is a very high degree of risk involved in trading. Any information and/or content is intended entirely for research, educational and informational purposes only and does not constitute investment or consultation advice or investment strategy. The information is not tailored to the investment needs of any specific person and therefore does not involve a consideration of any of the investment objectives, financial situation or needs of any viewer that may receive it. Kindly also note that past performance is not a reliable indicator of future results. Actual results may differ materially from those anticipated in forward-looking or past performance statements. We assume no liability as to the accuracy or completeness of any of the information and/or content provided herein and the Company cannot be held responsible for any omission, mistake nor for any loss or damage including without limitation to any loss of profit which may arise from reliance on any information supplied by Everest Fortune Group.

EURJPY: Test of Critical Demand Zone 🇪🇺🇯🇵
EURJPY is stuck on a major daily horizontal demand zone.
A recent breakout of a resistance line of a falling parallel channel
on an hourly time frame indicates an intraday strength of the buyers.
I will expect a pullback at least to 173.0 level.
❤️Please, support my work with like, thank you!❤️
I am part of Trade Nation's Influencer program and receive a monthly fee for using their TradingView charts in my analysis.

DeGRAM | EURJPY reached the important resistance📊 Technical Analysis
● EUR/JPY rejected the resistance line near 173.20 after a false breakout in August, confirming sellers’ defense of the upper boundary.
● The current bearish takeover signals downside risk toward 172.46 support, with a deeper slide possible toward 171.60 if momentum accelerates.
💡 Fundamental Analysis
● Renewed demand for the yen is supported by rising JGB yields as the BoJ hints at gradual policy normalization, while euro sentiment is capped by softer eurozone PMI data.
✨ Summary
Bearish below 173.20; targets 172.46 → 171.60. Invalidation on a close above 173.50.
-------------------
Share your opinion in the comments, and support the idea with a like. Thanks for your support!

Bearish reversal off pullback resistance?EUR/JPY is rising towards the pivot and could reverse to the 1st support.
Pivot: 173.11
1st Support: 172.00
1st Resistance: 173.89
Disclaimer:
The above opinions given constitute general market commentary, and do not constitute the opinion or advice of IC Markets or any form of personal or investment advice.
Any opinions, news, research, analyses, prices, other information, or links to third-party sites contained on this website are provided on an "as-is" basis, are intended only to be informative, is not an advice nor a recommendation, nor research, or a record of our trading prices, or an offer of, or solicitation for a transaction in any financial instrument and thus should not be treated as such. The information provided does not involve any specific investment objectives, financial situation and needs of any specific person who may receive it. Please be aware, that past performance is not a reliable indicator of future performance and/or results. Past Performance or Forward-looking scenarios based upon the reasonable beliefs of the third-party provider are not a guarantee of future performance. Actual results may differ materially from those anticipated in forward-looking or past performance statements. IC Markets makes no representation or warranty and assumes no liability as to the accuracy or completeness of the information provided, nor any loss arising from any investment based on a recommendation, forecast or any information supplied by any third-party.

Yen Pairs Falter at Technical Junctures Several yen pairs have stalled around resistance levels, despite solid rallies into them. But whether this could indicate the beginning of a deep pullback or eventual bullish breakout likely hinges on whether incoming data points towards a hard or soft landing in the US. Today I look out EUR/JPY, GBP/JPY, CHF/JPY and CAD/JPY crosses, and update analysis on USD/JPY.
Matt Simpson, market Analyst at City Index

Fundamental & Technical Analysis: EUR Weakness vs Strong JPY!Today, I want to review the EURJPY ( OANDA:EURJPY ) short position from a fundamental and technical perspective and see if we can profit from this analysis.
Fundamental Analysis:
1. Economic Weakness in the Eurozone
Recent economic data indicate weakness in the Eurozone economy. For instance, retail sales in the Eurozone increased by only 2.2% in July, falling short of expectations. Additionally, inflation rates in the Eurozone are declining, suggesting weak demand in the economy.
Mitrade
2. European Central Bank's Monetary Policies
The European Central Bank is considering interest rate cuts to support the economy. Such policies could lead to a depreciation of the euro, presenting opportunities for short positions.
3. Economic Strength in Japan
In contrast, Japan's economy is showing signs of improvement. Positive economic data, including increased industrial production and exports, indicate economic growth in Japan. This could lead to a strengthening of the Japanese yen and a decline in the EURJPY pair.
4. Bank of Japan's Monetary Policies
The Bank of Japan continues its accommodative monetary policies, including negative interest rates and extensive asset purchase programs. These measures help mitigate downward pressure on the yen, supporting its strength.
Conclusion
Considering the economic weakness in the Eurozone and the economic strength in Japan, the EURJPY pair is likely to experience a downward trend in the short term. This fundamental analysis supports a short position on EUR/JPY.
----------------------------------------------------------------------
Now, let's examine the EURJPY chart on the 4-hour time frame with technical analysis tools .
EURJPY is currently moving in the Resistance zone(173.420 JPY-172.660 JPY) and near the Monthly Resistance(1) .
From the Elliott wave theory perspective , it seems that EURJPY has managed to complete the microwave C of the main wave y of the Double Three Correction(WXY) .
I expect EURJPY to continue its downward trend in the coming hours and at least decline to the Support lines(First Target) .
Second Target: 171.760 JPY
Third Target: Lower lines of the Ascending Channel
Stop Loss(SL): 173.640 JPY
Please respect each other's ideas and express them politely if you agree or disagree.
Euro/Japanese Yen Analysis (EURJPY), 4-hour Time Frame.
Be sure to follow the updated ideas.
Do not forget to put a Stop loss for your positions (For every position you want to open).
Please follow your strategy and updates; this is just my Idea, and I will gladly see your ideas in this post.
Please do not forget the ✅' like '✅ button 🙏😊 & Share it with your friends; thanks, and Trade safe.
