EURJPY: Bullish Push to 186.40?As the previous analysis worked exactly as predicted, FX:EURJPY is eyeing a bullish continuation on the 4-hour chart , with price rebounding from the upward channel's lower boundary after lower high, converging with a potential entry zone at support that could fuel upside momentum if buyers hold amid recent volatility. This setup indicates a rally opportunity post-pullback, targeting higher resistance levels with near 1:4 risk-reward .🔥
Entry between 184.50–184.76 for a long position (entry from current price with proper risk management is recommended)🎯. Target at 186.40 . Set a stop loss at a daily close below 184.35 , yielding a risk-reward ratio of near 1:4 . Monitor for confirmation via a bullish candle close above entry with increasing volume, capitalizing on the pair's upward bias in the channel.🌟
Fundamentally , EURJPY is trading around 185.1 in early February 2026, with limited high-impact events this week, but key Japanese developments could influence JPY weakness. For the Yen, the Snap General Election on February 7 may lead to Monday's market gap, with outcomes impacting Nikkei and yen sentiment. Monday February 9 at 12:00 AM UTC features Eco Watchers Survey: Current (Jan, previous 48.6) and Outlook (Jan, previous 50.5), where weaker consumer sentiment could pressure JPY. For the Euro, no major releases this week, leaving the pair sensitive to JPY catalysts and broader USD flows. 💡
📝 Trade Setup
🎯 Entry (Long):
184.50 – 184.76
(Entry from current price is valid with proper risk & position sizing.)
🎯 Target:
• 186.40
❌ Stop Loss:
• Daily close below 184.35
⚖️ Risk-to-Reward:
• ~ 1:4
💡 Your take?
Does EURJPY extend toward 186.40 after this pullback, or do you expect more consolidation before the next leg higher? 👇
Eurjpyanalysis

EurYen : Profitable Scalp Trade Eurjoy hit take profit and stayed within the trend , making it very simple to catch a reversal and make a profit , remember to adjust the (SL) into breakeven and close partials to secure some profit

Eurjpy : (Scalp Trade - 185+)Eurjpy broke into a new level of price crossing (185+) but however seemed to meet resistance around the (185.2+ Level)
Therefore we can still follow this up trend and wait for an opportunity to buy back up to the (185.000 - Price)

EURJPY Sell Trading Opportunity SpottedH1 - Strong bearish momentum followed by a pullback
Two Solid Resistance Levels
Trend continuation very likely after pullback.
👉 If you enjoy this analysis, please Like, Follow, and Support the profile! Your engagement motivates us to share more quality setups.

EURJPY - Looking To Sell Pullbacks In The Short TermH1 - Strong bearish move.
No opposite signs.
Currently it looks like a pullback is happening.
Expecting bearish continuation until the two strong resistance zones hold.
If you enjoy this idea, don’t forget to LIKE 👍, FOLLOW ✅, SHARE 🙌, and COMMENT ✍! Drop your thoughts and charts below to keep the discussion going. Your support helps keep this content free and reach more people! 🚀

EURJPY (183.6+ - 184.300)Eurjpy looking to target its highs and reach 183.6+ and then cross (184.000) this is due to it dropping for a very long time now it’s a turn to the upside because of price , we can expect nice bullish momentum to the upside and the expected high for the day is (184.2+)

EURJPY — Textbook Trend Since 2020… Now Reversal Risk Is RisingSince the 2020 local low near 114, EURJPY has been trading in a strong bullish trend. More importantly, from 2022 onward, the pair spent nearly two full years moving inside a clean, textbook ascending channel.
In the summer of 2024, after reaching the upper boundary of that channel, EURJPY corrected aggressively and, in less than a month, dropped into 155.
That level became a major support.
After printing that local low, the pair entered a 1,000-pip range, with a very strong floor around 155 acting as the base of demand.
By late February 2025, EURJPY returned to support again — and from that point, for almost a full year, price resumed the uptrend and eventually printed a new ATH last week at 187.10.
Then Friday hit.
A violent sell-off began, and the pair is now dropping toward the lower boundary of the recent rising channel.
🔎 Why EURJPY Is Now a Short Candidate
As mentioned in my latest JPY Index analysis, I’m expecting the JPY to finally enter a recovery phase — which makes JPY crosses strong candidates for correction.
EURJPY stands out immediately because it’s:
✅ heavily extended
✅ technically stretched
✅ and sitting at potential “end-of-trend” conditions
📌 Key Notes From the Bigger Picture
There are a few important things worth highlighting:
1️⃣ On the higher timeframes, ignoring intraday spikes, EURJPY has respected structure almost perfectly — like something taken from a technical analysis textbook.
2️⃣ I expect this technical behavior to continue going forward.
3️⃣ The first ascending channel had roughly a 1,500-pip width, which is normal for a healthy trend.
4️⃣ The more recent channel is much tighter — almost half the size.
And in my experience, this leads to reversal.
🎯 Outlook & Targets
As long as price remains below the recent ATH, I see the risk shifting toward a broader reversal.
On the bigger picture, the “normal” corrective target becomes:
➡️ 166 zone
At the same time, we must keep in mind the previous key area:
📌 175 zone (old ATH / major reference level)
✅ Conclusion
Even without holding trades all the way to bigger targets, the key here is simple:
👉 a good short entry under ATH can offer excellent risk-to-reward
And even a controlled correction can realistically produce:
✅ 500+ pips
with the right entry and discipline.

EURJPY: Bullish Push to 184.9?FX:EURJPY is eyeing a bullish continuation on the 4-hour chart , with price consolidating near major resistance levels after rebounding from support, converging with cumulative sell liquidation that could fuel upside momentum if buyers break through amid recent volatility. This setup indicates a potential rally opportunity post-pullback, targeting higher levels with risk-reward exceeding 1:2 .🔥
Entry between 182.6–183.0 for a long position (entry at current levels with proper risk and capital management is recommended). Target at 184.9 . Set a stop loss at a daily close below 182.1 , yielding a risk-reward ratio of more than 1:2 . Monitor for confirmation via a bullish candle close above entry with increasing volume, capitalizing on the pair's upward bias near key levels.🌟
Fundamentally , EURJPY is trading around 183 in late December 2025, with thin holiday markets this week due to Christmas (December 25) leading to low volumes and potential volatility. For the Euro, no major high-impact events, though the holiday closure could amplify moves. For the Yen, Tuesday December 23 at 11:50 PM UTC brings BoJ October Meeting Minutes, which may provide insights into recent rate hike decisions and future policy, potentially pressuring JPY if dovish. Overall, holiday dynamics and BoJ signals could favor volatility favoring EUR upside if no surprises. 💡
📝 Trade Setup
🎯 Entry (Long):
182.6 – 183.0
(Entry at or near current levels is valid with strict risk & capital management.)
🎯 Target:
184.9
❌ Stop Loss:
• Daily close below 182.1
⚖️ Risk-to-Reward:
• > 1:2
⚠️ Risk Warning:
This is a high-risk trade due to the high probability of BoJ intervention aimed at strengthening the yen.

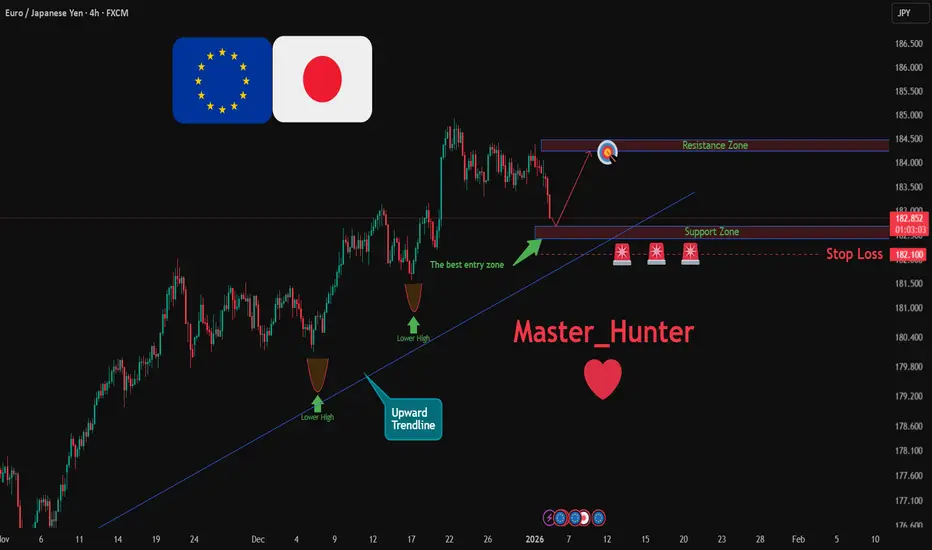
EURJPY: Bullish Push to 184.24?FX:EURJPY is eyeing a bullish continuation on the 4-hour chart , with price bouncing from an upward trendline near lower high, converging with a potential entry zone at support that could fuel upside momentum if buyers hold amid recent consolidation. This setup indicates a rally opportunity post-pullback, targeting higher resistance levels with risk-reward exceeding 1:2.5 .🔥
Entry between 182.43–182.69 for a long position (entry from current price with proper risk management is recommended). Target at 184.24 . Set a stop loss at a daily close below 182.1 , yielding a risk-reward ratio of more than 1:2.5 . Monitor for confirmation via a bullish candle close above entry with increasing volume, capitalizing on the pair's upward bias near key levels.🌟
Fundamentally , EURJPY is trading around 182.9 in early January 2026, with key events this week including Wednesday's Eurozone HICP Flash (Dec) for preliminary inflation data that could strengthen EUR if higher than expected, signaling ECB hawkishness; and Thursday's ECB SCE (Spring Consensus Expectations) for economic projections that may boost EUR on positive outlooks. For JPY, Monday's Japanese PMI Final (Dec) could weaken the yen if revised lower, indicating manufacturing contraction. Overall, stronger Euro data versus soft JPY readings could favor upside in EURJPY amid low holiday volume. 💡
📝 Trade Setup
🎯 Entry (Long):
182.43 – 182.69
(Entry from current price is valid with proper risk & position sizing.)
🎯 Target:
• 184.24
❌ Stop Loss:
• Daily close below 182.10
⚖️ Risk-to-Reward:
• > 1:2.5
💡 Your take?
Does EURJPY extend toward 184.24, or do you expect deeper consolidation before the next push higher? 👇
EUR/JPY Long-Term Update: 251.00 Target Remains On TrackI am providing an update on my EUR/JPY long-term analysis as the currency pair continues to develop according to the technical framework I outlined in my previous post. The pair is currently trading at 186.47, demonstrating strong bullish momentum and confirming the breakout from the multi-year consolidation pattern.
Progress Since the Original Analysis:
In my initial analysis, I identified EUR/JPY as a compelling long-term bullish opportunity from the 124.00 level. The technical setup showed a breakout from a prolonged consolidation phase within a descending wedge pattern that had contained price action for many years. Since then, the market has validated this bullish interpretation through sustained upward movement and the establishment of a clear uptrend structure.
Current Technical Picture:
The monthly chart clearly shows that the bullish structure remains intact and is strengthening. EUR/JPY has successfully broken above the long-term descending resistance trendline, marking a significant shift in the market's technical landscape. This breakout was not a false move but rather the beginning of a substantial trend change, as evidenced by the continued higher highs and higher lows.
The order block zone around 130-140 continues to serve as a critical support foundation. This area represents strong institutional buying interest and has proven its importance during any pullbacks in the price action. The fact that the market respects this zone reinforces the validity of the overall bullish thesis.
The ascending trendlines from recent lows provide dynamic support levels that have guided the upward movement. The price action has consistently respected these trendlines, showing that buyers remain in control of the market structure.
Target Analysis:
My original target of 251.00 remains the primary objective for this extended move. This level represents a major resistance zone from historical price action, specifically the horizontal line drawn across previous highs from decades ago. Based on the current momentum and technical structure, this target appears increasingly realistic as the pair continues its journey higher.
The move from the current price at 186.47 to the target at 251.00 represents additional upside potential of approximately 64 JPY points. While this may seem ambitious, the technical framework and fundamental backdrop support such a scenario playing out over the coming years.
Fundamental Backdrop:
The fundamental factors that I highlighted in my original analysis continue to support the bullish case. The structural weakness of the Japanese Yen persists due to the Bank of Japan's continued ultra-loose monetary policy stance. Meanwhile, the European Central Bank maintains a relatively more hawkish position, creating an interest rate differential that favors the Euro.
Carry trade dynamics remain favorable for EUR/JPY, as traders can benefit from the interest rate spread while also capturing upside movement in the exchange rate. This dual incentive continues to attract capital flows into this currency pair.
Global economic conditions, including inflation concerns and geopolitical uncertainties, continue to influence currency markets. However, the structural policy divergence between the BOJ and ECB remains the dominant force driving this trend.
Key Levels to Watch:
The order block zone around 130-140 remains the most critical support area on the chart. As long as the price maintains its position well above this zone, the bullish structure stays intact. The ascending trendlines also provide dynamic support levels that traders should monitor for signs of trend continuation or potential weakness.
The monthly support levels at 139.002 and 111.092 provide additional reference points in case of deeper retracements. However, current price action shows strong momentum and little indication of such corrections materializing in the near term.
Risk Considerations:
While the technical picture remains bullish, traders should be aware of potential risks. A significant shift in Bank of Japan policy, such as a move away from ultra-loose monetary conditions, could impact the trajectory. Similarly, unexpected economic weakness in the Eurozone or global risk-off events could trigger temporary setbacks.
The key for long-term traders is to maintain perspective on the larger trend while managing risk appropriately. Stop losses should be placed at technically significant levels, such as below the ascending trendline or the order block zone, depending on individual risk tolerance.
Looking Forward:
The development of this trade from 124.00 to the current level demonstrates the value of identifying major trend changes early. The breakout from the multi-year consolidation pattern was the catalyst for this substantial move, and the continuation pattern suggests there is more upside to come.
As the pair approaches the 200.00 psychological level, we may see some temporary consolidation or profit-taking. However, the overall path of least resistance remains to the upside, and any pullbacks should be viewed as potential opportunities rather than signs of trend exhaustion.
Conclusion:
This update confirms that the EUR/JPY bullish thesis continues to develop as anticipated. The technical structure remains strong, fundamental conditions support further Yen weakness, and the 251.00 target remains a realistic objective for this long-term trade. Patience and proper risk management will be key as this trend continues to unfold.
This analysis represents my personal technical assessment and market outlook. It does not constitute financial advice. Always conduct your own research and implement appropriate risk management when trading.

EURJPY demand level in control, expecting a decent reactionGBPJPY demand level in control, expecting a decent reaction from this imbalance . Long bias

EUR/JPY Price Outlook – Trade Setup📊 Technical Structure
TICKMILL:EURJPY EUR/JPY staged a sharp rebound after briefly breaking below the 183.20–183.30 support zone, forming a clear false breakdown structure. Price was quickly rejected from the downside and recovered back above the support area, indicating strong buying interest at lower levels.
Currently, the pair is holding above 183.50, suggesting a short-term bullish recovery phase is underway. As long as price remains supported above the key demand zone, the technical structure favours a continuation toward the upper resistance band rather than a renewed sell-off.
🎯 Trade Setup (Bullish Bias)
Entry Zone: 183.20 – 183.35
Stop Loss: 183.17
Take Profit 1: 183.75
Take Profit 2: 183.88
Risk–Reward Ratio: Approx. 1 : 2.42
📌 Invalidation
A sustained break and close below 183.00 would invalidate the bullish rebound setup and shift the short-term bias back to the downside.
🌐 Macro Background
On the macro side, the Euro has found near-term support after the European Union signalled coordinated efforts to counter potential U.S. tariff actions, helping stabilize sentiment toward the single currency.
Meanwhile, the Japanese Yen remains vulnerable despite repeated verbal warnings from Japanese officials regarding potential intervention. Weak Japanese industrial production data has also weighed on JPY fundamentals, reducing downside pressure on EUR/JPY and allowing technical rebounds to develop more easily at key support levels.
Overall, the macro backdrop does not contradict the current technical rebound structure.
🔑 Key Technical Levels
Resistance Zone: 183.75 – 183.88
Support Zone: 183.20 – 183.30
Bullish Invalidation: Below 183.17
📌 Trade Summary
EUR/JPY has rejected the lower support zone and regained upward traction. As long as price holds above 183.20, the short-term bias favours a buy-on-dips approach, targeting a rebound toward the upper resistance area.
⚠️ Disclaimer
This analysis is for reference only and does not constitute investment or trading advice. Financial markets involve risk, and traders should manage positions according to their own risk tolerance.

EUR/JPY Pulls Back From Record HighEUR/JPY Pulls Back From Record High
As the chart shows, the exchange rate rose above ¥185.00 per euro for the first time ever earlier this week. Today, however, a modest pullback is visible, with the Japanese yen strengthening against the euro.
Fundamentally, this move has been supported by a combination of factors, most notably news from Japan. According to media reports, Japan’s Finance Minister, Satsuki Katayama, said that Tokyo could carry out a joint currency market intervention with the United States to support the yen.
In addition, traders are positioning ahead of an important week, during which:
→ the Bank of Japan will announce its interest rate decision;
→ Japan’s parliament may be dissolved to pave the way for snap elections;
→ euro area PMI figures will be released.
Technical Analysis of the EUR/JPY Chart
Price action continues to form an ascending channel (shown in blue). At the same time, signs of a shift in sentiment have emerged.
At the start of the week, sentiment was bullish:
→ the price broke through a local resistance line and consolidated in the upper half of the channel;
→ it surpassed the December high and moved above the psychological level of ¥185 per euro.
Subsequently, bears took control:
→ the pair failed to hold above the 185.00 level;
→ the price fell back to the channel’s median, which failed to provide meaningful support;
→ the decline continued, with the local 183.9 level switching from support to resistance.
It is reasonable to assume that the lower boundary of the channel could limit further downside in EUR/JPY. However, this support is unlikely to hold if the Bank of Japan, potentially backed by the US, actively steps in to strengthen the yen.
This article represents the opinion of the Companies operating under the FXOpen brand only. It is not to be construed as an offer, solicitation, or recommendation with respect to products and services provided by the Companies operating under the FXOpen brand, nor is it to be considered financial advice.

TheGrove | EURJPY Buy | Idea Trading AnalysisEURJPY is moving on Resistance zone..
The chart is above the support level, which has already become a reversal point twice.
We expect a decline in the channel after testing the current level.
We expect a decline in the channel after testing the current level
Hello Traders, here is the full analysis.
I think we can soon see more fall from this range! GOOD LUCK! Great SELL opportunity EURJPY
I still did my best and this is the most likely count for me at the moment.
-------------------
Traders, if you liked this idea or if you have your own opinion about it, write in the comments. I will be glad ⚜️

EUR /JPY Ready To Go Up And Give Us 150 Pips , Fake Or True ?Here is my 4H Chart on EUR /JPY , We Have A Clear Breakout and the price closed above my old res and new support and we have a very good bullish Price Action on 1 And 2 And 4 Hours T.F Also , the price will try to retest the area and if it give us a good bullish price action on smaller time frames we can enter a buy trade and we can targeting from 100 to 150 pips . and i prefer to have a daily closure above the broken res to be sure that it`s not a fake breakout , and if we have a daily closure again below my new res then this idea will not be valid anymore .
Entry Reasons :
1- Clear Breakout
2- Many T.F Confirmations .
3- Perfect Price Action

TAKE PROFIT - ( EURJPY BLUES )Eurjpy hit take profit and gave us zero to no problems, to the ones that joined in on the free signal you are in profit always remember the rules to the market and approach

EURJPY RECAP + NEW TRADEEurjpy hit take profit and now there’s more opportunities for a new trade , stay tuned for more info
Eurjpy buy @ 183.000
TP1 : 183.080
TP2 : 183.100
TP3 : 183.150
TP4 : 183.200
SL : 182.700

EUR/JPY Buyers Defend HMA — Trend Continuation Active!📈 EUR/JPY “YUPPY” — Bullish Continuation Setup
Forex Market Trade Opportunity Guide | Day / Swing Trade
🧭 Market Bias
BULLISH CONFIRMED ✅
Trend strength validated by Hull Moving Average (HMA) with multiple pullback touches, indicating strong dynamic support and controlled bullish structure.
🧠 Trade Plan Logic
Price continues to respect the HMA, showing healthy pullbacks rather than breakdowns
Buyers are defending dips aggressively → trend continuation environment
Momentum favors buy-the-dip / layered accumulation over chasing breakouts
🎯 Entry Strategy (Layered Method)
Entry Type: Buy on any price level using layered limit orders
Layered Buy Limits (example):
Buy Limit 1️⃣: 183.000
Buy Limit 2️⃣: 183.500
Buy Limit 3️⃣: 184.000
(You may increase or modify layers based on your own execution model)
📌 Layering Advantage:
Reduces emotional execution, improves average price, and aligns with pullback-based trend trading.
🛑 Risk Management
Stop Loss: 182.500
⚠️ Dear Ladies & Gentlemen (Thief OG’s):
This SL is not mandatory. Adjust according to your own risk model, account size, and strategy rules.
🏁 Profit Objective
Target Zone: 186.000
🚔 Why this level?
Acts as a police barricade (strong resistance zone)
Market likely to be overbought
Potential bull trap / profit-taking zone
⚠️ Dear Ladies & Gentlemen (Thief OG’s):
I am not recommending only this TP. Secure profits based on your own discipline and market conditions.
🔗 Related Pairs to Watch (Correlation Intelligence)
📊 EUR/USD
Reflects Euro strength or weakness
Strength in EUR/USD → supports upside continuation in EUR/JPY
📊 USD/JPY
Proxy for JPY strength
Weakness in JPY (USD/JPY bullish) → fuels EUR/JPY upside momentum
📊 EUR/CHF
Measures Euro risk sentiment
Stability or strength here confirms broader EUR demand
📌 Key Insight:
👉 EUR/JPY moves best when EUR is strong AND JPY is weak — monitor both sides simultaneously.
🌍 Fundamental & Economic Factors Supporting This Trade
🏦 European Side (EUR)
ECB remains focused on inflation control, keeping EUR supported
Eurozone data stability encourages carry-trade participation
Any hawkish ECB tone strengthens bullish EUR flows
🏯 Japanese Side (JPY)
Bank of Japan continues ultra-loose monetary policy
Yield differentials keep pressure on JPY
Yen remains vulnerable during risk-on market conditions
🗓️ Upcoming Market Drivers to Monitor
ECB policy statements & inflation commentary
BOJ monetary policy outlook
Eurozone PMI / Inflation data
Japan CPI & wage growth data
Global risk sentiment (equities & bonds)
📌 Macro Theme:
As long as yield differentials remain wide, EUR/JPY favors upside continuation.
🧩 Final Trading Notes
Trade with structure, not emotion
Respect trend → execute pullbacks
Protect capital first, profits follow
Let the market pay you for patience
💬 If this setup adds value, drop a 👍, save it 📌, and share with fellow traders.
📈 Trade smart. Stay disciplined. Let the chart speak.

183.5+ EURJPY BUY Eurjpy Buy @ 183.580
TP1 : 183.660
TP2 : 183.680
TP3 : 183.700
TP4 : 183.900
SL : 183.080
Trading is risky make sure to move (SL) to (Profit) and close partials if you can
Trade requirements - (50/50)+Trial Stop

EURJPY Bearish Setup – Downtrend PlayEURJPY is showing bearish pressure. Short position targets 183.963 with a stop at 184.433. Watch for continuation of the downtrend while managing risk.

PERFECT PROFIT ON EURJPY Eurjpy hit take profit with minimal to no drawdown , so now we can wait for more opportunities to capitalise, more profits and set ups

EURJPY M30 – Strong Bullish Impulse Into Reversal Zone📊 EURJPY – M30 Strong Impulse Move into Premium Reversal Zone
🔍 Technical Analysis
EURJPY on the 30-minute timeframe is showing a powerful bullish impulse, driven by strong momentum and aggressive buying pressure. Price has expanded sharply from the lower consolidation area, leaving behind minimal retracement, which often signals institutional participation and urgency in order flow.
📈 Impulsive Move & Momentum Analysis
The chart shows a clean bullish expansion, characterized by large-bodied candles and shallow pullbacks.
This type of movement typically represents a liquidity-driven breakout, where sellers are forced to exit and buyers chase higher prices.
Momentum remains bullish, but price is now entering a premium zone, where risk-to-reward for new longs becomes unfavorable.
🟥 Premium Reversal Zone (Upper Area)
The marked Reversal Zone represents a key supply and reaction area.
This zone aligns with:
Prior high-liquidity levels
Potential institutional sell interest
Overextended price conditions after an impulsive leg
The highlighted circle emphasizes the decision point, where market intent will become clear.
⚠️ “Pattern Must” – Confirmation Is Key
This is not a blind sell zone.
A clear bearish pattern must form, such as:
Strong rejection wicks
Bearish engulfing candles
Lower high / micro structure shift
Without confirmation, price may continue consolidating or push slightly higher to sweep liquidity before reacting.
🔄 Possible Market Scenarios
Scenario 1 – Bearish Reaction (Pullback / Correction):
If sellers defend the reversal zone, a corrective move lower is likely.
This would be a healthy retracement within a larger bullish context.
Scenario 2 – Continuation Higher:
A strong close above the reversal zone with volume would indicate acceptance at higher prices.
In this case, the bearish idea is invalidated, and price may target higher liquidity levels.
🧠 Trading Insight
Strong trends often end or pause at premium zones, not in the middle of expansion.
Let the market show rejection before committing to a trade.
Structure + reaction + volume = probability.
📌 Key Levels to Watch
Resistance: Premium Reversal Zone
Support: Internal pullback levels from the impulsive move
Bias : Bullish momentum, cautious bearish reaction only with confirmation
💬 Trade confirmation, not emotion. Patience protects capital.

EURJPY 30M: Bullish Structure Testing Premium Supply Area🔷 Possible Reversal Setup at Premium Zone (EURJPY – 30M)
📌 Market Overview
The EURJPY pair on the 30-minute timeframe is currently trading in a strong bullish structure, characterized by higher highs and higher lows. Price has respected demand areas well and continues to push upward with momentum, showing that buyers are still in control in the short term.
However, the chart clearly highlights a premium supply / reversal zone above current price, where previous institutional selling pressure exists. This zone is marked as a key decision area rather than an immediate sell.
📊 Price Action & Structure Analysis
Price previously formed a range consolidation, followed by a strong bullish breakout, confirming buyers’ strength.
After the breakout, the market created a sequence of impulsive bullish legs and corrective pullbacks, maintaining structure.
Current price is approaching the upper liquidity zone, where smart money may look to distribute positions.
This area is not a blind-entry zone. The chart explicitly notes “Need Pattern Here”, emphasizing that confirmation is required before any reversal trade.
🔄 Reversal Zone Logic
The highlighted zone acts as a high-probability reaction area due to:
Previous rejection from this level
Price reaching a premium range
Potential liquidity grab above recent highs
Once price enters this zone, the market may:
Sweep liquidity above highs
Form a bearish confirmation pattern
Shift short-term structure to the downside
Without confirmation, bullish continuation is still possible.
🕯️ Confirmation to Watch
Traders should wait for clear bearish price action, such as:
Bearish engulfing candles
Long upper wicks (rejection)
Lower high formation
Break of internal bullish structure
Only after confirmation does a short setup become valid.
🎯 Trade Expectations (Scenario-Based)
Primary Scenario:
Price taps the reversal zone → forms bearish confirmation → corrective move downward toward the marked support area.
Alternate Scenario:
Price breaks and holds above the zone → bullish continuation remains intact.
This approach keeps risk controlled and avoids emotional or early entries.
🧠 Trading Psychology Insight
This setup teaches patience. The zone itself is not the signal—
price behavior inside the zone is the signal.
Professional traders wait for the market to show its hand before committing capital.
