Euro FX Playbook: Key Levels That Will Decide the Next Leg1. Macro overview
The broader narrative driving the dollar and Euro FX in the past quarter has been centered on shifting Federal Reserve expectations and the market’s evolving outlook on global growth. The dollar has remained firm as traders continue to balance softer inflation prints against persistent uncertainty around the timing and magnitude of future rate adjustments. While inflation has moderated, the market has not fully embraced a clear easing cycle, which has kept the dollar supported during periods of risk aversion.
For Euro FX, this environment has created a backdrop where price action has been more about relative policy expectations and the pace at which each central bank signals a shift. The Euro has struggled to sustain directional conviction because both sides have been sending mixed signals. This has produced choppy two sided auctioning within a broader range. Sellers have shown responsiveness at the upper end of the structure, while buyers have continued to defend well defined pockets of liquidity near the lows. The result has been repeated consolidation blocks forming as neither side fully takes control.
2. What the market has done
The market was trending lower from September into November while still trading within the larger multi month range between 1.200 (daily resistance) and 1.155 (daily support). Offers consistently stepped down through this period.
Buying liquidity was found again at the 1.155 area. Buyers had previously responded here, initiating the August rally off May’s Bid Block 1 which formed the daily support. This zone once again acted as a key response area. Bids stepped up as the market compressed into late November, and buyers were able to push back through the descending offer sequence.
From there, the market auctioned two way between the 1.174 area (1 December weekly VAH and daily pivot zone 2) and the 1.155 daily support. Buyers stepped up bids in early December and succeeded in bidding prices back above 1.174, showing that buyers were still present and willing to auction the market back up. This move also confirmed that sellers failed to hold the breakdown from the prior 1.5 month consolidation block.
3. What to expect in the coming week
The key level to watch is the 1.182 area (29 September weekly VAH).
Bullish Scenario
• If the market is able to accept above 1.182, it is expected to continue higher toward 1.187 (daily pivot zone 1).
• Sellers are expected to respond here from 1.187.
• If sellers fail to respond, the next upside target becomes 1.1967 (15 September weekly VPOC) and possibly 1.200 (daily resistance).
• A move into these levels would place price near the upper boundary of the larger multi month range.
Neutral Scenario
• If the market is unable to accept above 1.182, or if sellers defend and reject price from 1.187 (daily pivot zone 1), the market is expected to remain rotational.
• The likely rotation range sits between 1.173 (1 December weekly VAH / daily pivot zone 2) and 1.187.
• This should allow the market to establish value higher and form a base for further directional resolution.
Bearish Scenario
• If buyers fail to defend 1.173 (1 December weekly VAH, daily pivot zone 2, and Bid Block 3 range high), the market is expected to push lower to 1.1666 area (17 November VAH).
• If selling continues, price may extend further to 1.1644 (24 November weekly VPOC).
Conclusion
Euro FX remains in a larger range with clearly defined response zones on both sides, and next week’s behavior around 1.182 will set the tone for whether the market rotates higher or slips back into balance.
Let me know what levels you are watching or if you see anything different on your charts. Please give this post a boost so more traders in the community can join the discussion! Thank you.
Disclaimer: This is not financial advice. Trade your own plan and manage your own risk carefully.
Eurofx

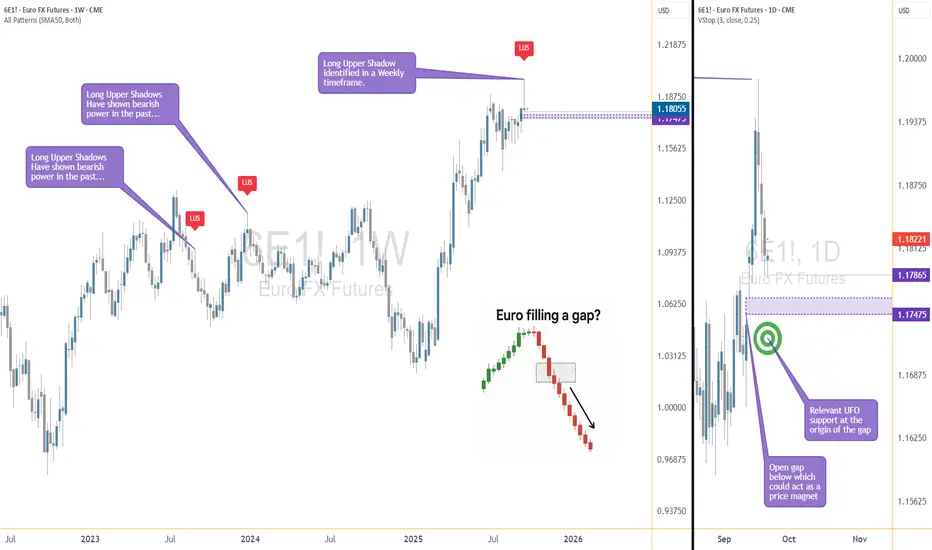
Mind the Gap! The Euro's Waiting GameShadows and Gaps: The Market’s Inside Joke
Euro FX Futures (6E, M6E) are doing that thing again… you know, when the chart leaves a Long Upper Shadow (LUS) on the weekly candle and basically whispers, “Don’t get too comfortable up here, bulls.”
Shadows this long usually mean buyers tried to party at higher levels, but sellers crashed the event and sent everyone home early. And just to make life interesting, the daily chart left an open gap below — like an unfinished side quest in a video game. Gaps are notorious for pulling price back, sooner or later, because the market hates leaving things undone.
The Setup: Simple but Sweet
Here’s how the trade idea shapes up:
Trigger: Wait for a break below 1.17865 (prior low).
Target: 1.17475 — the “gap magnet” zone.
Stop: 1.18090, based on volatility so it isn’t just a random guess.
Reward-to-Risk: Around 2:1. Clean, balanced, and not too shabby.
⚠️ Quick heads-up: right under that gap sits a support zone. Translation? Don’t overstay your welcome. Get in, fill the gap, and don’t go fishing for extra ticks where a bounce might kick you out.
Why This Combo Works
This setup is a little like peanut butter and jelly — two different flavors that just click.
Weekly chart = a big ol’ rejection shadow.
Daily chart = a gap that’s basically screaming, “Fill me!”
Put them together, and you’ve got multi-timeframe confluence — a fancy way of saying “both charts agree.” And when charts agree, traders pay attention.
Big vs. Mini: Futures Contract Fun
6E (Euro FX Futures): Big contract, €125,000. Each tick = $6.25. Great for heavy hitters.
M6E (Micro Euro FX Futures): Mini-me version, 1/10th the size. Each tick = $0.625. Perfect if you’d rather test the waters than dive headfirst.
Micros make scaling in and out a breeze, and honestly, they’re underrated for learning without risking the farm.
The Takeaway
The Euro is caught between rejection above and a magnet below. No downside break yet, but once 1.17865 goes, the path to 1.17475 could be quick.
Moral of the story? Candlestick shadows troll the highs, gaps tempt the lows, and patience is the secret sauce.
Want More Depth?
If you’d like to go deeper into the building blocks of trading, check out our From Mystery to Mastery trilogy, three cornerstone articles that complement this one:
🔗
🔗
🔗
When charting futures, the data provided could be delayed. Traders working with the ticker symbols discussed in this idea may prefer to use CME Group real-time data plan on TradingView: www.tradingview.com - This consideration is particularly important for shorter-term traders, whereas it may be less critical for those focused on longer-term trading strategies.
General Disclaimer:
The trade ideas presented herein are solely for illustrative purposes forming a part of a case study intended to demonstrate key principles in risk management within the context of the specific market scenarios discussed. These ideas are not to be interpreted as investment recommendations or financial advice. They do not endorse or promote any specific trading strategies, financial products, or services. The information provided is based on data believed to be reliable; however, its accuracy or completeness cannot be guaranteed. Trading in financial markets involves risks, including the potential loss of principal. Each individual should conduct their own research and consult with professional financial advisors before making any investment decisions. The author or publisher of this content bears no responsibility for any actions taken based on the information provided or for any resultant financial or other losses.

Gap-Fill Watch: Euro FX Futures React to Weekly RejectionIntroduction
When analyzing futures markets, one of the most compelling signals arises when higher timeframe candlestick rejection aligns with lower timeframe price imbalances. That is exactly what we see in Euro FX Futures (6E, M6E). On the weekly chart, long upper shadows (LUS) have historically marked turning points, reflecting exhaustion of bullish pressure. On the daily chart, an open gap below current price offers a potential magnetic pull. Together, these elements provide a textbook technical case study of how price can align across timeframes.
This article explores the educational insights behind candlestick rejection and gap mechanics, then applies them to a concrete trading scenario in 6E and its micro equivalent, M6E.
Weekly Chart: The Long Upper Shadow (LUS)
Long Upper Shadows appear when a market tests higher levels but fails to sustain them, leaving sellers in control by the close. They are one of the clearest visual expressions of rejection.
In Euro FX Futures, past long upper shadows have preceded significant bearish moves. Each instance reflects an imbalance where buyers were unable to absorb selling pressure at higher prices. The most recent weekly candlestick shows another long upper shadow forming near resistance. For technically minded traders, this is an early warning sign of potential downside ahead.
Daily Chart: The Open Gap Below Price
Price gaps occur when markets open significantly away from the prior session’s close. In futures, gaps often act like magnets—price tends to revisit them over time as liquidity seeks balance.
Currently, Euro FX Futures show an unfilled gap just below the market. Historically, such gaps in 6E have attracted price action, especially when combined with bearish rejection signals from higher timeframes. The combination of a weekly LUS above and a daily gap below paints a picture of imbalance: rejection at the highs, unfinished business at the lows.
Trade Setup
A structured trade idea emerges from this technical alignment:
Entry condition: Short position if 6E breaks below the prior day’s low at 1.17865. This ensures price is moving in line with bearish continuation before entry.
Target: 1.17475, the origin of the open gap. This is where the “magnet effect” is expected to complete.
Stop-loss: 1.18090, derived from a 2-day ATR calculation and adjusted to 25%. This keeps risk tight but accounts for minor noise.
Reward-to-Risk Ratio: With entry near 1.17865, risk is around 22 ticks while potential reward is about 39 ticks, yielding a favorable R:R of almost 2:1.
Risk caveat: Right below the gap origin lies a UFO support area. This means price may stall or reverse after the gap is filled. Being conservative with the target is wise—seeking deeper downside could run into structural support.
Contract Specs and Margin Notes
Understanding the contract structure is vital when applying risk management.
o Euro FX Futures (6E):
Contract size = €125,000
Tick size = 0.00005 USD per euro = $6.25 per tick
Initial margin (approximate, varies daily): ~$2,500–$3,000
o Micro EUR/USD Futures (M6E):
Contract size = €12,500 (1/10th of 6E)
Tick size = 0.0001 USD per euro = $1.25 per tick
Initial margin (approximate, varies daily): ~$300–$400
Application: Traders with smaller accounts can use M6E to size positions more precisely, while larger participants may choose 6E for liquidity. Micros provide flexibility to scale in/out of trades while maintaining strict risk per trade.
Risk Management Essentials
Risk management is not about avoiding losses—it is about ensuring that any loss remains controlled relative to potential reward. This trade idea highlights three core principles:
Stop placement by ATR: Volatility-based stops adjust naturally to current market conditions. Using 25% of a 2-day ATR prevents overexposure while respecting noise.
Position sizing: Traders should calculate how many contracts (6E or M6E) align with their personal risk tolerance.
Target discipline: While tempting to aim lower than the gap origin, technical evidence suggests price may encounter support there. Conservative targeting avoids overstaying a move.
Educational Takeaway
This setup demonstrates the power of multi-timeframe confluence. A weekly rejection signal provides context, while a daily gap gives tactical direction. Traders often gain an edge when higher timeframe sentiment (bearish rejection) aligns with lower timeframe imbalances (gap fill).
For students of price action, this is a reminder that candlestick patterns should never be taken in isolation. Instead, they should be validated by market structure, liquidity imbalances, or other confirming signals.
Conclusion
Euro FX Futures present a case study in how weekly rejection and daily gaps can combine to create a structured opportunity. While no outcome is certain, the confluence of signals here underscores the educational value of analyzing shadows and gaps together.
Traders can study this setup not only as a potential trade but also as a lesson in disciplined multi-timeframe analysis.
When charting futures, the data provided could be delayed. Traders working with the ticker symbols discussed in this idea may prefer to use CME Group real-time data plan on TradingView: www.tradingview.com - This consideration is particularly important for shorter-term traders, whereas it may be less critical for those focused on longer-term trading strategies.
General Disclaimer:
The trade ideas presented herein are solely for illustrative purposes forming a part of a case study intended to demonstrate key principles in risk management within the context of the specific market scenarios discussed. These ideas are not to be interpreted as investment recommendations or financial advice. They do not endorse or promote any specific trading strategies, financial products, or services. The information provided is based on data believed to be reliable; however, its accuracy or completeness cannot be guaranteed. Trading in financial markets involves risks, including the potential loss of principal. Each individual should conduct their own research and consult with professional financial advisors before making any investment decisions. The author or publisher of this content bears no responsibility for any actions taken based on the information provided or for any resultant financial or other losses.
Will EUR-USD Parity Repeat?Two men adventuring in the wild. They see a tiger racing towards them. They turn and start dashing away. Then, one of them stops to put on shoes. “What are you doing? The beast will outsprint you despite those” says the other. “I don’t have to run faster than the tiger” he retorts. “I just have to outrun you.”
FX stories are not dissimilar. Relative strengths and weaknesses facilitate price discovery between currency pairs.
On 1 January 2002, twelve EU countries move to euro in a historic event. Since December 2002, the euro has always traded above parity to the US dollar. The only exception is the last quarter of 2022.
EUR/USD has been above parity since late 2002 except for Q4 2022
Despite the collapse of regional banks, US corporations and consumers are in the pink of health. Cracks are starting to show in certain pockets but none too alarming (just yet).
In contrast, economic conditions in Europe are in sharp deterioration. Arguments abound on the direction of the euro ahead.
Following the rate decisions by the ECB and the US Fed last week, volatility in the Euro/USD pair has been trending to near 12-month lows. Low volatility equates to lower premiums on options. Periods of low volatility are opportune time for buying options.
This paper posits that euro will carry greater risk to the downside. That said, geopolitics and economics could turn favourably to the euro resulting in a rally. To seize opportunities presented by the price action, this paper posits a long straddle to benefit from low volatility & a euro that is set to move.
EURO SKEPTICS OBSERVE MANY PROBLEMS
Talk of the euro falling back to parity is once again creeping into the market murmurs. Google search on euro parity is at levels last seen in Nov 2022.
As reported by Bloomberg, last month, Nomura, Rabobank & ING analysts forecast the euro to get to levels marginally shy of parity to the USD. The likelihood of the euro hitting parity by early next year have more than doubled, as per Bloomberg options model.
Strong US economic fundamentals, rising US yields are bolstering the dollar. Rate differentials between the two tilts in dollar’s favour. US Q3 Real GDP was up by an annual rate of 4.9%, more than double the growth rate for Q2.
Additional tailwinds for greenback include sluggish Eurozone economic growth, concerns linked to Italy’s government debt, and slowdown in destination markets for Eurozone's exports.
OTHER ANALYSTS BELIEVE THAT EUROZONE PESSIMISM IS ALREADY PRICED IN
Disagreeing with euro sceptics are analysts with a view that Eurozone pessimism has been baked in.
Eurozone GDP fell by 0.1% in Q3. Despite feeble GDP data, market reaction was stoic. That points to an "invisible" floor for the euro. Lack of growth is priced in.
FOUR CHARTS CONTRASTING US EXCEPTIONALISM WITH GROWING EUROPEAN WEAKNESS
US GDP continues to expand at a remarkable clip given the size of the economy. In sharp contrast, Eurozone GDP growth is fragile and steadily losing steam.
US GDP racing ahead with Eurozone GDP losing steam
US inflation, while softening, is showing signs of spiralling up, thanks to its resilient and tight labour market. This puts the Fed on a hawkish stance supporting USD.
Inflation still above central bank targets but US inflation raging higher than in Eurozone
Meanwhile, the ECB might have headroom to ease rates thanks to slowing inflation and might be forced to loosen up to support growth and to stem economic contraction as shown below.
Composite PMI in US in expansion territory compared to sharp contraction in Eurozone
Monetary policy divergence between the Fed and the ECB has prevailed since early last year when the Fed was quicker relative to ECB to crank up rates.
Interest Rate Policy Divergence in US has continued to remain in favour of the dollar
In summary, the USD is poised to strengthen against the Euro, given strong GDP, higher US inflationary environment, sharp contraction in Eurozone, and continued monetary policy divergence.
TECHNICALS ALIGN WITH FUNDAMENTALS POINTING TO WEAKENING EURO
Momentum based indicators signal further weakness in the euro while oscillators point to strengthening based on near term mean reversion.
Overall, across twenty-five indicators curated by TradingView, eleven signal weakening, ten neutral, and four point to strengthening.
TradingView’s Technical Signals Dashboard point to euro weakness
CFTCs Commitment of Traders (CoT) report show that leveraged funds are net short. Asset managers who are still net long are gradually reducing their long positions.
In contrast to fundamentals, technical, and CoT reports, options market data points show that traders are bullish for euro to strengthen. Put-call ratio at 0.76 shows larger open interest on calls compared to puts.
That said, over the last one trading week, options traders are increasing puts compared to calls suggesting shifting market sentiments leaning towards a weakening euro.
Implied volatility based on options market is near 12-month lows with the conclusion of central bank meetings across both sides of the Atlantic. Low implied volatility makes premiums affordable.
CVol Index is at near 12-month low (Source: CME QuikStrike)
HYPOTHETICAL TRADE SET UP
Affordable premiums offer the best opportunity for buying options. When ambivalence prevails on the path ahead for the euro, traders could consider a long straddle to leverage volatility expansion and price action.
This paper posits a long straddle at a strike of 1.0845 on CME EUR/USD options expiring on 5th April 2024. A long straddle comprises of two legs: (a) long position in a call, and(b) long position in a put, at the same strike and expiry.
Each CME EUR/USD Monthly options contract delivers an exposure to 125,000 euros. Take the settlement prices as of November 3rd as an example, premiums for the (a) long call at 0.0182, and (b) long put at 0.0187, aggregate to 0.0369 for the long straddle. This translates into USD 4,613 in straddle premiums.
The straddle has two break-even points (BEP) at expiry. BEP on the downside is at 1.0476. BEP on the upside is at 1.1214.
The pay-off from the straddle is illustrated in the chart and table below.
Pay-off at Expiry from Long Straddle (Source: Mint Finance Analysis)
MARKET DATA
CME Real-time Market Data helps identify trading set-ups and express market views better. If you have futures in your trading portfolio, you can check out on CME Group data plans available that suit your trading needs www.tradingview.com
DISCLAIMER
This case study is for educational purposes only and does not constitute investment recommendations or advice. Nor are they used to promote any specific products, or services.
Trading or investment ideas cited here are for illustration only, as an integral part of a case study to demonstrate the fundamental concepts in risk management or trading under the market scenarios being discussed. Please read the FULL DISCLAIMER the link to which is provided in our profile description.

Euro In Trouble For Continued Downside Against The Dollar We saw a strong bounce off of the 61.8% fibonacci zone, but we're coming up on a strong resistance that was previously a strong support.
I like to play these Support/resistance flips the first time they test it as the supply usually keeps the price from moving through the level and they are nice shorts with a strong RR for less risk.
I have a relatively tight stop as I could also see a potential push through the resistance to the top diagonal resistance level that we've seen hold back the price several times now.
I don't foresee that happening though, but it's important to weigh all the angles when looking at a trade.
If I get stopped out, I may take another go at it from that level also as it has confluence with both diagonal and horizontal resistances.
On the daily, the 20MA is lining up with our short zone nicely for a possible retest.
On the 240 (4 hour), we are also seeing a possible retest of the 30MA, that has been very pivotal for the FX:EURUSD chart as you can see it used it as support on it's most recent rally.
Looking at the macro picture, we can see we've got a gap way down below around the 78.6% level as well as a bearish picture that is being painted for a full retrace back to the bottom for a potential double bottom.
Listening to Chairman Powell's comments on the US Economy from 60 minutes aligns with my trade thesis as he stated that the US economy looks healthy on every metric and we should see continued growth into 2019 without any rake heights from the Fed.
As always, manage your risk and try and maintain at least a 2:1 or 3:1 RR on all of your trades to maintain profitability in the long run.
This is a small swing trade position on the smaller time frame, but if we do break that 61.8% level and the blue line from previous support doesn't hold, next supports are a ways down based on the VPVR as well as the fibonacci level.
Cheers and happy trading!

Euro Fx/US Dollar (EUR/USD): At The Middle Of Wave C?Find Winning Trades In Seconds >> efcindicator.com (Special Discount)
The end of wave C can take us slightly below 1.1... the immediate support below (S1) is a strong one.

EURUSD for next week bullish 5-0 pattern formed at key level.
if candle pattern confirms reversal,
this is chance to long.
very small SL.
RR ratio is amzing.
tp1 is 0.618 level of CD wave
tp2 is 1.13 level of BC -0.03% wave
SL will trigger if candle close under key level


Taking Some Profits on EURSUD SHORT.As per my discussion here and here the EURUSD is still ranging with price oscillating around the 1.245-1.235 mark. Although I'm not a huge fan of candlestick patterns, previous three days put in a Bearish Evening Star after hitting up against trendline resistance, area of supply, and the 61.8% retracement level. I've been short since 02.16.18 with several lots and decided to take +150 pip profit on one of them at the end of the New York session yesterday. Currently sitting on +130 pips between 3 lots. As I'm typing this the EUR is rallying intraday as the USD declines after a muted NFP announcement. As I wrote here , the USD rally can't be considered on and the prevailing trend is still down. As I see it, only a decisive break and close above 91.00 signals a Bullish dollar.
Trade accordingly.

