Don’t Rush to Buy EURUSD – The Bearish Trend Is Speaking UpEURUSD is currently leaning toward a short-term BEARISH trend, as recent news continues to favor the U.S. dollar over the euro . The ECB has kept interest rates unchanged with a rather cautious tone , while Eurozone data and momentum remain too weak to support a sustainable EUR recovery. In contrast, the USD is still supported by expectations that U.S. interest rates will stay higher for longer , making EURUSD rallies vulnerable to selling pressure.
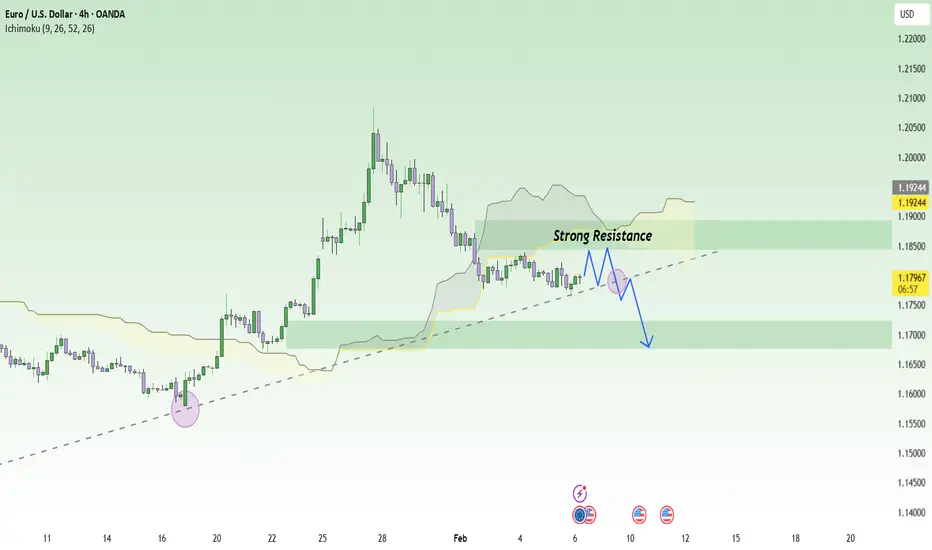
On the chart, after the strong rally at the end of January , price has entered a corrective phase and is now trading below the Ichimoku cloud. This signals that bullish momentum has faded , and the market is shifting into a “technical rebound within a short-term downtrend” . Recent candles are compressing around the 1.17–1.18 zone, which may look like accumulation, but in reality it is more likely consolidation before a downside break if price fails to clear overhead resistance.
The 1.1840 area stands out as a clear resistance zone (supply confluence + cloud resistance) , where selling reactions are highly likely. If price pulls back toward 1.1840 but fails to hold, the higher-probability scenario is a renewed move lower, with an initial focus on 1.1700, and a deeper extension toward 1.1677, in line with the marked targets.
EURUSD
EURUSD Bullish Recovery After Healthy Correction, Target 1.1870Hello traders! Here’s my technical outlook on EURUSD (4H) based on the current chart structure. EURUSD previously traded within a mixed structure that transitioned from a broader corrective phase into a clear bullish recovery. After forming a base near the rising higher-timeframe trend line, price began to print higher lows, signaling the gradual return of buyer control. This recovery phase was supported by a breakout above the descending triangle resistance line, which marked an important structural shift and confirmed the end of the prior bearish pressure. However, after reaching the upper Resistance / Seller Zone around 1.1870, bullish momentum slowed, and the market faced rejection from this key level. This rejection initiated a corrective pullback, which brought price back toward the former breakout area and the Support Level / Buyer Zone near 1.1780–1.1800. This zone is significant, as it represents previous resistance turned support and aligns with the rising triangle support line, making it a critical area for buyers to defend. Currently, EURUSD is stabilizing above this support zone, suggesting that the pullback is corrective rather than the start of a new bearish leg. As long as price holds above the Buyer Zone and continues to respect the rising support structure, the overall bias remains bullish. My primary scenario favors continuation to the upside after consolidation or a shallow pullback, with a potential move back toward the 1.1870 Resistance Level (TP1). This area stands as the first major upside target and a logical zone for partial profit-taking. If EURUSD manages to break above the 1.1870 resistance with strong acceptance, this would confirm bullish continuation and open the door for further upside expansion. On the other hand, a decisive breakdown and acceptance below the Buyer Zone and rising support line would invalidate the bullish scenario and signal a deeper correction. Until such confirmation appears, EURUSD remains positioned for a bullish continuation within the current market structure. Always manage your risk and trade with confirmation. Please share this idea with your friends and click Boost 🚀

EUR/USD | Going to the bearish breaker (READ THE CAPTION)Good afternoon folks, Amirali here.
As you can see in the hourly chart of EURUSD, in the early hours of today, it reached the Bullish OB zone, then Swept the liquidity pool and then went up, hitting the IFVG and then gone above it, now being traded at 1.1796.
I'm eying the Bearish Breaker for a potential reversal. However if it goes through the bearish breaker, the targets are: 1.1805, 1.812, 1.819 and 1.1826.
If it reacts to the Bearish Breaker, the targets are: 1.1790, 1.1784, 1.1778 and 1.1772.

EURUSD: Triangle Resistance Holds - Bearish Bias Toward 1.1730Hello everyone, here is my breakdown of the current EURUSD setup.
Market Analysis
EURUSD previously traded within a well-defined consolidation range, where price moved sideways for an extended period, reflecting temporary balance between buyers and sellers and gradual liquidity accumulation. This range eventually resolved to the downside, initiating a sustained bearish move that developed into a clean downward channel, marked by consistent lower highs and lower lows. This structure confirmed strong seller control and an orderly bearish continuation rather than a panic-driven sell-off. After reaching the lower boundary of the descending channel, selling pressure weakened and price staged a corrective rebound. This rebound led to a breakout above the channel resistance and triggered a sharp bullish impulsive move, which reclaimed the Support Zone and extended into the Resistance Zone around 1.1800–1.1810.
Currently, EURUSD is trading below the Triangle Resistance Line, with price showing a weak pullback and consolidation just under the resistance zone. This behavior suggests a classic bearish retest scenario, where former support has flipped into resistance. The lack of impulsive bullish continuation and repeated rejections from the triangle resistance further reinforce the bearish bias.
My Scenario & Strategy
My primary scenario favors short continuation, as long as EURUSD remains below the 1.1800 Resistance Zone and the descending triangle resistance line. The recent bullish push appears corrective and liquidity-driven rather than the start of a sustainable trend reversal. From a structural perspective, the market has failed to reclaim higher highs, and the rejection from resistance confirms that sellers remain in control. As long as price stays capped below resistance, rallies are viewed as selling opportunities rather than signals of bullish continuation. The first downside objective lies near the 1.1730 Support Zone, which represents a key demand area and a prior reaction level. This zone is expected to act as the first major downside target where buyers may attempt a reaction or short-term stabilization. If EURUSD reaches the support zone and shows strong rejection or consolidation, a temporary bounce is possible.
However, a decisive breakdown and acceptance below 1.1730 would confirm further bearish continuation and open the door for a deeper move toward lower demand areas. The short bias remains valid as long as price respects resistance and the descending structure stays intact. A clean breakout and acceptance above the triangle resistance and the 1.1800 zone would invalidate the short scenario and shift focus back toward bullish continuation. Until then, overall structure clearly favors sellers.
That’s the setup I’m tracking. Thank you for your attention, and always manage your risk.

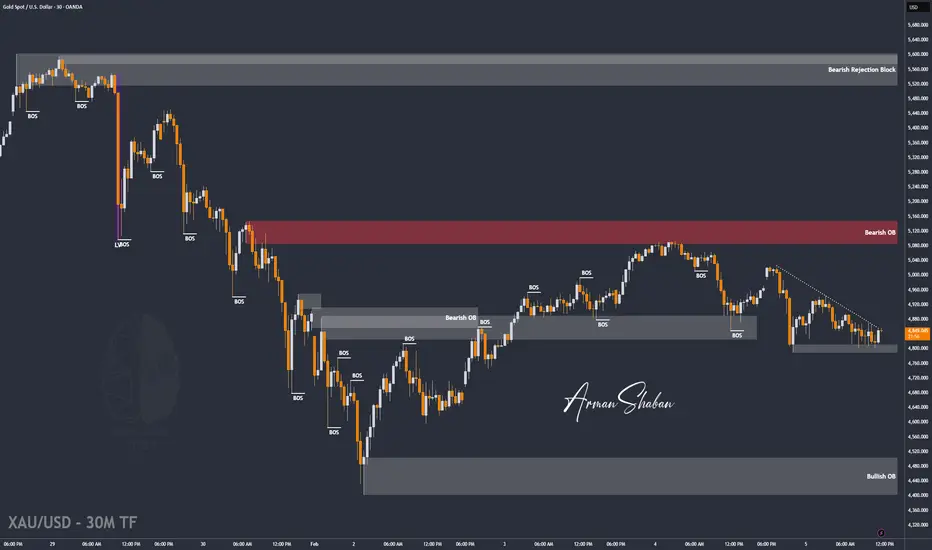
XAU/USD | Gold Short-Term Bounce After Liquidity Grab!By analyzing the #Gold chart on the 30-minute timeframe, we can see that after our previous analysis, price moved exactly as expected and first corrected down to $4,790. After reaching this key level and sweeping the liquidity below it, gold turned bullish again and is now trading around $4,850.
If price can stabilize above $4,839, we can expect further upside in gold. The next potential targets for this move are $4,876 and $4,913.
Please support me with your likes and comments to motivate me to share more analysis with you and share your opinion about the possible trend of this chart with me !
Best Regards , Arman Shaban
TheGrove | EURUSD buy | Idea Trading AnalysisEURUSD broke through multiple Support level and is now holding above the trendline and key level zone. The current pullback toward the marked support cluster suggests a potential continuation of the bullish move, provided price holds this structure.
EUR/USD is trading within a rising channel, with price holding above the ascending support line after a clear bullish and is moving on Resistance LEVEL.
Hello Traders, here is the full analysis.
GOOD LUCK! Great BUY opportunity EURUSD
I still did my best and this is the most likely count for me at the moment.
-------------------
Traders, if you liked this idea or if you have your own opinion about it, write in the comments. I will be glad ⚜️

EURUSD Lower Timeframe Bearish ContinuationQuick Summary
EURUSD continues to trade bearish on lower timeframes and The move appears to be part of a daily timeframe correction, Price may retrace higher toward 1.19035
This level aligns with an H4 supply correction zone
After that continuation lower is expected to fill the liquidity void left uncorrected from the previous month
Full Analysis
EURUSD remains in a bearish phase on the lower timeframes
This downside movement is developing as a corrective leg within the daily structure
A temporary pullback to the upside is possible and Price may rise toward the 1.19035 level
This area represents a supply correction zone on the 4 hour chart
If price reacts from this zone the expectation is for bearish continuation
The main objective of this move is to fill the liquidity void that was left without correction during the previous month
As long as lower timeframe structure stays bearish any upside movement should be treated as corrective

EURUSD Breakout and Potential Retrace!Hey Traders, in today's trading session we are monitoring EURUSD for a buying opportunity around 1.18000 zone, EURUSD was trading in a downtrend and successfully managed to break it out. Currently is in a correction phase in which it is approaching the retrace area at 1.18000 support and resistance area.
Trade safe, Joe.

EURUSD H4 | Bullish Bounce Off 61.8% Fib SupportBased on the H4 chart analysis, we can see that the price is reacting off our buy entry levle at 1.1777, which is a pullback support that aligns with the 61.8% Fibonacci retracement.
Our stop loss is set at 1.1730, which is an overlap support that aligns with the78.6% Fibonacci retracement.
Our take profit is set at 1.1939, which is a pullback resistance that aligns with the 50% Fibonacci retracement.
High Risk Investment Warning
Stratos Markets Limited fxcm.com Stratos Europe Ltd fxcm.com
CFDs are complex instruments and come with a high risk of losing money rapidly due to leverage. 69% of retail investor accounts lose money when trading CFDs with this provider. You should consider whether you understand how CFDs work and whether you can afford to take the high risk of losing your money.
Stratos Global LLC fxcm.com Losses can exceed deposits.
Please be advised that the information presented on TradingView is provided to FXCM (‘Company’, ‘we’) by a third-party provider (‘TFA Global Pte Ltd’). Please be reminded that you are solely responsible for the trading decisions on your account. Any information and/or content is intended entirely for research, educational and informational purposes only and does not constitute investment or consultation advice or investment strategy. The information is not tailored to the investment needs of any specific person and therefore does not involve a consideration of any of the investment objectives, financial situation or needs of any viewer that may receive it. Past performance is not a reliable indicator of future results. Actual results may differ materially from those anticipated in forward-looking or past performance statements. We assume no liability as to the accuracy or completeness of any of the information and/or content provided herein and the Company cannot be held responsible for any omission, mistake nor for any loss or damage including without limitation to any loss of profit which may arise from reliance on any information supplied by TFA Global Pte Ltd.
Stratos Trading Pty. Limited fxcm.com
Trading FX/CFDs carries significant risks. FXCM AU (AFSL 309763), please read the Financial Services Guide, Product Disclosure Statement, Target Market Determination and Terms of Business at fxcm.com

Bitsounis / EURAUD Short limitEURAUD has broken the upward trend in 1h.
and I am waiting for an entry in the fib level zone.

EURUSD Additional Supply Reaction ZoneQuick Summary
Besides the previously mentioned point of interest EURUSD may also react from 1.18422
This level represents a strong supply zone
An inducement area sits just below which could allow a liquidity sweep before continuation
Given the strong bearish momentum price may also ignore this zone and continue lower
Full Analysis
In addition to the point of interest highlighted yesterday there is another potential reaction zone around 1.18422
This area represents a strong supply zone that could trigger a bearish response
Just below this level there is a clear inducement zone
This structure may encourage a brief push higher to sweep liquidity before the market resumes its downside move
However it is important to note that EURUSD is currently falling with strong momentum
When selling pressure is this aggressive price may ignore nearby supply zones and continue lower without providing a clean reaction
For that reason this area should be monitored closely rather than traded blindly

EURUSD: Bullish Trendline Support vs. Heavy Supply ZoneMarket Overview: EUR/USD is currently navigating a complex corrective phase on the 15-minute timeframe. After a recent dip, the price has found solid support along a newly established ascending trendline (blue).
Technical Observations: * Support Structure: The price is actively respecting the blue ascending trendline, which aligns with the lower demand zone near 1.1770 - 1.1780.
Supply Zone: Significant resistance is present in the upper purple block between 1.1830 and 1.1840, where previous sell-offs originated.
Key Targets: * Primary Objective: A retest of the 1.1840 resistance zone.
Secondary Objective: If the trendline breaks, the next target is the liquidity pool around 1.1720.
Trading Strategy: Looking for a potential "Buy the Dip" scenario as long as the blue trendline holds. A decisive breakout above the supply zone would confirm a shift toward a more sustained bullish trend.

EURUSD P Action Analysis|Buy the Support or Trade the BreakoutHello and respect to all TradingView followers 👋
Hope you’re all doing great and trading safely 🌱
🔵 Symbol: EURUSD (Euro / US Dollar)
EURUSD is one of the most important and liquid pairs in the Forex market. Due to its strong connection with macroeconomic data from the Eurozone and the monetary policy of the Federal Reserve, this pair offers high technical reliability and great trading opportunities.
📊 Technical Analysis Based on the Chart
According to the current price structure, we can see that after a strong bullish move, the market has entered a range (consolidation) phase.
At the moment, price is moving between a clearly defined support level and a marked resistance zone, showing market indecision before the next major move.
🟡 Support Zone:
The lower support area plays a key role in maintaining the bullish structure and has shown strong reactions in previous price movements.
🟠 Resistance Zone:
The upper range and resistance zone act as the main trigger for the next directional move. A valid breakout above this area could start a new bullish leg.
🚀 Possible Scenarios (Bullish Bias – Stronger Scenario)
✅ Scenario 1 – Buy from Support
If price revisits the support zone and forms valid bullish reversal candles (such as Pin Bar or Engulfing patterns), we can look for low-risk buy opportunities.
✅ Scenario 2 – Buy After Range Breakout
If price breaks above the range high with strong momentum and confirmation, a pullback to the broken resistance can provide a high-probability buy setup.
📈 Mid-Term & Long-Term Trades
After a confirmed breakout of the range high or low, traders can consider mid-term to long-term positions, following the new market structure.
⏳ Important Trading Notes
🔹 Patience is a trader’s greatest edge
🔹 Always apply proper risk and money management
🔹 Never enter a trade without confirmation
⚠️ Disclaimer
This analysis is for educational and informational purposes only. All trading decisions and risks remain the responsibility of the trader.
📊 Poll – What’s Your Bias?
❓ What do you think will happen next on EURUSD?
🔘 Bullish breakout and continuation 🚀
🔘 Deeper pullback toward support 📉
🏷 Tags:
#EURUSD
#Forex
#TechnicalAnalysis
#PriceAction
#SupportResistance
#RangeMarket
#TradingView
#FXTrading
#SmartMoney

DeGRAM | EURUSD sideways movement📊 Technical Analysis
● $EUR/USD is currently testing support around 1.1780 after forming a series of lower highs.
● A triangle formation suggests a potential breakout, with the resistance area at 1.1810.
💡 Fundamental Analysis
● Recent weaker-than-expected US data has fueled speculation about a dovish stance from the Federal Reserve, strengthening the Euro.
✨ Summary
● Expect a breakout above 1.1795 with targets at 1.1809 and 1.1815.
● Key support at 1.1775, critical for sustaining the bullish momentum.
-------------------
Share your opinion in the comments and support the idea with a like. Thanks for your support!

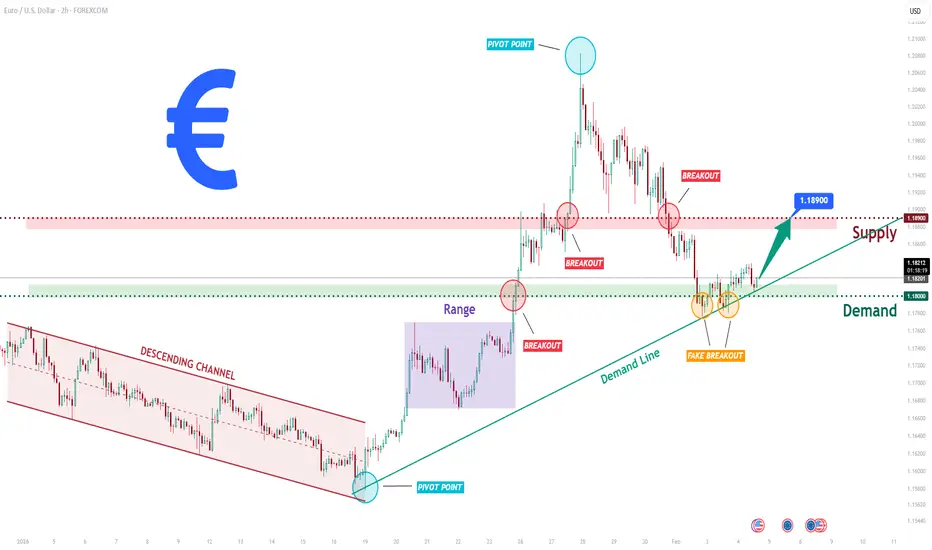
EURUSD Long: Demand Zone Holds - Bulls Preparing Next LegHello traders! Here’s a clear technical breakdown of EURUSD (2H) based on the current chart structure. EURUSD previously traded within a well-defined descending channel, where price consistently respected the descending resistance and support lines, forming a series of lower highs and lower lows. This structure confirmed sustained bearish pressure and orderly downside continuation. The bearish phase eventually reached a key pivot point, where selling momentum weakened and buyers began to step in. Following this pivot, price broke out of the descending channel and transitioned into a ranging phase, indicating temporary balance between buyers and sellers after the trend shift. This range acted as an accumulation zone before the next impulsive move. A clean bullish breakout above the range confirmed renewed buyer control and initiated a strong impulsive rally to the upside.
Currently, EURUSD is pulling back from supply and retesting the Demand Zone around 1.1800, which aligns closely with a rising demand trend line. A brief fake breakout below demand has already occurred, followed by a quick recovery back above the level — a strong sign that sellers failed to gain acceptance below support. This behavior suggests that the current pullback is corrective rather than a full trend reversal.
My primary scenario, as long as EURUSD holds above the 1.1800 Demand Zone and continues to respect the rising demand line, the bullish structure remains intact. A sustained reaction from this area could lead to a renewed upside move, targeting a retest of the 1.1890 Supply Zone (TP1). A clean breakout and acceptance above supply would confirm bullish continuation and open the door for further upside expansion. However, a decisive breakdown and acceptance below the demand zone and trend line would invalidate the bullish scenario and signal a deeper corrective phase. For now, structure, trend, and price behavior continue to favor buyers, with demand acting as the key battlefield. Manage your risk!
EURUSD Break & Retest Setup – Bulls Target 1.1800Strong bullish move from the session low.
Clear higher highs + higher lows forming.
Price now consolidating just under minor resistance near 1.1800–1.1801.
Momentum is steady, not impulsive — looks like controlled accumulation before a push.
🟢 Bullish Scenario
As long as price holds above the 1.1786–1.1790 support zone, structure remains bullish.
That zone aligns with:
Previous breakout area
Intraday demand
Higher-low protection
🎯 Target area: 1.1800 – 1.1801
If buyers break and hold above that, extension toward 1.1810+ becomes realistic.
The triangle/pullback you marked suggests continuation if resistance flips to support.
🔴 Bearish Risk
If price closes below 1.1786, we get:
Structure break
Possible move back toward 1.1775–1.1770
That would invalidate the immediate continuation idea.
📌 Key Insight
This is a break-and-retest style setup.
Best entry logic = buy pullback, not breakout chase into resistance.
💡 Bias
Short-term: Bullish above 1.1786
Invalidation: Clean break below support
Target: 1.1800+

GBP/USD | Going up? (READ THE CAPTION)Last night, GBP Hit the Consequent Encroachment of the FVG, going as low as 1.3509, before making an upwards move now being traded at 1.3575, hitting the Consequent Encroachment of the FVG above. I don't want to see GBPUSD going lower to the Feb 6th NDOG below. Staying in the FVG before going for the FVG High is what I would like to see.
If GBP holds itself, the targets are: 1.3582, 1.3590, 1.3598 and 1.3606.
If it fails: 1.3562, 1.3554, 1.3546 and 1.3540.

EURUSD: Buyers Defend 1.1780 - Upside in Focus 1.1870Hello everyone, here is my breakdown of the current EURUSD setup.
Market Analysis
EURUSD was previously trading within a well-defined downward channel, where price consistently respected the descending resistance and support boundaries, forming a series of lower highs and lower lows. This structure confirmed sustained bearish control and orderly downside continuation. During this phase, several bearish pushes developed smoothly within the channel, highlighting strong seller dominance. After breaking the channel, EURUSD continued higher and successfully reclaimed the Support Zone around 1.1780, which acted as a key decision level. The breakout and subsequent hold above this zone confirmed a change from bearish structure into a bullish recovery phase. Price then accelerated toward the 1.1870 Resistance Zone, where supply became active again, resulting in consolidation and multiple breakout attempts.
Currently, price is trading above the rising trend line, while also forming a descending corrective structure beneath the triangle resistance line. Despite the pullback, the market continues to respect higher lows, suggesting that the recent decline is corrective rather than impulsively bearish. The ability of EURUSD to hold above the support zone keeps the bullish structure intact.
My Scenario & Strategy
My primary scenario favors a long continuation as long as EURUSD holds above the 1.1780 Support Zone and respects the rising trend line. The current consolidation appears to be a corrective pause within a broader bullish structure. A successful break and acceptance above the triangle resistance and the 1.1870 Resistance Zone would likely trigger renewed upside momentum. If buyers manage to reclaim and hold above resistance, the next bullish leg could extend higher, following the direction of the dominant trend.
However, a decisive breakdown below the support zone and trend line would weaken the bullish scenario and signal a potential deeper correction or range formation. For now, structure favors buyers, with pullbacks viewed as opportunities for continuation rather than trend reversal. EURUSD remains at a key technical decision area, and price reaction around support will be critical for the next move.
That’s the setup I’m tracking. Thank you for your attention, and always manage your risk.

Fundamental Market Analysis for February 6, 2026 EURUSDEURUSD:
EUR/USD is hovering around 1.17900 on Friday, February 6, 2026, after the U.S. dollar strengthened notably. Investor caution has increased amid softer equities and higher uncertainty, which supports demand for the U.S. currency.
The Eurozone central bank kept rates unchanged and indicated it remains focused on keeping inflation stable around its target over the medium term. At the same time, January inflation data in the region showed a slowdown to 1.7% year over year, prompting markets to discuss easier financing conditions more actively—an additional headwind for the euro.
Rate expectations still depend heavily on the labor market in the world’s largest economy: some indicators point to cooling, but the key employment report can quickly shift sentiment. If the data proves resilient, the case for keeping rates high strengthens, and EUR/USD may drift lower.
Trading recommendation: SELL 1.17900, SL 1.18200, TP 1.17000

EURUSD Outlook: Bearish Momentum Below 1.1835EUR/USD Technical Analysis
📅 Date: February 4, 2026
💵 Current Price: 1.1815 (Approx.)
📍 Pivot Point: 1.1835
📉 Bearish Scenario (Main Trend)
The price is currently trading below the pivot level of 1.1835. As long as it remains under this zone, the bearish momentum is expected to continue:
Target 1: Support level at 1.1790.
Target 2: If the price breaks 1.1790 and stabilizes below it with a 1-hour or 4-hour candle close, the downtrend will strengthen towards 1.1745.
📈 Bullish Scenario (Alternative Case)
If the price manages to break above the pivot level of 1.1835 and stabilizes:
Target: The trend will shift to bullish, aiming for 1.1900.
📍 Key Technical Levels
Resistance (Upside): 1.1900 | 1.1930
Support (Downside): 1.1790 | 1.1745
💡 Market Sentiment: The EUR/USD pair is facing pressure due to the recent strengthening of the US Dollar, influenced by expectations of a more hawkish Fed policy. Traders should watch for a confirmation close below 1.1790 to confirm the next leg of the sell-off.

AUD/USD | Where to next? (READ THE CAPTION)As you can see, after hitting the Consequent Encroachment of the Feb 2nd's NWOG, AUDUSD went back up from 0.6958 to 0.6990, and then dropped again just above the high of the NWOG, and is now being at 0.6970.
I expect AUDUSD to retest the IFVG, but before that it may fall back to the Feb 2nd NWOG.
If it holds above the NWOG, the targets are: 0.6978, 0.6988, 0.6998 and 0.7008.
If it fails to hold above the NWOG: 0.6966, 0.6958, 0.6950 and 0.6942.

kvmev / EURNZD short entryDouble top and head and shoulders on H4/D time frame.
Break and retest pattern on H4/H1 time frame.

EURUSD 15M – Smart Money Trap Below Support | Buyers Take ControPrice is inside a clear ascending channel → overall bullish structure intact.
Recent move was a pullback to channel support, not a trend break.
The reaction from the lower boundary shows buyers defending aggressively.
🧠 Key Observation (Circle Area)
You’ve marked a liquidity sweep / stop-hunt below support.
After sweeping lows, price printed a strong bullish impulsive candle → classic smart money entry signal.
This confirms fake breakdown → bullish continuation.
📍 Important Levels
Support zone: 1.1780 – 1.1785 (strong demand + channel support)
Entry area: ~1.1788
Invalidation: Below 1.1780 (clean break & close)
Target: 1.1800 🎯 (near-term)
Extended target: 1.1825 – 1.1830 (upper channel)
📈 Trade Bias
Bias: Bullish continuation
Setup: Buy on pullbacks / bullish candle confirmation
RR: Clean and favorable (structure-based)
⚠️ What to Watch
If price accepts below channel support, bullish idea weakens.
A 15M close above 1.1800 opens the door for the next leg up.
🧾 Summary
Liquidity grab + channel support + bullish displacement
➜ High-probability continuation setup
