EURUSD Will Be Fly This EUR/USD 1H chart shows a bullish setup. Price is holding above the support zone, with entry near 1.1670 and stop loss below 1.1630. Targets are set at 1.1692 (TP1), 1.1722 (TP2), and 1.1750 (TP3). The analysis suggests a potential upward move toward these levels.
Eurusdanalysis

Support zone on EURUSDEURUSD is currently in a correction after rising to 1,1730.
Using Fibonacci tools, we identified a support zone between 1,1613 and 1,1552.
Watch for a reaction in this area and a potential continuation of the bullish trend.
The target is a breakout above 1,1830!

EURUSD CorrectionEURUSD climbed to 1,1715, but at the current levels, the risk-to-reward ratio is not favorable for new long positions.
A pullback is possible before the trend resumes.
Key support levels remain at 1,1601 and 1,1520.
The Jackson Hole event could trigger higher volatility.
Don’t rush into buying – wait for market confirmation first.

EURUSD Bears Ready to Take ControlEURUSD( FX:EURUSD ) is currently trading in a Heavy resistance zone($1.1815-$1.1602) and near the Resistance lines and Potential Reversal Zone(PRZ) .
In terms of Elliott Wave theory , it seems that EURUSD has completed a corrective wave. The corrective wave has a Zigzag Correction(ABC/5-3-5) structure .
Also, we can see the Regular Divergence(RD-) between Consecutive Peaks .
I expect EURUSD to decline at least to the Support zone($1.1642-$1.1578) .
Second Target: Monthly Pivot Point = $1.15491
Note: Stop Loss(SL)= $1.1803
Please respect each other's ideas and express them politely if you agree or disagree.
Euro/U.S. Dollar Analyze (EURUSD), 1-hour time frame.
Be sure to follow the updated ideas.
Do not forget to put a Stop loss for your positions (For every position you want to open).
Please follow your strategy and updates; this is just my Idea, and I will gladly see your ideas in this post.
Please do not forget the ✅' like '✅ button 🙏😊 & Share it with your friends; thanks, and Trade safe.

EUR/USD Momentum Builds After Pennant BreakAfter reversing to retest the broken double top neckline and consolidating early last week, the probabilities shifted in favour of an upside continuation.
Following this consolidation under resistance, EUR/USD broke back above, hitting a local high at 1.17 on Tuesday. A pullback followed, forming a clean pennant pattern on the lower timeframes.
The Asian open today brought a decisive breakout above that pennant’s resistance, putting the bias once again to the upside.
Upside target : 1.18 zone
Invalidation: Only if price drops back below 1.16
Disclosure: I am part of TradeNation's Influencer program and receive a monthly fee for using their TradingView charts in my analyses and educational articles.

EURUSD | Eyes on the 50EMA — One Bold Candle and I’m All InThe 1-hour chart has carved a beautiful bullish range from 1.1565 to 1.1696. A little 15-minute pullback tried to test our love, but I’ve got all the signs — the retracement is over, and the ride is calling again.
WHAT TO DO
Just one confident Marubozu closing above the 50EMA, and I’m jumping in — no hesitation, no second thoughts. Let’s ride this story back to the top.
TP1: 1.1696 (where the heart first skipped)
TP2: 1.1716 (where dreams begin)
SL: If that candle speaks loud and clear, my stop loss will be just below it — because love deserves a little risk, but never recklessness.
WHAT IF IT WONT CROSS?
This is day trading setup. While watching 15m candle to bear below 50EMA also I glance 1hr chart. This setup will be valid as long as 1hr chart is still in bearing range.
Wish me luck — this might just be the ride of the day! 💞📈

EUR/USD Rises 2.3% Since the Beginning of AugustEUR/USD Rises 2.3% Since the Beginning of August
As the EUR/USD chart shows today, the euro has strengthened against the US dollar, climbing above the 1.1670 level, compared to the 1.1400 area at the beginning of the month.
Why Is EUR/USD Rising?
According to Reuters, the US dollar's weakness is being driven by:
→ Expectations of a Federal Reserve rate cut, which intensified following last week's disappointing US labour market data.
→ Anticipation of the upcoming US inflation report, scheduled for release on 12 August at 15:30 GMT+3.
On the other hand, the euro is being supported by growing optimism around a possible resolution of the military conflict in Ukraine, as well as the potential meeting between Donald Trump and Vladimir Putin.
Technical Analysis of the EUR/USD Chart
On 30 July, we noted that after hitting its July low, EUR/USD could stage a recovery — which indeed materialised. But does the chart now look bullish?
A definitive bullish outlook is hindered by the sequence of lower highs and lower lows (A-B-C-D), which continues to form a bearish market structure.
At the same time, the descending channel on the EUR/USD chart has become more pronounced. After a brief period of consolidation near the channel’s median line (marked with a circle), the price moved up towards the upper boundary of the channel. It is worth noting that a sharp decline occurred recently from these same levels (highlighted with an arrow), breaking through the blue support line.
Given these factors, it is reasonable to assume that bearish activity may intensify around current levels, potentially slowing further EUR/USD growth.
This article represents the opinion of the Companies operating under the FXOpen brand only. It is not to be construed as an offer, solicitation, or recommendation with respect to products and services provided by the Companies operating under the FXOpen brand, nor is it to be considered financial advice.

EURUSD possible bearish for 1.1200#eurusd forming lower high and lower low in daily time frame. Price broke 1.1557 & 1.1447 support level. 1.1738-1788 daily supply zone for sell. there are many different support levels before 1.1200 level i.e. 1.1550, 1.1420, 1.1255 & 1.1200. 1.1430-20 is secure level to book profit in sell trade.

DeGRAM | EURUSD returned to the channel📊 Technical Analysis
● EURUSD broke above the descending channel resistance and reclaimed the 1.1567 level, signaling a potential reversal after defending 1.1446 support.
● The price is forming a bullish sequence of higher lows, and a breakout above 1.1592 could open the path toward the 1.1765 resistance zone.
💡 Fundamental Analysis
● A weaker-than-expected US ISM Services report triggered USD selling, while hawkish ECB remarks from Nagel supported euro recovery.
● Markets are pricing in fewer Fed hikes as job data cools, reducing dollar appeal and favoring EUR upside.
✨ Summary
Long bias above 1.1446. Breakout targets 1.1592 ➜ 1.1765. Setup valid while structure holds above prior resistance-turned-support.
-------------------
Share your opinion in the comments and support the idea with a like. Thanks for your support!

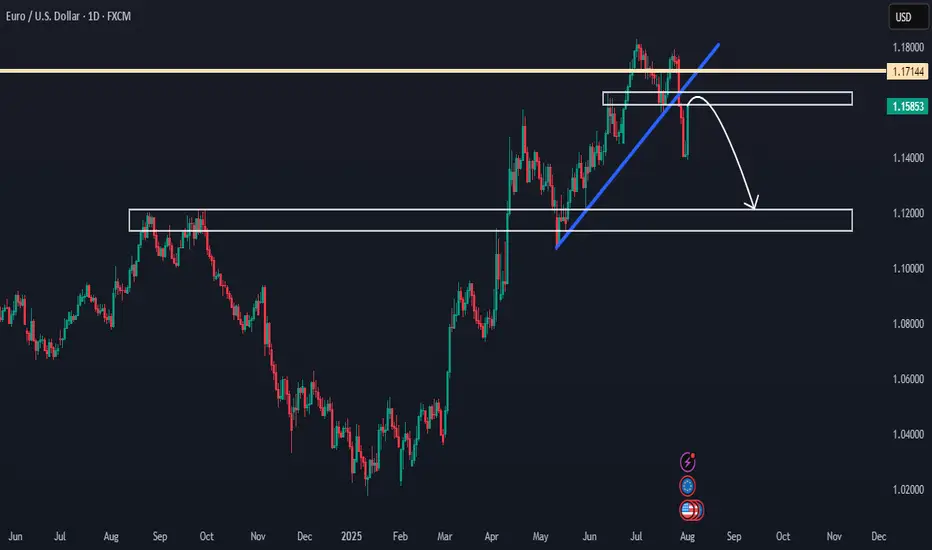
EURUSD Showing Reversal Signs After 7-Month Bullish TrendHello everybody!
After holding bullish momentum for a long time (7 months), EURUSD is starting to show signs of reversal:
1. It has been rejected from a strong resistance area.
2. It broke a support area, which is now expected to act as resistance.
3. It broke a solid upward trendline with a strong downward move.
If this area holds and price doesn't go above 1.18000, we can look to sell from here.
In that case, the most likely target will be around 1.12000.
Manage your risk and trade safe!
Buying opportunities on EURUSDEURUSD is currently in an uptrend.
Following Friday’s news, we saw a bounce and a higher low.
The target is a retest and breakout above the previous highs around 1,1800.
The exact entry point can be identified on the lower timeframes after a reaction.
This idea becomes invalid if the price drops below 1.1388!

EUR/USD Breaks Daily Lows as Consolidation DeepensFenzoFx—EUR/USD consolidates after the impulsive bullish momentum. The uptrend initiated after the price swept below the monthly lows at $1.1400. In the current trading session, the price dipped below the previous day's low, meaning the consolidation period will likely extend to a lower support level.
The immediate resistance is at the previous day's high, the $1.159 resistance. From a technical perspective, we expect the currency pair to trade lower, near the support at $1.146, the bullish break of structure.
This level can provide a discounted price to join the dominant trend, which is bullish. We expect the Euro to rise toward $1.169 after the end of the consolidation period.

EURUSD SELLEUR/USD appears offered around 1.1550
After failing to break above the 1.1600 barrier, EUR/USD is currently under renewed selling pressure and is testing the mid-1.1500s again on Monday. The US Dollar, on the other hand, rises slightly across the board as investors absorb Friday's big drop after the US employment data and turn their focus to trade.
The daily chart for the EUR/USD pair shows the pair met buyers just ahead of a bullish 100 Simple Moving Average (SMA) currently at around 1.1370. A flat 20 SMA, in the meantime, provides resistance at around 1.1640, the level to overcome to turn bullish. Finally, technical indicators corrected oversold conditions, but lost their upward strength just below their midlines, suggesting buyers are still on the sidelines.
In the 4-hour chart, the EUR/USD pair is range-bound, although there are no signs of a potential slide. The 20 SMA lost its bearish strength and turned flat in the 1.1480 area, while technical indicators remain directionless well above their midlines. The pair flirted with the 1.1600 level during Asian trading hours, with gains beyond the level turning the risk towards the upside in the near term.
SUPPORT 1.15387
SUPPORT 1.14950
SUPPORT 1.14520
RESISTANCE 1.16032
RESISTANCE 1.15832

EURUSD: Eu Looking to Make Gains Vs Weakened USDWelcome back to the Weekly Forex Forecast for the week of Aug 4 - 8th.
In this video, we will analyze the following FX market:
EURUSD
The USD pushed higher on keeping it's interest rate unchanged, but gave back those gains on weak job numbers. This allowed the EU to recover some of the previous weeks losses and show some resiliency.
Now analyst are betting there is a 66% chance for rate cuts in Sept by the Fed. This is negative for the USD, allowing the EURO to move higher.
It is worth mentioning, the EU inked a highly criticized tariff deal with the US, which was not at all positive for the currency.
The market is at a pivotal area that could go either way. Wait for a definitive break of structure before committing to a bias.
Enjoy!
May profits be upon you.
Leave any questions or comments in the comment section.
I appreciate any feedback from my viewers!
Like and/or subscribe if you want more accurate analysis.
Thank you so much!
Disclaimer:
I do not provide personal investment advice and I am not a qualified licensed investment advisor.
All information found here, including any ideas, opinions, views, predictions, forecasts, commentaries, suggestions, expressed or implied herein, are for informational, entertainment or educational purposes only and should not be construed as personal investment advice. While the information provided is believed to be accurate, it may include errors or inaccuracies.
I will not and cannot be held liable for any actions you take as a result of anything you read here.
Conduct your own due diligence, or consult a licensed financial advisor or broker before making any and all investment decisions. Any investments, trades, speculations, or decisions made on the basis of any information found on this channel, expressed or implied herein, are committed at your own risk, financial or otherwise.

EUR/USD Elliott Wave Count Signals Downside TargetsThe EUR/USD chart is displaying a completed 5-wave Elliott impulse structure, suggesting the potential start of a larger corrective move to the downside. Wave 5 appears to have finished after a classic ending diagonal pattern, with price now breaking below the wave 4 support trendline — a strong confirmation of trend exhaustion.
Currently, price is retracing upward towards the 0.5–0.618 Fibonacci retracement zone of the last impulsive leg, around 1.15912–1.16383, which may serve as the final rejection zone for bears to re-enter. This area aligns perfectly with prior support-turned-resistance and is considered the potential reversal pocket.
If price holds below the 1.17869 invalidation level, the structure supports the beginning of an ABC correction or a larger bearish impulse.
Target 1 (T1): 1.14800
Target 2 (T2): 1.13915
Stop Loss (SL): 1.17869
This scenario remains valid as long as the price does not break above 1.17869. A clean break and close above this level would invalidate the bearish setup and suggest a possible wave extension.

EUR/USD Setup Is Ready This is a bullish EUR/USD (Euro/US Dollar) 1-hour chart analysis. The setup indicates a potential upward reversal after a downtrend, supported by a series of higher lows.
Key elements:
Entry Point: Around 1.14044–1.14376.
Stop Loss: Placed below the recent low at 1.12770 to manage risk.
Targets:
First Target: 1.15034
Second Target: 1.15892
Third Target: 1.17238
The chart suggests a buy setup with a risk-reward strategy, aiming for a breakout and continuation towards higher resistance levels. The large upward arrow emphasizes bullish momentum expectations.

DeGRAM | EURUSD dropped below the support level📊 Technical Analysis
● EURUSD confirmed a double rejection below long-term resistance with two lower highs and broke channel support at 1.1567.
● Price is now trending within a descending channel toward 1.1363, with lower targets pointing into the 1.12–1.11 demand zone.
💡 Fundamental Analysis
● US Q2 GDP surprised to the upside, reinforcing the Fed’s hawkish tone, while Eurozone CPI inflation cooled below forecast.
● Diverging central bank trajectories continue to widen yield differentials in favor of the dollar, sustaining bearish euro flows.
✨ Summary
Short bias confirmed below 1.1567. Break of 1.1450 opens path to 1.1363 ➜ 1.1200 zone. Watch for rallies to fade below trendline.
-------------------
Share your opinion in the comments and support the idea with a like. Thanks for your support!

Closed Longs, Now Selling Rallies on EURUSD ReversalAs mentioned in my previous posts, I’m been bullish on EURUSD in the medium term, targeting 1.20 and even beyond.
But no pair—especially not EURUSD, which tends to move more steadily and rationally—goes up in a straight line.
________________________________________
🔹 Last week, the pair stalled just below 1.18, and I decided to close my long trade with a +150 pip gain. That proved to be a wise call, as price dropped hard shortly after.
________________________________________
📉 What’s happening now?
• EURUSD has broken below the rising trendline
• More importantly, it’s broken below the neckline of a double top pattern
• Now trading around 1.1535
This opens the door for a deeper correction, and I expect we could see a test of the 1.1150–1.1100 zone by the end of summer.
________________________________________
📌 Trading Plan:
• I’m now in sell-the-rally mode
• Ideal short entry: around 1.1650, where we also get a favorable 1:3+ risk-reward
• Watch also for interim support around 1.1400
________________________________________
Conclusion:
The bigger picture remains bullish— but this correction looks healthy and isn’t done yet.
Selling rallies makes more sense now, until the structure tells us otherwise.
Disclosure: I am part of TradeNation's Influencer program and receive a monthly fee for using their TradingView charts in my analyses and educational articles.

EURUSD 4H AnalysisAfter a strong bearish move, EURUSD has now tapped into the PD Low and shown a reaction. Structure remains bearish, but current price action near 1.1400 could lead to short-term retracement.
🔍 Key Levels:
PD High – 1.1560: Strong supply zone, key bearish continuation level
1.1500–1.1450: Broken support, may now act as resistance
PD Low – 1.1400: Demand zone, current price reacting from here
📌 Potential Scenarios:
Short-Term Bounce from PD Low:
Price reacting from 1.1400 demand.
Intraday retracement toward 1.1470–1.1500 possible.
Watch for bullish price action confirmation on lower timeframes.
Bearish Continuation if price retests 1.1500–1.1550:
Ideal area to look for fresh shorts.
Continuation move could target 1.1350 or lower.
🎯 Bias: Still bearish unless we break and hold above 1.1560 (PD High).
Patience is key. Let price test zone and wait for clear reaction before committing.

DeGRAM | EURUSD reached the lower boundary of the channel📊 Technical Analysis
● Price sliced through the channel mid-support and the inner trend-fan, closing below 1.1573; the break was retested (grey circle) and rejected, confirming a bear continuation from the sequence of lower-highs.
● The move unlocks the descending channel’s lower rail near 1.1450, while interim demand sits at the May pivot / 0.618 swing 1.1520.
💡 Fundamental Analysis
● EZ data underwhelmed (German Ifo, EZ consumer-confidence) just as Fed officials warned rates may stay “restrictive for longer,” widening the short-rate gap and refreshing USD bids.
✨ Summary
Short 1.1590-1.1615; hold below 1.1573 targets 1.1520 ➜ 1.1450. Bias void on an H1 close above 1.1660.
-------------------
Share your opinion in the comments and support the idea with a like. Thanks for your support!

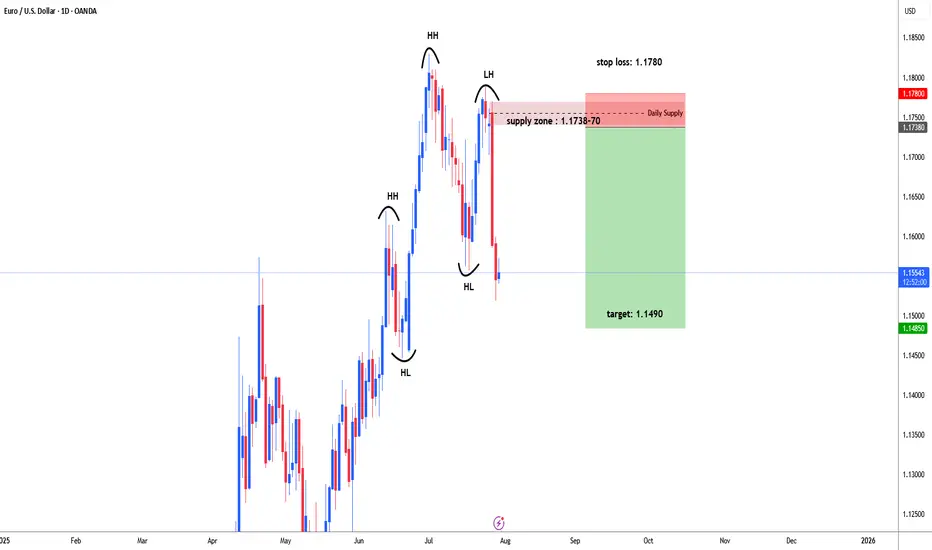
EURUSD possible bearish for 1.1490#EURUSD failed to form higher high and higher low to continue bullish trend. eurusd made a high on 1st July 1.1830, then price started retrace downside. 7th July daily bearish engulfing candle formed , early indication for selling. 23rd July price moved up side to test supply zone. Price did not break high of bearish engulfing candle and fall back. Price started heavily fall and broke recent supply level 1.1557 and form Lower High that is indication for trend reversal.
1.1738-70 ideal level for selling which is daily supply zone. stop loss above 1.1770 i.e. 1780-1.1800. target: 1.1490 and even may expect further down.
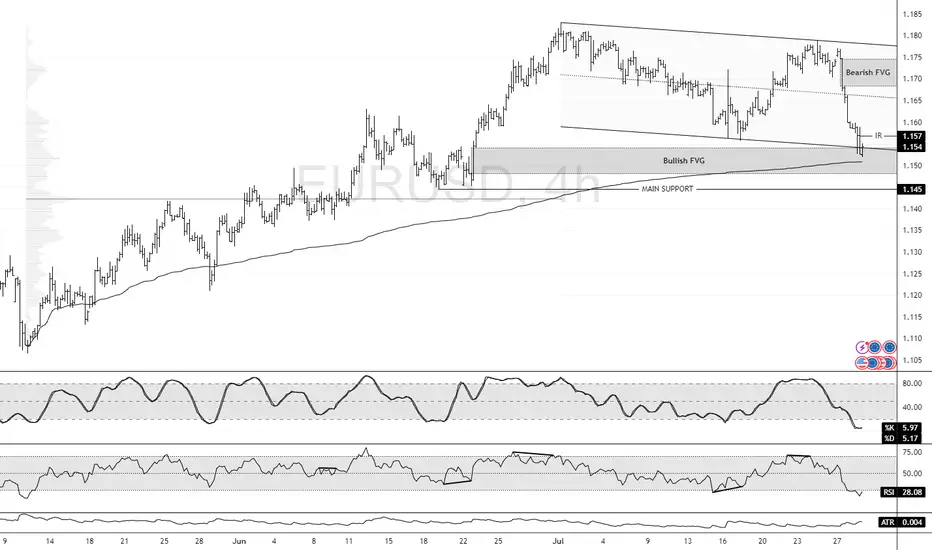
EUR/USD at Discount Level: Bullish Setup in FocusFenzoFx—EUR/USD bearish momentum extended to $1.154, the lower line of the flag. This is a support area backed by the Bullish FVG.
The immediate resistance is at $1.157. From a technical perspective, a close above this level can trigger an uptrend, targeting the bearish FVG at approximately $1.170 to $1.175.
Please note that the bullish outlook should be invalidated if EUR/USD falls below the main support level at $1.145.
EURUSD BUYEUR/USD retreats below 1.1550 ahead of US data
EUR/USD finds it difficult to stage a rebound following Monday's sharp decline and trades in negative territory below 1.1550 on Tuesday. The US Dollar (USD) preserves its strength ahead of consumer sentiment and employment-related data releases, weighing on the pair.
From a technical point of view, the EUR/USD pair is poised to extend its slump. It keeps falling below a mildly bearish 20 Simple Moving Average (SMA), which provides dynamic resistance at around 1.1690. The 100 SMA, in the meantime, maintains its bullish slope, albeit partially losing its upward strength at around 1.1340. Finally, technical indicators keep heading south well below their midlines, and at multi-week lows, in line with a bearish extension ahead.
The near-term picture shows EUR/USD is oversold and may bounce or consolidate before the next directional move. In the 4-hour chart, technical indicators turned flat at extreme levels, yet it keeps developing below all its moving averages, which skews the risk to the downside. A firmly bearish 20 SMA is crossing below the 100 SMA and aims to extend its slide below a directionless 200 SMA, usually a sign of prevalent selling interest.
SUPPORT 1.15566
SUPPORT 1.15819
SUPPORT 1.15566
RESISTANCE 1.15114
