EURUSD → Drop to 1.05? or Blast to 1.10? Lets Make it Clear.EURUSD is pushing toward the resistance zone which gives the bulls some tingly senses to take profit and run the price back to the downside. Will the Dollar show strength this week and keep EURUSD from breaking resistance?
How do we trade this?
The price is currently in a trading range between 1.05000 and 1.10000 and we're getting close to the resistance zone where the Weekly 200EMA resides. If you're not already in a trade, it's worth waiting to see what happens at the resistance zone. A bear signal bar closing on or near its low below the resistance line is a good indicator that the price will fail to rise above again and would be a reasonable short. Stop loss above the resistance zone top and take profit just above the Support Zone around 1.05000. The RSI is near 70.00, a weak indicator on its own, but supports the rest of the analysis for a soon-to-come short.
If the price finds its way above the resistance lines and closes a bull candle on or near its high, it would be reasonable to long with a protective stop just below the resistance zone. Target prices as high as 1.12500.
Key Takeaways
1. Trading Range after Bull Run, Bias to Long.
2. Near the Resistance Zone, Look for a Reversal Signal.
3. If Shorting, Watch the 200EMA for Support.
4. The Dollar Index may fall more, wait for the bottom.
5. RSI near 70.00, Bias to Short.
You are solely responsible for your trades, trade at your own risk!
If you found this analysis helpful, click the Boost button and let us know what you think in the comment section below!
Eurusdbearish

EURUSD AnalysisDollar currency Index (DXY) is getting stronger on daily bases and it journey is still continue. According to the EURUSD chart analysis, EURUSD is in pressure and following it breakout levels. Better to look selling opportunity on it.

EURUSD H1: Bearish outlook seen, further downside below 1.0760On the 1H timeframe, there is bearish order flow, with lower highs and lower lows being formed. A pullback to the resistance zone at 1.0820, which coincides with the 78.6% Fibonacci retracement, could provide the bearish acceleration towards the support zone at 1.0760. Price is holding below ichimoku clouds and MACD is showing bearish momentum, supporting our bearish bias.


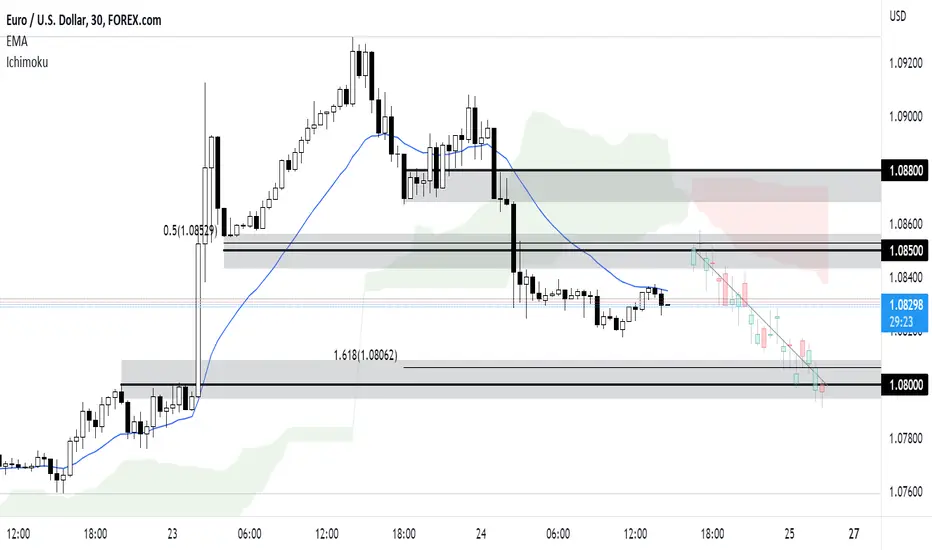
Bearish outlook on EURUSD - 24 March 2023Prices are testing a key resistance zone at 1.0850 on the M30 timeframe. A pullback to this zone, which coincides with the 50% Fibonacci retracement, could present the opportunity to ride the drop to the support zone at 1.0800, which is in line with the 161.8% Fibonacci extension. Price is holding below the 20 EMA and Ichimoku cloud, supporting our bearish bias.
EURUSD M30: Bearish outlook seen, further downside below 1.0720On the M30 timeframe, prices are testing a key resistance zone at 1.0720. Failure to break above the resistance zone could see price drop to the support zone at 1.0680, in line with the 61.8% Fibonacci retracement. MACD is showing bearish momentum, supporting our bearish bias.

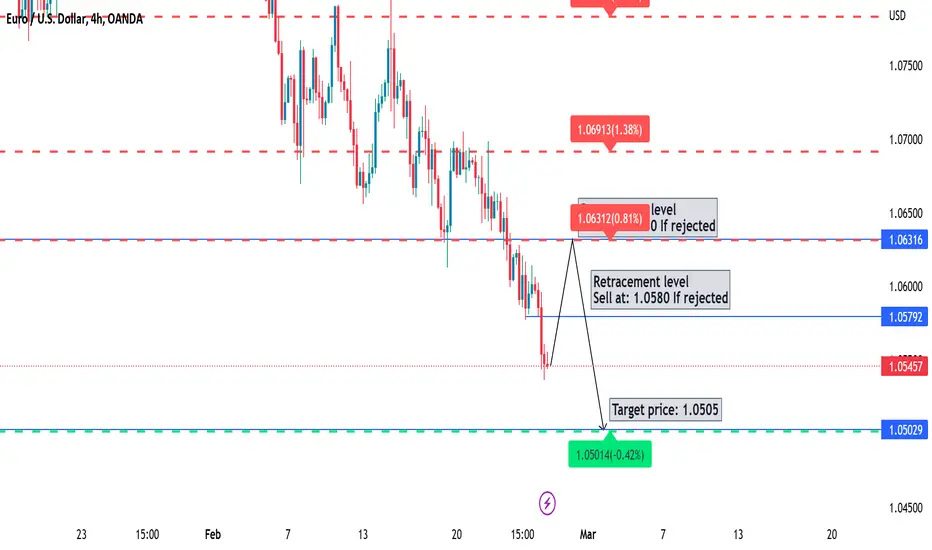
EURUSD H4: Bearish outlook seen, further downside below 1.0620On the H4 timeframe, prices are showing bearish order flow with lower lows and lower highs formed. A pullback to the resistance zone at 1.0620 could present an opportunity to play the drop to the next support zone at 1.0500, in line with the graphical low and 50% Fibonacci extension. Prices are holding below the Ichimoku cloud and 50 EMA, while Stochastic RSI is in the overbought region above 80, supporting our bearish bias.

EURUSD SellDXY is strong against the EURO. I think EURUSD will rise little bit more and will go to resistance, sell only if you got a rejection otherwise dont trade.
EURUSD SellEURUS will if it rejected from the supply zone. Wait for the rejection then put sell trade on it.

EURUSD - THE BIG SHORT Eurusd - H4 - This pair went on a liquidity and stop hunt since the start of this year breaking monthly key levels. Now price has reversed on H4 and same time dollar index still holding its monthly demand zone so I'm expecting a complete reversal on Eurusd price action to heavy bearish from here on.. long term targets 0.90- 0.8500

Bearish outlook on EURUSD: 10th JanuaryOn the H4 timeframe, prices are ranging between 1.0750 and 1.0720, above the resistance-turned-support zone of 1.0620, in line with the 50% Fibonacci retracement. A break below the downside confirmation level could provide the bearish acceleration for a further throwback to the support zone at 1.0620.

EURUSD Bearish FlagThe EURUSD is near to give breakout it's Bearish Flag Pattern. But wait for the breakout and the closing below the trendline then take selling opportunity on it.

EURUSD SellThe market of EURUSD is on Supply zone and it is falling from it. There is some chances that EURUSD may rise little bit then fall. But keep an eye on Dollar index. If DXY rise then look selling opportunity on EURUSD.

EUR/USD dailyThe price for EUR/USD has been been in a downtrend, we expect it to continue further. The price has not pushed above the 200 day EMA. Furthermore, Aroon and Ichimoku indicators currently indicate a further downtrend, too.
target: 1.03550
entry: 1.05916

EURUSD seems BearishAs we all knows that US Dollar Currency Index is getting stronger as America again considering to increase the interest rate. If it happened then we can see more fall in EURUSD.


EURUSD: Bearish Fakey Setup | 13-2-2022 EURUSD: Bearish Fakey Setup
Price Action: Price sold off from the recent Bearish Fakey Setup that had formed just under the 1.1482 – 1.1523 key resistance area, late last week (We suggested selling from this setup in the February 11th Newsletter).
The recent Potential Bullish Fakey Setup, failed (We did not consider trading this setup and hopefully saved some members on this market. We preferred to wait for a sell signal last week).
Potential Trade Idea: We are now considering selling if price pulls back to the recent Bearish Fakey Setup breakdown area, whilst price remains under the 1.1482 – 1.1523 key resistance area.

EURUSD is in Bearish ModeThe EURUSD market made a pin bar on Friday and now making sell candles. If today's candle closed strongly in bearish mode then we will see more selling pressure.

EURUSD a clean pictureDXY is showing strength and QE, Tapering, and rising of Interest rate to coverup inflation all tools will make Dollar strong in coming time. Possible EURUSD will drop to 1.12 area.

EURUSD is in Bearish ModeOn Friday the Bearish Engulf candle has formed on EURUSD which indicates us for further falling from Monday. As we discussed already that DXY is strong now which can lead to more upside.

EURUSD is on it's Major ResistanceFollow the chart and don't forget to follow me for perfect trades.

EURUSD SHORTLooking for a continuation short. I believe a hidden bearish divergence has formed on the hourly. The price has pulled back to the 38% level after the recent decline. I will take a short position here-ish.
Good luck !!

EURUSD SHORTA re-entry trade for me. Looking for a long term sell on this pair. Price at key level on weekly.
