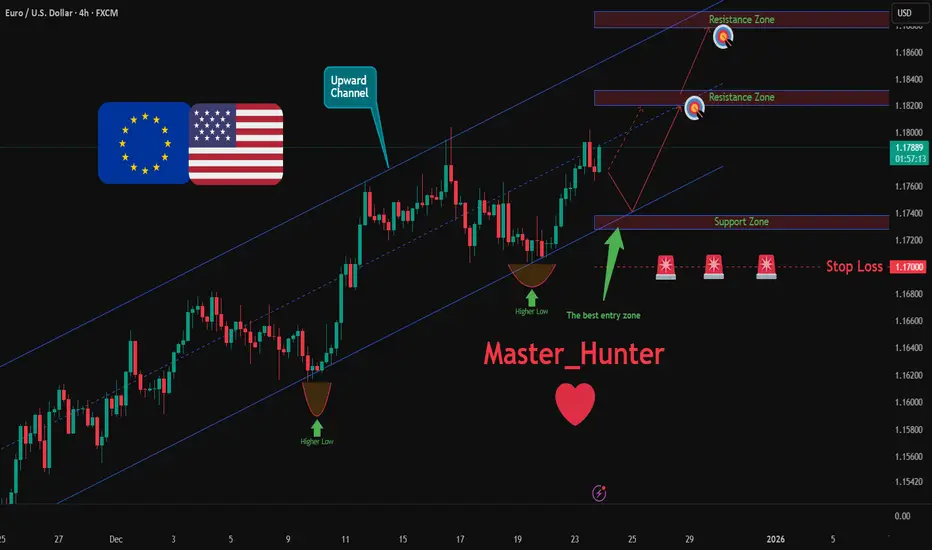
EURUSD: Bullish Push to 1.1878?As the previous analysis worked exactly as predicted, FX:EURUSD is eyeing a bullish breakout on the 4-hour chart , with price rebounding from higher lows in an upward channel after a breakout candle, converging with a potential entry zone that could ignite upside momentum if buyers push through short-term resistance amid recent volatility. This setup suggests a continuation opportunity in the uptrend, targeting higher levels with overall risk-reward exceeding 1:3.5 .🔥
Entry between 1.1728–1.1738 for a long position. Targets at 1.1820 (first), 1.1878 (second). Set a stop loss at a daily close below 1.1700 , yielding a risk-reward ratio of more than 1:3.5 in total . Monitor for confirmation via a bullish candle close above entry with rising volume, leveraging the pair's momentum in the channel.🌟
Fundamentally , EURUSD is trading around 1.178 in late December 2025, with key US Dollar events this week potentially weakening USD if data underperforms, favoring euro strength. For the US Dollar, Tuesday, December 23 at 05:30 AM UTC brings GDP Growth Rate QoQ Q3 (forecast 3.3%, previous 4.3%), Core PCE Prices QoQ Q3 (forecast 2.9%, previous 2.9%), PCE Prices QoQ Q3 (forecast 2.8%, previous 2.8%), and Real Consumer Spending QoQ Q3 (previous 3.5%); followed by CB Consumer Confidence DEC at 07:00 AM UTC (forecast 91, previous 89.1). No major high-impact events for the Euro this week, leaving the pair sensitive to USD catalysts. 💡
📝 Trade Setup
🎯 Entry (Long):
1.1728 – 1.1738
(Entry at these levels is valid with proper risk & capital management.)
🎯 Targets:
• 1.1820 (TP1)
• 1.1878 (TP2)
❌ Stop Loss:
• Daily close below 1.1700
⚖️ Risk-to-Reward:
• > 1:3.5 (total)
💡 Your view?
Does EURUSD defend the channel and push toward 1.1878 — or do we see deeper consolidation before continuation? 👇
Eurusdprediction
Is EUR/USD Entering a Bullish Continuation Phase?📌 EUR/USD – “THE FIBRE”
💱 Forex Market Trade Opportunity Guide
(Swing Trade | Day Trade)
🔵 Market Bias
🟢 BULLISH STRUCTURE CONFIRMED
Price action aligns with trend continuation mechanics, supported by multi-indicator confluence and momentum expansion.
🧠 Trade Plan – Technical Confluence
✔️ Triangular Moving Average BREAKOUT
✔️ Hull Moving Average Pullback & Retest (dynamic support confirmation)
✔️ CCI Oscillator Golden Cross (momentum acceleration signal)
📊 This setup reflects trend resumption after healthy retracement, often favored by smart money continuation models.
🎯 Entry Strategy
🟢 YOU CAN ENTER AT ANY PRICE LEVEL
🔹 Traders may scale in using price acceptance above dynamic averages
🔹 Suitable for layered entries based on individual risk frameworks
🛑 Risk Management
🔴 Stop Loss (Reference Level): 1.16500
⚠️ Dear Ladies & Gentlemen (Thief OG’s)
Risk parameters must always be adjusted based on your own strategy, capital, and exposure model.
This level is not mandatory.
🏁 Profit Zone / Exit Logic
🎯 Primary Target: 1.18500
🚓 Police force zone acting as:
Strong historical resistance
Overbought price area
Liquidity trap potential
High probability reaction / correction zone
➡️ Protect profits aggressively near this zone.
⚠️ Dear Ladies & Gentlemen (Thief OG’s)
TP levels are guidelines, not financial advice. Partial profits are encouraged.
🔗 Related Pairs to Watch (Correlation & Confirmation)
💵 USD-Driven Correlation
TVC:DXY (US Dollar Index)
🔻 Weakness in DXY generally supports EUR/USD upside
🔺 Any sharp DXY reversal may cap EUR/USD gains
💶 EUR Strength Basket
OANDA:EURJPY
📈 Bullish momentum confirms EUR strength vs safe-haven JPY
OANDA:EURGBP
🔄 Range behavior here helps identify relative EUR demand
OANDA:EURCHF
🧭 Stability above key levels supports risk-on EUR flows
💷 Cross-Market Confirmation
FX:GBPUSD
✔️ Parallel bullish structure adds USD weakness confirmation
OANDA:USDCHF
🔻 Bearish bias here often aligns with EUR/USD bullish continuation
🧩 Key Insight
📌 When EUR pairs show synchronized strength and USD pairs weaken,
➡️ EUR/USD continuation probability increases significantly.
🏁 Final Note
This setup is built on trend alignment, momentum confirmation, and structured risk logic.
Discipline, patience, and execution consistency are what turn setups into profits.
📈 Trade smart. Manage risk. Protect capital.

EUR/USD 4H Technical OutlookEUR/USD is currently trading in a clear bullish structure, supported by a rising trendline that has held price since the early December lows. The market has been printing higher highs and higher lows, confirming buyers remain in control.
Price recently broke above a prior resistance zone (marked with XXX), turning it into a key support area. The current consolidation above this level suggests healthy bullish continuation, rather than weakness.
The projected path shows a potential pullback toward the ascending trendline, which would offer a higher-low entry opportunity if buyers step in. From there, price is expected to resume its upward move, targeting the next resistance zone and ultimately the major high / highest target around 1.1918, which aligns with previous market structure resistance.
As long as price respects the rising trendline and holds above the broken resistance, the bullish bias remains intact. A clean break below the trendline would be the first warning sign of momentum loss.

EURUSD: Bearish Drop to 1.168?As the previous analysis worked exactly as predicted, FX:EURUSD is eyeing a bearish pullback on the 4-hour chart , with price testing resistance after forming higher lows along an upward trendline and a breakout candle, converging with a potential rejection area that could spark downside momentum if sellers defend amid recent gains. This setup hints at a correction opportunity in the uptrend, targeting lower support levels with risk-reward exceeding 1:2.
Entry between 1.1786–1.1800 for a short position. Target at 1.1682 . Set a stop loss at a daily close above 1.1830 , yielding a risk-reward ratio of more than 1:2 . Monitor for confirmation via a bearish candle close below entry with rising volume, leveraging potential reversal at resistance.🌟
Fundamentally , EURUSD faces key volatility this week with high-impact events on both sides. For the Euro, the ECB Interest Rate Decision on December 18 at 13:15 UTC (previous deposit rate 2.00%) could influence euro strength amid inflation and recession risks, followed by the ECB Press Conference at 13:45 UTC for policy insights that may cause sharp moves. For the USD, the US CPI release on December 18 at 13:30 UTC (previous YoY +3.1%) is a critical inflation gauge that could strengthen the dollar on hot readings or weaken it on cooler ones; additionally, the US Core PCE Price Index on December 19 at 15:00 UTC (previous YoY +2.9%) serves as the Fed's preferred inflation measure, impacting rate expectations. 💡
📝 Trade Setup
🎯 Entry (Short):
1.1786 – 1.1800
(Short entries in this zone are valid with disciplined risk & position sizing.)
🎯 Target:
• 1.1682
❌ Stop Loss:
• Daily close above 1.1830
⚖️ Risk-to-Reward:
• > 1:2
💡 Your view?
Is this the start of a healthy correction toward 1.1682 — or will EURUSD absorb supply and continue its bullish expansion? 👇

EURUSD H1 – Institutional Volume Zones & Reversal Setup📊 EURUSD – H1 Market Structure & Volume-Based Reversal Analysis
🔍 Technical Analysis
EURUSD on the 1-hour timeframe shows a corrective phase after a prior bearish move. Price previously experienced aggressive selling pressure, followed by consolidation and a gradual recovery. The chart highlights key volume reaction zones that are now playing a decisive role in short-term direction.
📉 Previous Price Action
The left side of the chart shows strong bearish momentum, characterized by long red candles and impulsive downside moves.
This selling phase ended with capitulation-style candles, indicating exhaustion of sellers.
After the sell-off, price transitioned into a range-bound structure, forming higher lows and absorbing liquidity.
🟩 Demand Zone & Volume Burst (Lower Area)
The lower green zone represents a high-volume demand area.
Multiple rejections from this zone confirm institutional buying interest.
Volume bursts at this level indicate absorption of sell orders, often seen before a directional move.
This zone acted as a base for the current bullish push, validating it as a strong short-term support.
📈 Bullish Reaction & Structural Shift
Price broke above internal consolidation highs, signaling a short-term bullish structure shift.
Higher highs and higher lows suggest buyers are currently in control.
The bullish candles show improving momentum, but price is now approaching a critical area.
🟥 Supply / Reversal Zone (Upper Area)
The upper marked zone is a potential reversal and supply area, aligned with:
Previous price imbalance
Prior rejection zone
Expected volume expansion (Volume Burst)
This area is likely to attract profit-taking and fresh sell orders.
The highlighted circle marks a reaction point, where price may show:
Rejection wicks
Slowing momentum
Bearish candle formations
🔄 Expected Scenarios
Scenario 1 – Bearish Rejection (High Probability):
If price shows rejection within the upper zone, a pullback toward the demand zone is likely.
This would be a healthy retracement within the current structure.
Scenario 2 – Bullish Continuation:
A strong break and close above the reversal zone with volume would invalidate the short-term sell bias.
This could open the door for trend continuation toward higher liquidity levels.
🧠 Trading Insight
Avoid chasing price inside premium areas.
Best opportunities come from reaction, not prediction.
Watch for volume behavior and candle confirmation at the highlighted zones.
📌 Key Levels to Watch
Support: Lower Volume Burst / Demand Zone
Resistance: Upper Reversal & Volume Expansion Zone
Bias: Neutral to bearish at resistance, bullish only on clean breakout
💬 Always wait for confirmation. Volume + structure gives clarity, not indicators alone.

EURUSD ... time to buyEURUSD was in a recent downtrend for the last few weeks and struggled to stay bullish, but recently it has just broken a strong resistance trend line which it tested several times and failed to break through. EURUSD is very likely to hit the next major resistance zone which is market as the "TAKE PROFIT" LEVEL. There are many clear signs of new bullish movements. time to Buy EURUSD...

EURUSD(20251224) Today's AnalysisMarket News:
The US economy expanded at a rate of 4.3% in the third quarter, the fastest growth in two years, but the US consumer confidence index declined for the fifth consecutive month.
ADP Weekly Employment Report: In the four weeks ending December 6, 2025, private sector employers added an average of 11,500 jobs per week.
Trump: Those who disagree with him will never become Fed Chair. Next Fed candidate Hassett: Predicts monthly job growth may return to 100,000+, and the Fed is far behind the times on interest rate cuts.
Technical Analysis:
Today's Buy/Sell Threshold:
1.1783
Support and Resistance Levels:
1.1828
1.1811
1.1800
1.1766
1.1755
1.1738
Trading Strategy:
If it breaks above 1.1800, consider buying, with a first target price of 1.1828.
If it breaks below 1.1783, consider selling, with a first target price of 1.1766.

EURUSD Technical Analysis and Trade IdeaI’m currently keeping a close eye on EURUSD, which has been trading in a strong bullish trend. Price pushed higher with solid momentum during the Asian session, showing clear strength from buyers 📈.
That said, price is starting to look overextended, so a pullback or retracement during the London session would not be a surprise. This would be healthy price action within an overall uptrend and something worth watching closely 👀.
Later today, during the New York session, we have the Prelim GDP data release, which is a high-impact news event ⚠️. This data could inject volatility into the market.
If the GDP numbers come out negative for the US dollar, I’ll be looking for buy opportunities on EURUSD, aligning with the higher-timeframe bullish bias and waiting for price to show confirmation after the news 🟢.
As always, patience is key—let the market show its hand before committing to a trade.
Not financial advice.

EURUSD – 30M Liquidity, QFL & Bullish Reversal Zone AnalysisEURUSD – 30M Liquidity, QFL & Reversal Zone Analysis
This 30-minute EURUSD chart presents a classic smart money setup, where price is reacting around sell-side liquidity, a QFL level, and a high-interest reversal zone. The structure clearly shows how liquidity is being engineered before a potential directional move.
Bearish Market Structure & Distribution Phase
On the left side of the chart, EURUSD forms a distribution top, followed by a strong bearish impulse. This move breaks internal structure and confirms that sellers are in control. The aggressive candles and shallow pullbacks indicate institutional selling, not retail noise.
After the initial drop, price attempts a corrective move but fails to sustain higher highs, keeping the overall bias bearish.
QFL (Quasimodo / Failed Level) Interaction
In the mid-section, price reacts around a clearly marked QFL zone. This level acts as a decision point, where previous structure fails and liquidity is manipulated. The rejection from this area reinforces bearish continuation and confirms that buyers are weak and reactive.
The QFL failure sets the stage for price to seek liquidity lower.
Liquidity Sweep Into Reversal Zone
Price then accelerates downward into the highlighted Reversal Zone, accompanied by a volume burst. This move represents a sell-side liquidity sweep, where stops below equal lows are taken.
The long lower wick and slowing momentum at this level suggest selling pressure is being absorbed, not extended. This is typically where smart money looks to close shorts or initiate early long positions.
Confirmation Is Key – Pattern or Double QFL
The note on the chart, “Need a pattern otherwise double the QFL”, is critical. It highlights two scenarios:
Bullish scenario: A clear bullish confirmation pattern (engulfing, structure break, or strong close) from the reversal zone can trigger a corrective rally.
Bearish continuation: Failure to confirm will likely result in another push lower, forming a double QFL, trapping early buyers before the real reversal.
This reinforces the idea of reaction, not prediction.
Drafted Zone as Upside Target
Above current price lies a Drafted Zone, which represents a future liquidity draw. If the reversal zone holds and confirmation appears, this area becomes a logical upside target, where price may rebalance inefficiencies and test previous supply.
The “2x” projection further supports the potential for a measured corrective move if buyers step in.
Overall Bias & Trading Insight
Primary bias: Bearish, but short-term corrective bounce possible
Key area: Reversal zone with volume confirmation
Best approach: Wait for confirmation before entry
Risk zone: Early longs without confirmation
This chart perfectly illustrates how EURUSD is moving from liquidity grab to decision point, and the next candles will reveal whether this is a true reversal or just another trap.
Final Thoughts
EURUSD is at a critical inflection point. Smart traders will stay patient, let the market show its hand, and trade after confirmation, not before.
⚠️ This analysis is based on technical and liquidity concepts and is not financial advice.

EURUSD Pauses as Market Reassesses the Next MoveEURUSD is currently moving through a phase of consolidation after its recent directional push, with price action becoming more measured and selective. This behaviour suggests the market is digesting prior momentum while traders recalibrate expectations around macro drivers and dollar flows. Rather than aggressive continuation, the pair is showing signs of hesitation, often seen ahead of a fresh expansion in volatility.
Disclosure: We are part of Trade Nation's Influencer program and receive a monthly fee for using their TradingView charts in our analysis.

EUR/USD - H4 Weekly Outlook - Breakout Loading ?📝 Description 🔍 Market Structure
EUR/USD remains in a strong H4 uptrend, supported by a rising trend OANDA:EURUSD line and higher-high / higher-low structure. Price is currently compressing below a key resistance zone, suggesting a breakout or pullback scenario is loading.
🔴Trendline support respected multiple times
🔴Price holding above key moving averages
🔴Momentum slowing near resistance → decision zone
📍 Key Support & Resistance
🟢 Resistance Zone: 1.1760 – 1.1800
(June & September highs in focus)
🔴 1st Support: 1.1600 – 1.1580
🔴 2nd Support: 1.1540 – 1.1520
#EURUSD #ForexTrading #WeeklyOutlook #BreakoutSetup #PriceAction #SupportResistance #TradingView #Kabhi_TA_Trading
⚠️ Disclaimer
This analysis is for educational purposes only.
Forex trading involves risk — always manage position size and use a stop-loss.
💬 Support & Engagement👍 Like if you’re waiting for the breakout
💬 Comment: Breakout or Pullback first?
🔁 Share with traders watching EUR/USD

EURUSD BUY SETUP 📊 EURUSD UPDATE — Buy Setup in Focus
EURUSD is holding above a key support zone, and price action suggests bullish continuation if structure remains intact. Buyers are stepping in with controlled risk and clear upside potential.
📌 Trade Levels
🔓 Entry: 1.17233
❌ Stop Loss: 1.16945
🎯 Target: 1.17373
Trade with confirmation, not emotions. Let the market do the work.
⚠️ For educational purposes only. Not financial advice.

EURUSD | 15M TIME FRAME BUY SETUP ANALYSISEURUSD — Trade Setup
📈 Bias: Bullish
🎯 Entry: 1.7100 / 1.7150
🛑 Stop Loss: 1.7000
🎯 Target: 1.7205
📊 Technical Reasoning:
EURUSD is maintaining bullish momentum after holding above a key support zone. The entry area is positioned where buyers are expected to defend price and continue the move higher. The stop loss is placed beyond the invalidation level to manage downside risk, while the target is aligned with a higher liquidity objective and continuation structure.
📌 Execution Plan:
* Buy from the marked entry zone
* Apply disciplined risk management
* Monitor price behavior as it approaches the target
❌ Invalidation:
A clear break and close below 1.7000 would invalidate this bullish setup.
💬 Do you expect continuation toward 1.7205, or consolidation before the next leg up?
⚠️ This analysis is for educational purposes only. Not financial advice.

EURUSD FRGNT FUN COUPON FRIDAY -Q4 | W51 | D19 | Y25 |📅 Q4 | W51 | D19 | Y25 |
📊 EURUSD FRGNT FUN COUPON FRIDAY
🔍 Analysis Approach:
I’m applying Smart Money Concepts, focusing on:
Identifying Points of Interest on the Higher Time Frames (HTFs) 🕰️
Using those POIs to define a clear trading range 📐
Refining those zones on Lower Time Frames (LTFs) 🔎
Waiting for a Break of Structure (BoS) for confirmation ✅
This method allows me to stay precise, disciplined, and aligned with the market narrative, rather than chasing price.
💡 My Motto:
"Capital management, discipline, and consistency in your trading edge."
A positive risk-to-reward ratio, paired with a high win rate, is the backbone of any solid trading plan 📈🔐
⚠️ Losses?
They’re part of the mathematical game of trading 🎲
They don’t define you — they’re necessary, they happen, and we move forward 📊➡️
🙏 I appreciate you taking the time to review my Daily Forecast.
Stay sharp, stay consistent, and protect your capital
— FRNGT 🚀
OANDA:EURUSD

EURUSD(20251219) Today's AnalysisThe European Central Bank (ECB) held rates steady for the fourth consecutive meeting and adopted a more positive outlook on the eurozone economy.
The ECB kept the deposit facility rate unchanged at 2%, in line with market expectations. The main refinancing rate and marginal lending rate remained unchanged at 2.15% and 2.40%, respectively. The euro rose briefly against the dollar.
Traders' bets on ECB rates remained stable, with expectations of a 3 basis point rate hike in 2026. Money markets now anticipate a greater than 50% chance of an ECB rate hike before March 2027, up from 35% before the ECB's statement.
The ECB raised several of its forecasts for eurozone economic growth and inflation, a move that may close the door on further rate cuts in the near future.
Technical Analysis:
Today's Buy/Sell Threshold:
1.1731
Support and Resistance Levels:
1.1781
1.1762
1.1750
1.1712
1.1700
1.1681
Trading Strategy:
Consider buying if the price breaks above 1.1731, with a first target price of 1.1750.
Consider selling if the price breaks below 1.1712, with a first target price of 1.1700.

EUR/USD - Central Bank Week in Control (18.12.2025)📝 Description🔹 Market Context (Fundamental) FX:EURUSD
This week is central-bank heavy, keeping EUR/USD sensitive to volatility and USD strength:
BoE (Thursday): High impact – rate cut expected → risk-off tone
ECB (Thursday): Low impact – policy hold expected
BoJ (Friday): High impact – rate hike expectations, supporting JPY and pressuring USD pairs via risk repricing
Overall, policy divergence + risk uncertainty keeps EUR/USD capped near resistance.
🔹 Technical Setup
Price is trading below a key resistance zone and struggling to hold above short-term EMA / cloud levels. Repeated rejections from the highlighted zone indicate seller dominance.
As long as price stays below resistance, pullbacks are likely to extend lower.
📌 Trade Plan 🔴 Bearish below resistance
Sell-on-rejection from the resistance zone
Momentum confirmation preferred on lower timeframes
🔴 1st Support: 1.1685
🔴 2nd Support: 1.1660
#EURUSD #ForexTrading #FundamentalAnalysis #CentralBankWeek #PriceAction #SupportResistance #FXMarket #TradingView #Kabhi_TA_Trading
⚠️ Disclaimer
This analysis is for educational purposes only.
Not financial advice. Always manage risk and use a stop-loss.
❤️ Support the Analysis 👍 Like if this breakdown helps 💬 Comment your EUR/USD bias
🔁 Share with fellow traders

2025.12.16 EURUSD 4-Hour Trading Plan Hello traders,
I. Current Technical Context
- Instrument: Euro vs. U.S. Dollar (EURUSD), 4-hour chart
- Pattern: Bullish retracement (recent uptrend; current price ~1.1749 )
- Key Levels (Fibonacci extensions/resistances):
- Support: 1.17457~1.17311
- TP levels: 1.27 Fib~1.18016, TP1;
1.414 Fib ~1.18522, TP2
- Indicators:
- EMA(5/15): Price above EMAs (bullish bias)
- RSI: ~64 (near overbought; watch for momentum continuation)
II. Trading Strategy (Long Bias)
Long Entry Plan
- **Entry Condition**: Price holds above 1.1745 + bullish candlestick confirmation (e.g., bullish pin bar)
- Entry Level: 1.1750 (current price zone)
- Stop-Loss: Below 0.786 Fib support (~1.1730)
- Stop Size: ~20 pips
- Take-Profit:
- TP1: 1.27 Fib (~1.18016)
- Risk-Reward Ratio: (1.18016-1.1750)/(1.1750-1.1730) ≈ 2.6:1
- TP2: 1.618 Fib (~1.18522)
- Risk-Reward Ratio: (1.18522-1.1750)/(1.1750-1.1730) ≈ 5.1:1
III. Alternative/Exit Rules
- If price breaks below 0.786 support (~1.1731), abandon long plan (invalidates bullish retracement bias)
- If RSI spikes above 70 (overbought), consider partial profit-taking at TP1
GOOD LUCK!
LESS IS MORE!

EURUSD 30M : Bearish Breakdown + Waiting for Reaction DemandEURUSD (30-Minute) – Bearish Continuation Toward a Key Reversal & Liquidity Zone
This EURUSD 30-minute chart highlights a clear shift in momentum from bullish correction to bearish continuation, with price now moving aggressively toward a well-defined reversal and liquidity area. The structure, candle behavior, and zones marked on the chart suggest that the market is entering a decision phase where patience and confirmation are essential.
Market Structure & Price Behavior
Initially, EURUSD experienced a sharp bullish impulse, followed by a corrective phase that formed a rounded / sloping structure (highlighted in green). This type of price action often represents distribution, where buyers gradually lose control while sellers build positions.
As price reached the upper boundary of this corrective structure, bullish momentum clearly weakened. The market then produced a strong bearish displacement candle, breaking below short-term support and signaling that sellers had regained control.
Momentum Shift & Breakdown
The recent bearish candles show strong body closes with minimal lower wicks, which confirms selling pressure rather than stop-hunting. This is not a random pullback — it is a decisive move, suggesting that price is likely to continue lower unless strong buying appears at a key zone.
The break of structure (BOS) to the downside confirms that EURUSD is currently bearish on the intraday timeframe.
Reversal Zone (Primary Area of Interest)
The marked Reversal Zone below current price is a high-probability area where:
Previous buying interest was present
Liquidity may be resting
Short-term sellers may take partial profits
However, the chart clearly states “Pattern Need”, which is critical. This means:
No blind buying in the zone
Wait for price action confirmation such as a strong rejection, bullish engulfing, or clear structure shift
Only if such a pattern appears does a counter-trend buy become valid.
Failure Scenario & Drafted Zone
If price fails to react at the first reversal zone and breaks through it with momentum, the probability increases for a deeper bearish continuation. In that case, price is likely to move toward the Drafted Zone, which represents a deeper liquidity pool and a more attractive area for potential reactions.
The vertical projection on the chart highlights a 2x measured move, reinforcing the idea that momentum can extend if buyers remain absent.
Trading Psychology & Risk Management
This setup is a textbook example of waiting, not predicting. The market has already shown its bearish intent. The correct mindset here is:
Sell with the trend after pullbacks
Or buy only after confirmation at key zones
Entering without confirmation increases risk and reduces probability.
Summary
EURUSD is currently bearish on the 30-minute timeframe, with price approaching a critical decision area. The next valid trade depends entirely on how price behaves inside the marked zones. Either we get a confirmed reversal pattern for a short-term bounce, or continuation toward deeper liquidity.

EURUSD Analysis : Bullish Bias Setup + Demand Zone + ReversalEURUSD – 30 Minute Chart Analysis
Market Structure Overview
EURUSD initially moved in a strong bullish trend, creating higher highs and higher lows. This impulsive rally shows aggressive buying pressure and momentum expansion. However, after reaching the recent high, price failed to sustain upside continuation and started showing loss of bullish strength.
This shift marked the beginning of a distribution phase, where smart money began offloading positions rather than pushing price higher.
Breakdown from Consolidation
After the top formation, price entered a tight consolidation / triangle structure, signaling indecision and compression. This pattern acted as a continuation structure to the downside. Once price broke below the triangle, it triggered a strong bearish continuation, confirming that sellers had taken control.
The breakdown was clean, impulsive, and backed by strong candle bodies — a clear sign of bearish displacement.
Liquidity Sweep & OPL Reaction
Following the breakdown, price aggressively moved lower, sweeping liquidity below recent lows. The OPL level acted as a minor pause point but failed to hold, confirming that buyers were weak and stops were being consumed.
This move was necessary to clean out weak longs before price reached a more meaningful demand area.
Reversal Zone (Demand Area)
The highlighted Reversal Zone at the bottom is a key demand / accumulation area, where price previously showed strong bullish reactions. As price entered this zone, selling pressure slowed, and small bullish candles began to appear, signaling potential absorption of sell orders.
This behavior suggests that smart money may be accumulating long positions at discounted prices.
Potential Recovery Scenario
If price continues to hold above the reversal zone and forms:
Higher lows
Bullish engulfing candles
Strong rejection wicks
Then a corrective bullish move becomes likely. The projected path shows a step-by-step recovery rather than an aggressive reversal, which is typical after a sharp sell-off.
Bearish Invalidation
If price closes decisively below the reversal zone with strong momentum, this bullish recovery idea becomes invalid. In that case, the market may continue lower toward deeper liquidity zones.
Trader’s Mindset
This is a reaction-based setup, not a prediction. The best trades will come only after confirmation inside the reversal zone. Patience here separates disciplined traders from emotional ones.
Key reminders:
Zones are areas, not exact prices
Confirmation > early entry
Protect capital first
Final Thoughts
EURUSD is currently trading at a high-decision demand zone after a strong bearish move. The next candles will be crucial in defining whether this is just a pause or the beginning of a meaningful recovery. Let price confirm before committing to a trade.

EURUSD(20251218) Today's AnalysisMarket News:
Ben Waller, one of the final candidates for the next Federal Reserve Chair and current Governor, said on Wednesday that the current job market is "very weak" and job growth is "not optimistic," therefore the Fed still has room to cut interest rates. He supports further rate cuts to restore the central bank's interest rate setting to a neutral level, while stating that policymakers do not need to rush into doing so.
Speaking at the Yale University CEO Summit, Waller noted that the Fed's current interest rate is 50 to 100 basis points higher than the neutral rate, but he emphasized that "aggressive action is not needed" and that rate cuts can continue "at a moderate pace."
Waller stated that "the job market indicates the Fed should continue cutting rates," while also assuring that "we are not seeing a cliff-like drop in the job market."
Technical Analysis:
Today's Buy/Sell Threshold:
1.1733
Support and Resistance Levels:
1.1787
1.1767
1.1754
1.1712
1.1698
1.1678
Trading Strategy:
If the price breaks above 1.1754, consider buying with a first target price of 1.1767.
If the price breaks below 1.1733, consider selling with a first target price of 1.1712.

EURUSD is in a Downside DirectionHello Traders
In This Chart EURUSD HOURLY Forex Forecast By FOREX PLANET
today EURUSD analysis 👆
🟢This Chart includes_ (EURUSD market update)
🟢What is The Next Opportunity on EURUSD Market
🟢how to Enter to the Valid Entry With Assurance Profit
This CHART is For Trader's that Want to Improve Their Technical Analysis Skills and Their Trading By Understanding How To Analyze The Market Using Multiple Timeframes and Understanding The Bigger Picture on the Charts

EURUSD SELL | Idea Trading AnalysisEURUSD is moving on resistance zone
The chart is above the support level, which has already become a reversal point twice.
We expect a decline in the channel after testing the current level.
We expect a decline in the channel after testing the current level
Hello Traders, here is the full analysis.
I think we can soon see more fall from this range! GOOD LUCK! Great SELL opportunity EURUSD
I still did my best and this is the most likely count for me at the moment.
-------------------
Traders, if you liked this idea or if you have your own opinion about it, write in the comments. I will be glad ⚜️

EURUSD — Strong Supply Rejection After Buyer-Zone Breakout EURUSD completed a full Wyckoff-style distribution, starting with UTA and DTA phases, followed by range formation and a clear rounded top near the strong supply zone. The breakout above the buyer zone was a false move, trapping late buyers and confirming smart money selling pressure.
Price was aggressively rejected from supply and is now trading back below the buyer zone, indicating bearish control. If the marked support is broken, continuation toward the first target is likely, with extended downside potential into the major demand zone area.
Overall structure favors shorts while price remains below the supply zone, with targets aligned toward lower liquidity and demand.
