EUR/USD Falls Ahead of PCE Index ReleaseEUR/USD Falls Ahead of PCE Index Release
A week ago, we wrote about significant changes in the dollar index – the DXY chart was signalling bullish trends. This week has confirmed those assumptions, which is also reflected in EUR/USD: this morning, the pair fell below 1.1660, marking a three-week low.
Trader sentiment is being influenced by:
→ News regarding President Trump’s decision to impose tariffs on pharmaceuticals (and other goods) imported into the US.
→ Expectations for the release of the Core PCE (Personal Consumption Expenditures) Price Index, scheduled for 15:30 GMT+3 – the data may provide important guidance on the inflation outlook and potential US interest rate cuts.
EUR/USD Technical Analysis
EUR/USD fluctuations over the past few months have formed an ascending channel (shown in blue), providing an important context for interpreting price dynamics.
From a bullish perspective:
→ The price is near a key support line – the lower boundary of the channel;
→ The recent dip below the 11 September low (1.1660) can be viewed as a bullish Liquidity Grab pattern;
→ The RSI indicator has fallen into oversold territory.
From a bearish perspective, mid-September saw important reversal signals:
→ The median of the ascending channel acted as resistance;
→ The break above July’s high was short-lived (potentially trapping buyers) – a sign of a false breakout;
→ A long upper wick on candle A of the EUR/USD chart indicated seller aggression.
A logical continuation of these signals has been the formation of a series of lower highs and lows A→B→C→D, with:
→ Each recovery reaching roughly 50% of the preceding downward impulse;
→ Note (as shown by the arrow) that the bounce from 1.7250 was extremely weak (resembling a Dead Cat Bounce pattern), confirming rising selling pressure.
Given the above, it is reasonable to suggest that the lower boundary of the multi-month channel may act as strong support for EUR/USD. However, clear seller initiative increases the likelihood of a bearish breakout. Whether this occurs today will depend on the market’s reaction to the PCE index release.
This article represents the opinion of the Companies operating under the FXOpen brand only. It is not to be construed as an offer, solicitation, or recommendation with respect to products and services provided by the Companies operating under the FXOpen brand, nor is it to be considered financial advice.
Eurusdtrendanalysis

Market Analysis: EUR/USD RalliesMarket Analysis: EUR/USD Rallies
EUR/USD started a decent upward move above 1.1770.
Important Takeaways for EUR/USD Analysis Today
- The Euro found support and started a recovery wave above the 1.1770 resistance zone.
- There is a connecting bullish trend line forming with support at 1.1825 on the hourly chart of EUR/USD.
EUR/USD Technical Analysis
On the hourly chart of EUR/USD, the pair started a fresh increase from 1.1660. The pair even settled above 1.1800 and the 50-hour simple moving average. Finally, it tested the 1.1880 resistance. A high is formed near 1.1878 and the pair is now consolidating gains above the 23.6% Fib retracement level of the upward move from the 1.1660 swing low to the 1.1878 high.
Immediate support is near a connecting bullish trend at 1.1825. The next area of interest could be 1.1795 and the 50-hour simple moving average.
The main breakdown zone on the EUR/USD chart sits near the 50% Fib retracement at 1.1770. If there is a downside break below 1.1770, the pair could drop toward 1.1710. Any more losses might send the pair toward the 1.1660 low.
On the upside, the pair is now facing resistance near 1.1880. The next hurdle is 1.1920. An upside break above 1.1920 could set the pace for another increase. In the stated case, the pair might rise toward 1.1965.
This article represents the opinion of the Companies operating under the FXOpen brand only. It is not to be construed as an offer, solicitation, or recommendation with respect to products and services provided by the Companies operating under the FXOpen brand, nor is it to be considered financial advice.

UPDATE - EUR/USD Extends Rally as Bullish Structure Holds FirmHi Everyone,
A quick update on our EUR/USD idea shared earlier in the week:
We saw the anticipated break higher, clearing both the 1.17889 level and the yearly high at 1.18300, which now shifts our focus to the higher levels above. In the near term, any pullbacks are expected to hold above the 1.16550 support, keeping the broader bullish structure intact.
The impulsive rally from the 1st August low continues to underpin our bullish outlook on EUR/USD. Our broader view remains unchanged: we expect the pair to continue building momentum for another leg higher. With the decisive break above 1.17889, the focus now turns to the 1.18350–1.19290 zone, and ultimately the 1.20000 handle.
We’ll be monitoring price action closely to see whether this recovery gains traction and if buyers can sustain momentum through resistance. The longer-term outlook remains bullish, provided price continues to hold above the key support levels.
We’ll keep updating you throughout the week as the structure develops and share how we’re managing our active positions.
Thanks again for all the likes, boosts, comments, and follows — your support is truly appreciated!
All the best for the rest of the week.
Trade safe.
BluetonaFX

EUR/USD Falls Amid Rapidly Changing News FlowEUR/USD Falls Amid Rapidly Changing News Flow
There was important news yesterday. According to Forex Factory:
→ The ECB kept its main refinancing rate at 2.15% (as expected).
→ US data indicated a rise in inflation – albeit a moderate one. On a year-on-year basis, the CPI increased from 2.7% to 2.9%, in line with analysts’ expectations.
At the same time, all incoming news is being assessed by traders in light of the forthcoming Federal Reserve decision – according to media reports, yesterday’s data did not have a significant impact on market sentiment, and a 25-basis-point rate cut is still expected.
EUR/USD market movements suggest a balance, although some bearish signs are emerging.
EUR/USD Technical Analysis
Using key highs and lows, we can draw an ascending channel (highlighted in blue) that began in August.
From a bearish perspective:
→ The 1.17400 level has regained its role as resistance.
→ The steep upward trend from early September (shown in orange) was broken by bears around 1.17525.
Therefore, the 1.17400–1.17525 zone appears to act as a resistance area, which is already influencing the price:
→ Last night, EUR/USD’s rise was halted within this zone.
→ Today, a move above 1.17400 led to a sharp downward reversal.
Overall, this behaviour has formed a bearish double top pattern.
From a bullish perspective:
→ Yesterday, the price formed a long lower shadow (indicated by the arrow).
→ During the subsequent rise, the strength of buyers was confirmed. A bullish Fair Value Gap pattern might form, and this area (where buyers and sellers create an imbalance) might act as support.
However, if the bears continue to assert their emerging dominance, the FVG area could be broken, in which case it may then act as resistance.
This article represents the opinion of the Companies operating under the FXOpen brand only. It is not to be construed as an offer, solicitation, or recommendation with respect to products and services provided by the Companies operating under the FXOpen brand, nor is it to be considered financial advice.

EURUSD after the newsYesterday, the ECB kept interest rates unchanged, while U.S. inflation data was released.
EURUSD bounced off the support zone and is once again moving toward a retest of the previous highs.
The next resistance levels are at 1,1766 and 1,1830.
Next week, the Fed’s interest rate decision will be announced, which will be a key driver for market movement.

Euro holds firm as dollar slips on Fed cut betsEuro holds firm as dollar slips on Fed cut bets
The euro traded near $1.167, steady despite U.S. dollar weakness fueled by soft labor data. Private payrolls rose 54,000 in August versus 65,000 expected, job openings fell to 7.18 million, the lowest since September 2024, and jobless claims hit a two-month high—signaling a cooling labor market.
Markets now expect a 0.25% Fed rate cut in September, which could further weigh on the dollar and support EUR/USD. Traders should monitor upcoming U.S. data for additional easing signals.
In France, a confidence vote on Prime Minister François Bayrou’s budget plan is unlikely to impact the euro significantly, ING says. Even if Bayrou loses, President Macron is expected to appoint a new centrist or center-right PM with a softer fiscal plan. While political uncertainty remains, it’s largely priced in.

EUR USD Trade Setup 1 hour timeframe EUR USD has formed a Head and Shoulders break and retest pattern, and the price is currently at the retest level.
Additionally the retest level also align with the 0.50 - 0.618 Fib Retracement level.
Now lets wait for Entry Confirmation.

UPDATE - EUR/USD Holding Support, Upside Still on the CardsHi Everyone,
A quick update on the idea shared earlier this week — we’re still looking for the Fiber to attempt a move toward the 1.17889 resistance. Yesterday’s dip found support between the 1.15880–1.16180 zone, which could provide the base for another push toward the upside target.
That said, a deeper retracement toward the 1.15200 zone may still be required to attract fresh buying interest and cannot be ruled out.
The impulsive rally from the 1st August low continues to reinforce our bullish outlook on EUR/USD.
Our broader view remains unchanged: we expect the pair to continue building momentum for another leg to the upside. A decisive break above 1.17889 would open the path toward the 1.18350–1.19290 zone, and ultimately the 1.20000 handle.
We’ll be monitoring price action closely to see whether this recovery gains traction and if buyers can sustain momentum through resistance. The longer-term outlook remains bullish, provided price continues to hold above the key support levels.
We’ll keep updating you throughout the week as the structure develops and share how we’re managing our active positions.
Thanks again for all the likes, boosts, comments, and follows — your support is truly appreciated!
All the best for the rest of the week.
Trade safe.
BluetonaFX

Market Analysis: EUR/USD Trims GainsMarket Analysis: EUR/USD Trims Gains
EUR/USD started a downside correction from 1.1740.
Important Takeaways for EUR/USD Analysis Today
- The Euro struggled to clear 1.1740 and corrected gains against the US Dollar.
- There was a break below a key bullish trend line with support at 1.1705 on the hourly chart of EUR/USD.
EUR/USD Technical Analysis
On the hourly chart of EUR/USD, the pair gained pace for a move above 1.1650. The Euro tested 1.1735 and recently corrected gains against the US Dollar.
The pair dipped below 1.1700 and a key bullish trend line with support at 1.1705. It sparked a move below the 50% Fib retracement level of the upward move from the 1.1574 swing low to the 1.1736 high.
The pair shows some bearish signs below the 50-hour simple moving average, and gains might remain capped since the RSI is now below 50. Immediate resistance on the upside is near 1.1655. The next key hurdle for the bulls could be near the 50-hour simple moving average at 1.1675.
An upside break above 1.1675 might send the pair toward 1.1705. Any more gains might open the doors for a move toward 1.1740.
On the downside, immediate support on the EUR/USD chart is seen near the 76.4% Fib retracement at 1.1610. The next major area of interest is 1.1575. A downside break below 1.1575 could send the pair toward the 1.1500 handle.
This article represents the opinion of the Companies operating under the FXOpen brand only. It is not to be construed as an offer, solicitation, or recommendation with respect to products and services provided by the Companies operating under the FXOpen brand, nor is it to be considered financial advice.

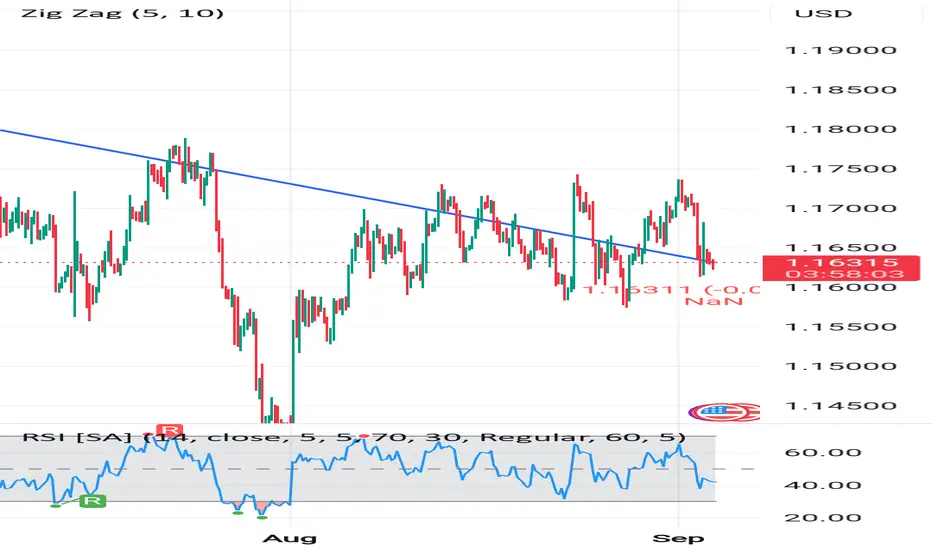
4H Chart | Price Action, Trendline & RSI Signals📉 Pair: EUR/USD
⏱ Timeframe: 4 Hours
💹 Current Price: 1.16312
Technical Overview
The EUR/USD pair is currently trading near 1.16312, showing bearish pressure after failing to hold above the 1.1650 zone. The price has been respecting a downward trendline, which has acted as dynamic resistance on multiple occasions.
A recent Zig Zag indicator setup highlights the swing highs and lows, confirming the presence of a descending pattern. Until the price breaks and sustains above this trendline, the bearish outlook remains intact.
Key Levels
Resistance: 1.1700 – 1.1750
Support: 1.1600 – 1.1520
RSI Indicator (14)
The RSI is currently hovering around the 40–45 range, suggesting mild bearish momentum but not yet oversold. A dip below 30 could indicate an oversold condition and potential for reversal.
Price Action Insights
A break below 1.1600 could open doors for further downside toward 1.1520.
On the upside, a clean break and retest above 1.1700 would invalidate the bearish structure and favor bulls.
Trading Plan
Bearish Scenario: Look for sell opportunities below 1.1650 with targets near 1.1600 and 1.1520.
Bullish Scenario: A breakout above 1.1700 may offer buy setups toward 1.1750 and 1.1800.
📊 Risk Management: Always use proper stop-loss and position sizing to manage risk effectively.
💬 What’s your bias on EUR/USD? Are you expecting a breakdown or reversal from here? Drop your analysis in the comments!
EURUSD uptrendToday is Labor Day in the U.S., which usually means lower liquidity and limited market moves.
EURUSD continues to climb, maintaining its upward trend.
The target remains a break above the previous highs, aiming toward 1,1925.
All positions should stay aligned with the trend!

EUR/USD Recovers from 20-Day LowEUR/USD Recovers from 20-Day Low
The EUR/USD pair today is moving under the influence of several factors:
- Donald Trump’s decision to dismiss Lisa Cook, a member of the Federal Reserve Board of Governors, raising concerns over the Fed’s independence;
- expectations of a Fed rate cut in September;
- anticipation of US GDP and jobless claims data (due today at 15:30 GMT+3);
- the political crisis in France.
These and other drivers pushed the pair down to a 20-day low yesterday (with a local low L3 formed on the EUR/USD 4-hour chart), before it staged a firm recovery.
EUR/USD Chart Technical Analysis
At the start of the week, we:
→ outlined a descending channel (shown in red);
→ drew an interim upward price trajectory (purple lines);
→ highlighted bearish signs (for instance, the lower purple line acting as resistance), suggesting a possible attempt to break key support at 1.1600.
Yesterday’s price action confirmed such an attempt, but it triggered renewed demand. The bulls prevented further downside momentum, leaving EUR/USD trading above 1.1600 today.
At the same time:
→ with the formation of the L3 low, a bullish engulfing pattern can be observed;
→ the sequence of higher highs (H1→H2→H3) alongside lower lows (L1→L2→L3) forms a megaphone pattern.
As for resistance, the 1.1660 level stands out – bears were successful here when they broke through the lower boundary of the interim upward trajectory, and this zone also coincides with the axis of the megaphone pattern.
Thus, we could assume that in the near term EUR/USD may fluctuate within the 1.1600–1.1660 range, until sentiment shifts – for example, due to statements from Washington or fresh US labour market data.
This article represents the opinion of the Companies operating under the FXOpen brand only. It is not to be construed as an offer, solicitation, or recommendation with respect to products and services provided by the Companies operating under the FXOpen brand, nor is it to be considered financial advice.

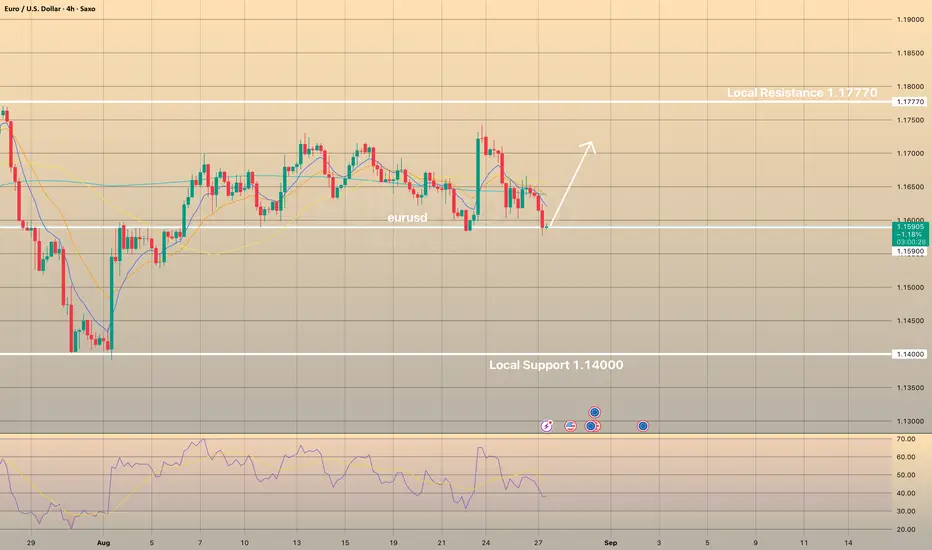
EURUSD Trading Setup: Key Levels and StrategyEURUSD Trading Setup: Key Levels and Strategy
EURUSD has been under strong buying pressure in recent hours, with key support levels at 1.1590 and 1.1400 and resistance at 1.1770. A rebound from support could signal a buying opportunity targeting the resistance level, while a confirmed breakout below support would indicate a selling scenario. No major news is expected to significantly affect trades in the near term.
EUR/USD Exchange Rate Shows Increased VolatilityEUR/USD Exchange Rate Shows Increased Volatility
Powell’s speech on Friday had a distinctly dovish tone. Expectations of an interest rate cut strengthened, which led to a sharp weakening of the dollar — on the EUR/USD chart, a bullish impulse A→B was formed.
On Monday, as often happens after an initial emotional reaction to major news, the price corrected as market participants reassessed prospects in light of the Fed Chair’s softened rhetoric.
What is particularly notable is that the correction was most evident on the EUR/USD chart, where the decline B→C almost completely offset Friday’s surge. This could point to underlying weakness in the euro, which seems justified when considering that the euro index EXY (the euro’s performance against a basket of currencies) has risen by roughly 13% since the beginning of the year.
The EUR/USD rate reacted less strongly to the news that President Trump had decided to dismiss Lisa Cook, a member of the Federal Reserve’s Board of Governors. While the media debates whether the President has the authority to remove her, traders may instead assess how EUR/USD could fluctuate following the A→B→C volatility swing.
Technical Analysis of the EUR/USD Chart
Recently, we outlined a descending channel using the sequence of lower highs and lows observed this summer. The upper boundary clearly acted as resistance for EUR/USD’s rise on Friday.
From the bears’ perspective:
→ the price has broken downward through an ascending trajectory (shown in purple), and the lower purple line has already changed its role from support to resistance (as indicated by the arrow);
→ today’s rebound from the 1.1600 support level appears weak, as highlighted by the long upper shadow on the candlestick;
→ if this rebound is merely an interim recovery following the bearish B→C impulse, it fails to reach the 50% Fibonacci retracement level.
In addition, the B peak only slightly exceeded the previous August high (which resembles a bull trap).
Taking all this into account, we could assume that in the near term we may see bears attempt to break the 1.1600 support level and push EUR/USD towards the median line of the primary descending channel.
This article represents the opinion of the Companies operating under the FXOpen brand only. It is not to be construed as an offer, solicitation, or recommendation with respect to products and services provided by the Companies operating under the FXOpen brand, nor is it to be considered financial advice.

EURUSD Drops as Traders Eye U.S. Consumer Confidence DataEURUSD Drops as Traders Eye U.S. Consumer Confidence Data
EURUSD slipped 0.69% to 1.1634, after touching a four-week high of 1.1742 on Friday.
Why the euro had support:
German business climate hit a 15-month high, signaling economic strength and boosting sentiment for eurozone growth.
Improved outlook reduces expectations for ECB rate cuts, making the euro more attractive.
Today’s focus:
U.S. CB Consumer Confidence report.
Strong data → delays Fed cuts → EUR/USD could dip below 1.1600.
Weak data → dollar softens → EUR/USD may climb above 1.1700.

EURUSD – buying after the correctionEURUSD remains in an uptrend despite yesterday’s pullback.
The price has tested the support zone and is holding above it.
The main scenario is for price to stay above support and continue higher, aiming for a test of 1,1760 and a potential breakout above recent highs.
We are only looking for entries in the direction of the trend – buying after market confirmation.

EUR/USD Holds Firm – Eyeing Pullback Before Next Leg HigherHi Everyone,
Despite what was a fundamentally turbulent week in the markets, our trading delivered a flawless run last week!
As highlighted in our previous idea, EUR/USD found support near the 1.16000 zone before mounting a push higher toward the 1.17889 level. Looking ahead into next week, we anticipate a pullback toward the 1.16550 area, which could provide the base for another attempt to reach 1.17889.
The impulsive rally from the 1st August low continues to reinforce our bullish outlook on EUR/USD.
Our broader view remains unchanged: we expect the pair to continue building momentum for another leg to the upside. A decisive break above 1.17889 would open the path toward the 1.18350–1.19290 zone, and ultimately the 1.20000 handle.
We’ll be monitoring price action closely to see whether this recovery gains traction and if buyers can sustain momentum through resistance. The longer-term outlook remains bullish, provided price continues to hold above the key support levels.
We’ll keep updating you throughout the week as the structure develops and share how we’re managing our active positions.
Thanks again for all the likes, boosts, comments, and follows — your support is truly appreciated!
All the best for the rest of the week.
Trade safe.
BluetonaFX

EURUSD shows a bullish rebound after Powell's speechCurrent technical picture
The EUR/USD pair showed a bullish rebound after Powell's speech at the Jackson Hole forum, which weakened the USD - DXY fell by 0.9%, which adds support to the euro. Thus, a double top was formed at 1.1800 and strong support at 1.1600. As a result, the weekly candle was almost unchanged.
FXStreet notes a stable bullish momentum - after a fall to 1.1583, the euro recovered above 1.1700 against the backdrop of a weak dollar.
The analysis shows that the fall to 1.1582 stopped the decline, and the current breakout of the 1.1729 level indicates a continuation of the upward movement. Focus is on the retest of 1.1819. As long as the 1.1582 level holds, the advantage remains with buyers.

EURUSD BUYSM; bullish trending market
w; break of a consolidation zone / making a new structure of HH and HL / BOS / between 0.5 FIB and 0.681 fib / the weekly agrees with the monthly, both in a bullish trend
D; bullish candlestick at weekly key level
4h; wait for price to tap into / MARKET SHIFT HL/retest entry
1h; waiting for 1h bullish engulfing at 4h demand zone / look for mini structure
fundamental:
Monday no news

EUR/USD Bearish Rejection at Resistance Zone – Target 1.15392📉 EUR/USD 1H Chart Analysis
Trend: The chart is showing a clear bearish trend inside a descending channel (support & rejection lines). Price continues to respect this downward structure.
Resistance Zone: A strong supply/resistance area is marked at 1.16148 – 1.16307 (highlighted in pink). Sellers are likely to defend this zone.
Indicators:
Price is trading below the 70 EMA and 200 EMA, confirming bearish momentum.
EMA crossover suggests continued downward pressure.
Price Action: Recently, a small pullback (yellow highlight) is visible after touching the lower boundary of the channel, indicating a short-term retracement before another bearish push.
Strategy:
📍 Entry: Look for short entries near the resistance zone (1.16148 – 1.16307).
⛔ Stop Loss: Above 1.16456 (previous high / EMA resistance).
🎯 Target: First target 1.15392, aligning with the projected channel support and marked demand area.
✅ Summary:
EUR/USD remains bearish as long as price stays below the EMAs and inside the descending channel. Expect rejection from the resistance zone and continuation to the downside toward 1.15392.

EURUSD Epic Bearish Breakout!
HI,Traders !
#EURUSD made an epic
Bearish breakout of a very
Strong key horizontal level
Of 1.16304 which is now a
Resistance and the breakout
Is confirmed so we are
Bearish biased and we will
Be expecting a further
Bearish move down !
Comment and subscribe to help us grow !

Buying opportunities on EURUSDEURUSD is holding above the support zone.
Watch for a new push higher and continuation of the uptrend.
The next resistance levels are:
1,1760
1,1830
1,1960
Always trade with the trend and manage your risk!

Market Analysis: EUR/USD Dips AgainMarket Analysis: EUR/USD Dips Again
EUR/USD declined from 1.1720 and traded below 1.1650.
Important Takeaways for EUR/USD Analysis Today
- The Euro started a fresh decline after a decent move above 1.1680.
- There was a break below a key bullish trend line with support at 1.1650 on the hourly chart of EUR/USD.
EUR/USD Technical Analysis
On the hourly chart of EUR/USD, the pair rallied above the 1.1680 resistance zone before the bears appeared, as discussed in the previous analysis. The Euro started a fresh decline and traded below 1.1660 against the US Dollar.
There was a break below a key bullish trend line with support at 1.1650, and a low was formed near 1.1622. After that, the pair started a consolidation phase.
There was a minor recovery wave above 1.1630. EUR/USD is now trading below 1.1650 and the 50-hour simple moving average. On the upside, the pair is now facing hurdles near the 23.6% Fib retracement level of the downward move from the 1.1692 swing high to the 1.1622 low at 1.1640.
The next key resistance is 1.1655 and the 50% Fib retracement. The main barrier for the bulls could be 1.1665. A clear move above 1.1665 could send the pair toward 1.1690. An upside break above 1.1690 could set the pace for another increase. In the stated case, the pair might rise toward the 1.1720 zone.
If not, the pair might resume its decline. The first major support on the EUR/USD chart is near 1.1620. The next important region for buyers sits at 1.1600. If there is a downside break below 1.1600, the pair could drop toward 1.1550. Any more losses might send the pair toward 1.1500.
This article represents the opinion of the Companies operating under the FXOpen brand only. It is not to be construed as an offer, solicitation, or recommendation with respect to products and services provided by the Companies operating under the FXOpen brand, nor is it to be considered financial advice.
