Long TLT/SPY📌 Bonds Explained: What They Are, How They Work & Key Risks
Bonds are one of the oldest and most important financial instruments in global markets. They are used by governments, corporations, and institutions to raise money, and by investors to earn income, diversify portfolios, and manage risk.
At their core, a bond is a loan:
The issuer (borrower) raises capital by selling bonds.
The investor (lender) provides money in exchange for periodic interest payments (coupon payments) and the return of the principal (face value) at maturity.
🔹 1. What is a Bond?
When you buy a bond, you are lending money to the issuer. The issuer promises:
Interest payments (usually fixed) on a regular schedule (semiannual or annual).
Repayment of principal (the original investment amount) when the bond matures.
📌 Example:
You invest $1,000,000 in a 10-year bond paying 3% annually (semiannual coupons).
Every 6 months, you receive $15,000 in interest payments.
At the end of 10 years, you (hopefully) receive back your original $1,000,000 principal.
🔹 2. Why Do Companies and Governments Issue Bonds?
Governments → Fund infrastructure, social programs, defense, or refinance existing debt.
Corporations → Finance expansion, research, acquisitions, or refinance loans.
Municipalities → Build schools, hospitals, and roads.
Bonds allow issuers to access large pools of capital without giving up ownership (like stocks).
🔹 3. Why Do Investors Buy Bonds?
Stable Income: Regular coupon payments.
Capital Preservation: Return of principal at maturity (assuming no default).
Diversification: Bonds often behave differently from stocks, balancing risk.
Hedging Inflation/Interest Rates: Certain bonds (like TIPS) protect against inflation.
Relative Safety: High-quality government bonds are considered safe-haven assets.
🔹 4. Key Types of Bonds
Government Bonds
Issued by sovereign states.
Example: U.S. Treasuries, UK Gilts, German Bunds.
Generally low risk, lower yields.
Corporate Bonds
Issued by companies.
Higher yields than government bonds but higher risk.
Municipal Bonds
Issued by local governments or agencies.
Often come with tax benefits for investors.
High-Yield (Junk) Bonds
Issued by lower-credit issuers.
Higher potential returns, but much riskier.
Inflation-Protected Bonds
Coupon/principal linked to inflation.
Example: U.S. TIPS (Treasury Inflation-Protected Securities).
🔹 5. Three Main Risks of Investing in Bonds
Even though bonds are often seen as “safe,” they carry risks that investors must understand:
1️⃣ Credit Risk (Default Risk)
The issuer may fail to pay coupons or repay the principal.
Higher with corporate bonds and emerging market government bonds.
Mitigated by credit ratings (Moody’s, S&P, Fitch).
📌 Example:
If a company defaults, you may lose part or all of your investment.
2️⃣ Interest Rate Risk
Bond prices move inversely to interest rates.
If rates rise, existing bond prices fall (since new bonds offer better yields).
If you sell before maturity, you could face a loss.
📌 Example:
You bought a 10-year bond at 3%. A year later, rates rise to 5%. Your bond’s market value falls, because investors prefer newer bonds paying higher coupons.
3️⃣ Inflation Risk (Purchasing Power Risk)
Even if you hold the bond to maturity, rising inflation erodes the real value of your returns.
A 3% coupon loses attractiveness if inflation rises to 6%.
📌 Example:
Your bond pays $30,000 annually, but inflation pushes up costs by $40,000 per year → you are effectively losing purchasing power.
🔹 6. Bonds vs. Stocks
Bonds: Debt, fixed income, contractual obligation, lower risk, limited upside.
Stocks: Equity ownership, dividends (optional), higher risk, unlimited upside.
In a company bankruptcy, bondholders are paid before shareholders.
🔹 7. How Investors Use Bonds in Portfolios
Income generation: Retirees and pension funds rely on coupon payments.
Diversification: Bonds often rise when stocks fall, reducing portfolio volatility.
Risk management: Safe-haven bonds (like Treasuries) act as “insurance” during crises.
Speculation: Traders can bet on interest rate moves via bond futures and ETFs.
🔹 8. Bonds vs. Stocks: The TLT–SPY Correlation
One of the most widely followed relationships in global markets is the correlation between:
TLT → iShares 20+ Year Treasury Bond ETF (tracks long-dated U.S. Treasury bonds).
SPY → SPDR S&P 500 ETF (tracks U.S. equities).
📈 Historical Relationship
Over the past two decades, TLT and SPY have often moved in opposite directions. (The Correlation between SPY/TLT often hovers around 0.)
Why? When stocks sell off, investors typically seek safety in Treasuries, pushing bond prices up (yields down).
This negative correlation makes bonds a powerful diversifier in equity-heavy portfolios (60/40).
📌 Example:
2008 Financial Crisis → SPY plunged ~37%, while long-dated Treasuries (TLT) surged as investors fled to safety.
March 2020 COVID Crash → SPY fell ~34% peak-to-trough, TLT spiked ~20% as the Fed cut rates and investors piled into Treasuries.
🐂 Strategy #1 (MA):
Buy SPY when TLT crosses below the 95 MA.
Sell SPY when TLT crosses above the 95 MA.
🔄 But the Correlation Can Shift
In inflationary environments, bonds and stocks can fall together.
2022 is a perfect example:
Inflation spiked → Fed hiked rates aggressively.
TLT dropped ~30% (yields surged).
SPY also fell ~19%.
Both asset classes sold off simultaneously, breaking the hedge.
🐂 Strategy #2 (Re-Balancing):
Buy TLT at the close of the seventh last trading day of the month.
Sell TLT at the close of the last trading day of the month.
Sell TLT short at the close of the month.
Cover TLT at the close of the seventh trading day of the month.
Higher Returns after rate hikes.
📊 Why This Matters for Investors
In normal times: TLT acts as a counterweight to SPY, smoothing portfolio volatility.
In inflationary shocks: Both can decline, reducing diversification benefits.
Lesson: Don’t assume bonds will always hedge equities — context (inflation, Fed policy, growth cycles) matters.
📌 Practical Uses of the TLT–SPY Correlation
Portfolio Diversification
A 60/40 portfolio (60% stocks, 40% bonds) relies on the negative correlation.
Works best when inflation is low and stable.
Risk-On / Risk-Off Gauge
If both SPY and TLT rise → markets are calm, liquidity flows into both risk and safety.
If SPY falls while TLT rises → classic risk-off move (flight to safety).
If both fall → inflation or policy tightening environment (no safe haven).
Trading Signals
Divergence trades: When SPY rallies but TLT also rallies strongly, it may signal equity rally exhaustion (risk-off brewing).
Macro hedge: Long TLT positions can offset downside risk in SPY-heavy portfolios — but only in disinflationary or deflationary shocks.
🔹 9. EWJ–TLT Correlation: Japan Equities vs. U.S. Treasuries
EWJ → Tracks Japanese equities (large & mid-cap companies).
TLT → Tracks U.S. long-dated Treasuries.
Unlike the classic SPY–TLT inverse correlation, the EWJ–TLT relationship is more complex, shaped by:
Global risk sentiment (risk-on/risk-off flows).
Currency effects (USD/JPY exchange rate).
Japan’s ultra-low interest rate environment (BoJ policy).
📈 Historical Tendencies
1️⃣ Risk-Off Periods (Global crises → flight to safety):
TLT rallies (U.S. Treasuries bid).
EWJ often falls, as Japanese equities are highly cyclical and export-driven.
Negative correlation dominates.
📌 Example:
2008 Crisis → TLT surged; EWJ plunged with global equities.
2020 COVID Crash → Same pattern: safety flows to Treasuries, Japanese stocks sold.
2️⃣ Risk-On Periods (Liquidity, global growth optimism):
EWJ rallies with global equities.
TLT may drift lower (yields rising on stronger growth).
Correlation weak to moderately negative.
📌 Example:
2016–2018: Global growth rebound → EWJ rose, TLT fell as U.S. yields climbed.
3️⃣ Currency Channel (USD/JPY)
Japanese equities (EWJ) are sensitive to the yen.
A stronger USD/JPY (weaker yen) boosts exporters (good for EWJ).
TLT rallies often coincide with USD weakness (yields down, dollar down), which can hurt Japanese exporters, adding another layer of inverse correlation.
🔄 Shifts Over Time
Long-term average correlation: Mildly negative (similar to SPY–TLT, but weaker).
During inflation shocks (2022): Correlation turned positive at times:
TLT fell as U.S. yields spiked.
EWJ also struggled due to global tightening & yen weakness.
Both moved down together, breaking the hedge.
📊 Why EWJ–TLT Matters
Global Diversification Check: Investors often think Japanese equities diversify U.S. equities, but they can be just as cyclical. Adding TLT creates the real hedge.
Risk-Off Signal: When both EWJ and TLT rise, it may indicate global liquidity easing (rare but bullish).
Currency Overlay: Always factor USD/JPY → sometimes EWJ’s move is more about currency than equities.
🐂 Strategy #3 (EWJ):
When Japanese stocks are above their 150-day moving average, go long TLT (US long-term Treasury). When the average is below the 150-day average, stay out. The correlation between TLT and EWJ can serve as a breath signal.
📌 Conclusion: Bonds as the Foundation of Finance
Bonds are the backbone of the global financial system, connecting borrowers (governments, corporations) with lenders (investors).
✅ Bonds provide regular income and capital preservation.
✅ They carry risks: credit, interest rate, and inflation.
✅ They are essential for diversification and risk management.
✅The TLT–SPY correlation is dynamic. Historically negative, providing diversification. In inflationary shocks (like 2022), the correlation turns positive, breaking the hedge.
✅ EWJ–TLT is a Global Macro Hedge, But Fragile. Usually inverse: Risk-off = TLT up, EWJ down. Sometimes aligned: Inflation shocks or synchronized global tightening → both down. Currency filter essential: USD/JPY often mediates the relationship. This makes EWJ–TLT correlation a powerful barometer of global macro regimes: Disinflationary slowdowns → Strong hedge. Inflationary crises → Hedge breaks.
For investors, understanding bonds is crucial, even if you primarily trade equities or commodities, because bond yields influence everything: stock valuations, mortgage rates, and even currency markets.
EWJ

EWJ Straddle/Trade planAlthough EWJ is not the most popular fund among retail traders, the creation of a neutral position on it at around 800,000$ suggests greater interest on the part of professional market participants, and thus we can expect fairly predictable moves at support/resistance borders.

Short JapanNo reason for Japan to break out to new ATH when the rest of the world isn't. All pumped up because their PM resigned, doesn't fix any real issues.
Overbought on daily


NIPPON is back?Multi decade channel with iron resistance level seems to have broken. Retest underway for months.What will happen next?

money rotations (theory)let's talk about money rotation for a minute.
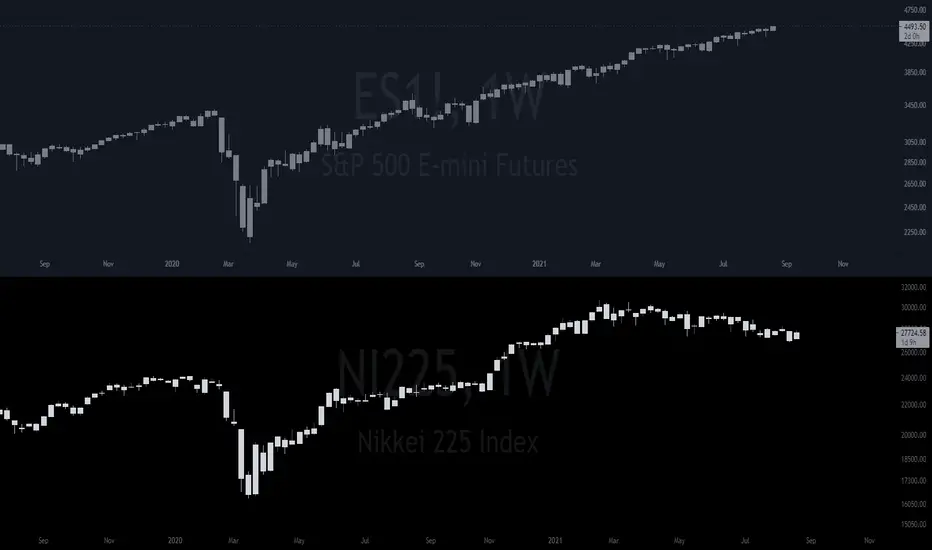
someone brought up this nikkei chart to me last night, and told me it is close to seeing a strong reversal, after taking a deeper look into it, i will have to strongly agree with their statement.
---
notice how the es chart has been going up for the last 189 days, while nikkei has been slumping for this same duration of time.
the indicator i use on all my trades is flashing a weekly buy signal right now for the first time since the covid crash on nikkei - see below the reaction it saw after this buy signal was triggered the last time around.
Hang Seng (Honk Kong Index) has the same weekly buy indicator, and it's also sitting at the 0.618 wave (2) target.
the theory is, since market maker doesn't want the market to just crash randomly - instead what they're going to do is rotate money into the next profitable area (slowly) - which in turn will create prolonged sideways chop \ a weak downward trend similar to what nikkei has been seeing over the last 6 months or so. not sure how long this is going to last, but i favor this scenario over a market crash any day - for the sake of the people, and for the sake of selling iron condors on spx 3 times a week 💸
curious to see how this will play out, but that's the primary scenario as of right now. if we happen to see a sharp correction as mentioned in my previous post, then i suppose we can invalidate the theory stated here.
also, a flat correction would greatly benefit the longer term bullish trend, as we would be able to build a very strong base up here, before the last push to 5000~6000 in the years ahead.
ps. if you wanted to try and catch some gains from the nikkei play, you could try picking up some december\january calls on $EWJ - they've some very low iv right now, and it could work out very nicely as a hedge against our flat corrective phase.
Short JapanAsia looked weak yesterday and they've been alternating up and down days...
So shorting Japan with next week's puts. Just 15 contracts for kicks and giggles.

India & Japan very bullish frm late 2020 -> Oil & Resources soarIndia (INDA) & Japan (EWJ) equities very bullish from late 2020 - helping Oil (USO) and Resources (DBC) to also soar.

Nikkei Powers HigherIt appears that my short term 27750 level was too timid, and Nikkei powered through the area like butter. The move in the index points to underlying strength and should see continuation higher. I am therefore updating my short term target to 28900 - this being the 1st Fibonacci projection level from the February March selloff. Stay long!

Major new uptrend in the Japanese marketsJapanese market being forgotten for decades is now sitting at all-time highs with rising 200DMA. It's building a small consolidation above the old highs. A possible long entry for the long term, potentially for years, unless the breakout collapses.

Nikkei ATHWhy is the Nikkei at all time high (ATH), lol. The Japanese economy can;t be doing that good, plus they;ve had negative interst rates for awhile now. Overbought on the daily...
Ridiculous, lol.

Japan vs. All-world Ex. USJapan relative the rest of the world (excluding the United States) is eyeing a new all-time relative high..

This Country’s Stock Market Is Ready To OutperformDiversification is one of the keys to growing and preserving wealth. Putting all of your eggs in one basket (pun intended) can be dangerous. Luckily, diversifying your investment portfolio has never been easier. There are more than 7,000 exchange-traded funds (ETFs) that provide investors with exposure to various markets and asset classes across the globe (international stocks, bonds, commodities, real estate, etc.). For investors that want to diversify their stock portfolios outside of the U.S., Japanese (ticker: EWJ) stocks represent an interesting buying opportunity.
While stock buybacks have slowed significantly among U.S. corporations in 2020 (down 25%), they’ve surged in Japan, rising 48% this year. Nonfinancial firms have around 285 trillion yen ($2.6 trillion) in currency and deposits (highest level in two decades). Japanese companies have increased their cash stockpile by ~100 trillion yen (33%) over the last decade, suggesting that corporations have plenty of room to continue returning capital to shareholders over the next few years. In addition, the valuation of Japanese stocks is attractive relative to the U.S. The price to earnings ratio on Japanese stocks is ~15x vs. ~17x multiple on U.S. equities.
Furthermore, investors are underinvested in Japanese equities. Over the last 5 years, investors have sold ~16 trillion yen worth of Japanese stock, after plowing ~25 trillion yen into Japenese stocks between 2012 and 2015. If (when) investors begin reinvesting funds to the region, Japenese stocks will receive a boost. Japanese companies have increased their profitability. Profits as a percentage of sales have doubled from 4% to 8% over the last five years.
More importantly, the Bank of Japan (BOJ) is the only developed country central bank that is actively involved in purchasing stocks. The BOJ is a top ten shareholder of more than 50% of publicly traded companies and has no plans of slowing down. In fact, early this month BOJ extended and doubled its purchases of Japanese ETFs- lifting its annual target of 6 trillion yen ($57 billion) to 12 trillion ($114 billion) as part of their aggressive monetary policy. This will continue driving demand (buying) for Japanese equities going forward.
Lastly, Prime Minister Shinzo Abe recently announced a ~$1 trillion (108 trillion yen) stimulus package. This is equal to 20% of Japan’s national GDP. Compared to the U.S. stimulus package of $2.2 trillion, which equates to only ~10% of GDP. This significant fiscal stimulus will support the Japanese economy as it deals with the coronavirus. Among other things, the government will provide more than $55 billion in cash payments to families and small and medium-sized businesses and $240 billion in interest-free loans. Japanese companies have strong balance sheets and our returning large amounts of capital to shareholders, in addition, Japanese fiscal and monetary is the most aggressive in the world. All of the necessary ingredients for Japanese stocks to move higher are in place. It’s time investors placed their (buy) order.
-Appo Agbamu, CFA
Nothing in this email is intended to serve as financial advice. Please do your own research.

Coronavirus Regional Long/Short Japan (EWJ) outperforms as Coronavirus cases are low (due to low testing), but country now on the verge of a massive virus outbreak, in line w/ EU & US.
Italy (EWI) lags DM, seen as new epicenter of Coronavirus. Country on lockdown, virus priced in (relative to Japan).
Italy also has sov debt & banking crisis overhang- but Japan also has massive sov debt & banking crisis, just not as widely publicized.
Banking/debt crisis aside, strictly from coming Coronavirus data reaction, RELATIVE pair trade:
Short EWJ (Japan) / Long EWI (Italy)
ETFs are FX hedged to mitigate some of USD vol interference.


Nikkei225 price action setuoLooking forward for further upside & correction PA, by 1st half of October '19.


M inflection point?USDJPY starting to turn downward again, continuation of multidecade trend. $SPY $EWJ


Long on Japanese EquitiesShould equities break down further I will buy at these levels. Note that today (Mar 25) it is resting at support but other equity indices eg US have further to fall, so I think more decline is possible. And if so this is where Id enter
