From Neckline to Target: Setting H&S Bearish Entries and ExitsUnderstanding the Head & Shoulders Breakdown
A bearish head and shoulders pattern gives traders a structured way to define entries and exits using price geometry rather than emotion. The pattern forms when a market transitions from strength to distribution, creating a left shoulder, a higher head, and then a lower right shoulder as momentum begins to fade. The neckline acts as the key support level that separates a developing pattern from a completed one.
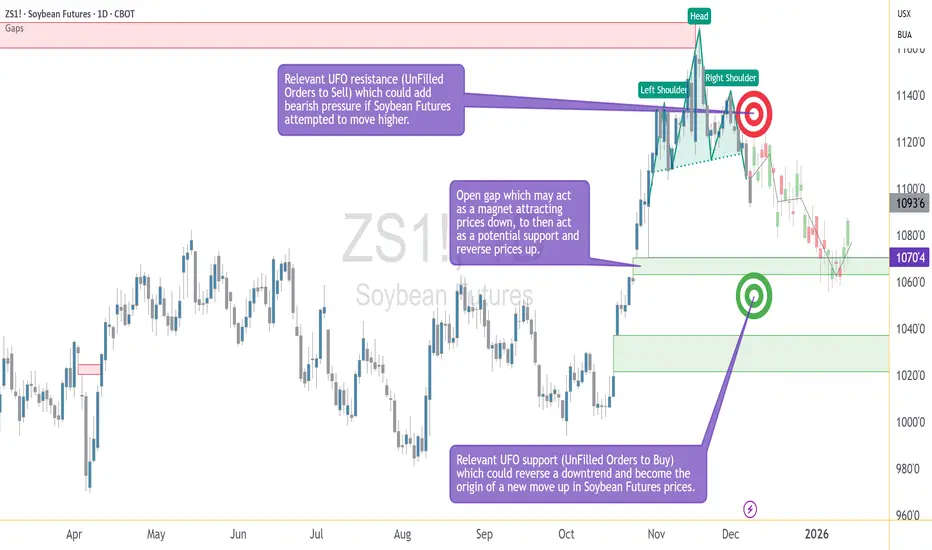
In the case study illustrated on the chart, the daily timeframe shows a fully developed head and shoulders structure that confirmed during the December 5 trading session, when price closed below the neckline. This type of close is often interpreted by traders as evidence that bearish participation has taken control of the pattern. Whether a trader enters immediately or waits for a retest, the priority becomes identifying the levels that will structure the trade: the area of invalidation, the downside objective, and the points where risk must be controlled.
A confirmed neckline break does not imply certainty about future price direction. Instead, it provides an organized framework—a map traders can use to define where their idea is considered valid and where it is considered invalid. The educational value of this pattern lies not in its ability to predict, but in its ability to help traders pre-plan actions with clarity.
Structuring the Bearish Entry: Neckline Retests and Resistance Zones
One of the most common approaches to trading a bearish head and shoulders is to monitor for a modest bounce back toward the neckline after the breakdown. Retests do not always occur, but when they do, many traders see them as opportunities to enter with more control over the distance between entry and stop.
In this example, price sits beneath a well-defined UFO resistance area between 1123 and 1136. This band aligns with a cluster of unfilled sell orders, which may reinforce bearish pressure if price attempts to climb. More importantly, the upper boundary of the zone—1136—serves as an objective point of invalidation. If price were to move above that level, the logic of the completed bearish structure would no longer hold. Therefore, traders could use this upper boundary as a stop-loss level. It is neither arbitrary nor emotional; it is derived directly from the structure.
This type of predefined invalidation is essential because even the cleanest technical patterns can fail. The purpose of using a pattern is not to guarantee the outcome, but to know exactly when the trade thesis no longer makes sense. In this framework, the neckline provides context for the entry, while the resistance zone provides clarity for where the idea is wrong.
Defining the Target: Gap Alignment and Technical Confluence
After establishing where a trade becomes invalid, traders turn to the question of where it becomes complete. In pattern-based trading, target selection often blends classical measurement rules with the identification of technical areas where price has reason to react. In this case study, the downside objective centers on 1070'4, where two important elements align.
First, there is an open gap at this price level. Gaps frequently attract price because they represent prior imbalances in trading activity—areas where the market moved too quickly for participants to fully transact. When price revisits such a location, it becomes a zone where activity may increase. Second, the gap coincides with a region of unfilled buy orders that may serve as a UFO support area. When gaps and demand zones overlap, the confluence strengthens the rationale for using the level as a target.
Because the bearish pattern is already confirmed, traders using this structure may calculate a reward-to-risk ratio by comparing the distance from the entry zone to the stop (near 1136) and the distance from the entry zone to the target (1070'4). The role of the target is not to predict where price will go, but to anchor the trade in a predefined and measurable plan. It transforms the setup into a risk-managed scenario rather than an open-ended directional hope.
Understanding Contract Specs, Margin, and Risk Management
Traders using standardized futures contracts must structure their decisions around contract size, tick value, and margin requirements. The chart example in this idea uses the standard ZS contract, which represents 5,000 bushels. The micro contract (MZS) represents 500 bushels. This difference directly affects position sizing and the dollar impact of each tick. Because margin requirements vary over time, traders should always check the latest values before entering any position.
Tick (Minimum Price Fluctuation:
ZS: 1/4 of one cent (0.0025) per bushel = $12.50 per contract
MZS: 0.0050 per bushel = $2.50 per contract
Current Margin Requirements:
ZS: $2,000 per contract
MZS: $200 per contract
A key benefit of having two contract sizes available is flexibility. Traders seeking to maintain disciplined risk parameters often use micro contracts to fine-tune exposure, ensuring that the stop-loss level does not exceed their predefined risk tolerance. The objective of the head and shoulders pattern is not merely to identify a direction but to help traders organize their plan around risk boundaries. Knowing the contract’s characteristics enables the trader to size positions correctly.
Risk management remains the foundation of pattern-based approaches. Price can behave unpredictably, even when the chart seems decisive. This is why traders emphasize position sizing, controlled leverage, and strict adherence to the stop-loss level. The goal is not to avoid losses entirely but to keep them manageable and consistent. A well-constructed head and shoulders strategy relies not only on identifying the pattern but on respecting the risk parameters that accompany it.
Bringing It All Together: Structure, Context, and Discipline
The chart included in this idea illustrates the essential elements of the bearish head and shoulders setup: the left shoulder, head, and right shoulder; the neckline break; the gap at 1070'4; and the resistance band between 1123 and 1136. These levels form the backbone of a structured trading plan. Rather than reacting to market movement in real time, traders can use these predefined reference points to guide decision-making with consistency.
The purpose of this article is educational. It demonstrates how entries, exits, and risk parameters can be structured around a classical bearish head and shoulders pattern, how confluence strengthens downside targets, and how contract specifications help traders align position size with their risk tolerance. Above all, it shows that disciplined planning matters more than attempting to anticipate every price movement.
When charting futures, the data provided could be delayed. Traders working with the ticker symbols discussed in this idea may prefer to use CME Group real-time data plan on TradingView: www.tradingview.com - This consideration is particularly important for shorter-term traders, whereas it may be less critical for those focused on longer-term trading strategies.
General Disclaimer:
The trade ideas presented herein are solely for illustrative purposes forming a part of a case study intended to demonstrate key principles in risk management within the context of the specific market scenarios discussed. These ideas are not to be interpreted as investment recommendations or financial advice. They do not endorse or promote any specific trading strategies, financial products, or services. The information provided is based on data believed to be reliable; however, its accuracy or completeness cannot be guaranteed. Trading in financial markets involves risks, including the potential loss of principal. Each individual should conduct their own research and consult with professional financial advisors before making any investment decisions. The author or publisher of this content bears no responsibility for any actions taken based on the information provided or for any resultant financial or other losses.
Exits
Exit Psychology 3/5: The Trailing Stop – Patience vs ProtectionNOTE – This is a post on Mindset and emotion. It is NOT a Trade idea or strategy designed to make you money. If anything, I’m taking the time here to post as an effort to help you preserve your capital, energy and will so that you are able to execute your own trading system as best you can from a place of calm, patience and confidence.
This 5-part series on the Psychology of Exits is inspired by TradingView’s recent post “The Stop-Loss Dilemma.” Link to the original post at the end of this article.
Consider this next scenario:
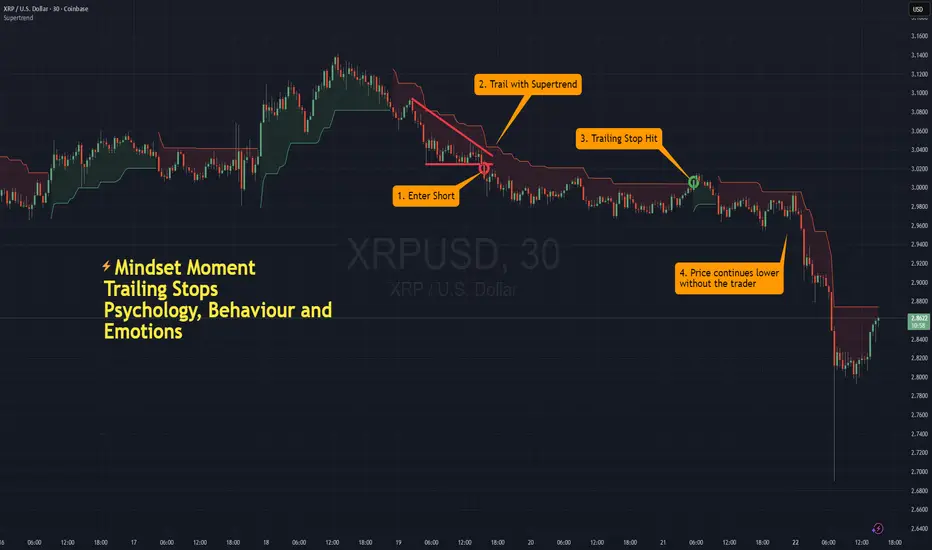
You’re in a trade and it’s working. Price is moving in your favour. You trail your stop in line with your plan. The trade moves your way and your trailing stop has started to lock in profit. Relief washes over you for a moment. Then price pulls back, tags your stop by a fraction and runs again without you on board.
Frustration rises: you protected your gains, but cut your winner short.
How behaviour shows up with trailing stops:
Trailing stops can be powerful, but the way we use them often reveals our mindset:
Moving the stop up too quickly : Driven by the belief that profit isn’t real until it’s banked.
Keeping it too loose : Rooted in the hope that one big win will make the difference.
Adjusting based on emotion rather than structure : Reflects the belief that constant management equals control.
Using the trail as a safety net when confidence fades: “I don’t trust myself to exit well without this crutch.”
The psychology underneath:
These surface behaviours are often driven by deeper beliefs and biases - the silent programs running in the background:
Scarcity belief : “If I don’t protect every dollar now, it will disappear.” This drives over-tightening.
Illusion of control: Adjusting the trail gives the feeling of mastery, even if it undermines expectancy.
Hero trade belief : The idea that one outsized win can “fix” everything encourages overly loose trails.
Identity fusion : For some, holding onto profit = being a “good” trader; giving it back = failure.
Comfort-seeking : The nervous system experiences unrealised gains as already “yours,” so trailing becomes a way to protect identity as much as capital.
Why traders use trailing stops:
There are good reasons too. Trailing stops can:
Protect profits without fully closing the position.
Allow participation in bigger trends without micromanaging.
Reduce stress when you can’t watch the screen constantly.
But just like initial and break-even stops, the challenge isn’t the tool, it’s the psychology behind how and when we use it.
Practical tips … the How:
The point isn’t the exact method you use, but whether your adjustment comes from structure or from stress. A few ways to build awareness:
Define in advance what conditions justify moving the stop - structure, ATR, trend shift - not just feelings.
Notice the difference between protecting and controlling. One preserves edge, the other chokes it.
Journal: How many times has moving the trail early cost you a bigger win? Seeing patterns reduces self-deception.
Practice nervous system awareness : when you feel the urge to “lock in,” pause and observe the sensation in your body before acting. Sometimes that’s enough to prevent a premature cut.
Reframe:
A trailing stop isn’t a way to eliminate uncertainty. It’s a tool to balance patience with protection. Used well, it keeps you in the move long enough to benefit, while still defining where you’ll step aside.
Closing thought:
The art of the trailing stop isn’t about perfection. It’s about holding the tension between fear of giving back and faith in your process and learning to stay in that space without over-managing.
A quick note to those who have signed up to the free newsletter on our website: please be sure to check your spam folder in case it’s found its way there.
A link to the previous post in this series - Exit Psychology 2/5 : The Break-Even Stop – Comfort or Illusion
A link to the original article as promised:
This is Part 3 of the Psychology of Exits series .
👉 Follow and stay tuned for Part 4: The Profit Target – Certainty vs. Potential .
a simple strategy for entrys for non traders - scalping the market always with a stop loss ... Start small always ..... risk only 2% of your portfolio ....
and for long term investing ... dollar cost average .... simply buy good companys dont put more than 5% of your portfolio on any one asset coin etc ... enjoy!!!!

US30 makes a move! The 3 ways to enter the market and whenus30 finally makes a move to the downside. Watch carefully as i show you how and when to enter the market. I include a little nugget on when price normally makes an impulsive move either in an uptrend or a downtrend. Pay attention to price action. The candles always tells you what is going on and what is going to happen. When you see what I have described in this video, have confidence in what you see and make your move. I am currently waiting for price to reach that next key level of resistance by my supply zone, and close to my key level of 28000. I hope she will break up, but price may break below. Adapt to the market and flow with it. I do have my bias, but i am not married to it. I am just going to follow what she tells me she is doing.

EURUSD, Trading the TrendLooking at the Euro’s value in US dollars (EURUSD) to find the general trend and potential entries and exits.
We can see historically, due to the momentum of the trend, that using a trend indicator like our Directional Bias Indicator has led to having a rather successful long./ short bias.
Above the yellow line, the bar color is green, and the bias is long. Below, bar color is red, and bias is short.
We always want to trade the direction of the trend, but in general, we will want to enter and exit positions along the trend as well.
To find entries and exits, we can use our Triggers indicator.
In an uptrend, we go long and take profits at L tp (purple arrow), and in a downtrend, we got short and take profits on S tp (blue arrow).
Likewise, if we want to find re-entry, we can look for the purple x marked L e for a long entry, and a blue x marked S e for a short entry.
In other words, we want to first and foremost listen to the long signals from Triggers in an uptrend and the short signals from Triggers in a downtrend.
Right now we have a long bias according to Directional Bias and a long entry according to Triggers. A cross below the yellow line means a short bias from Directional Bias and that means the long is invalidated. Otherwise, the bias from Triggers and Directional Bias is currently bullish on the US dollar against the Euro at the moment... although looking at how close we are to the previous range as defined by Directional Bias, that could change quickly.
