Ethereum (ETH/USDT) Breakout Incoming? Eyeing $4,000 TargetEthereum (ETH/USDT) 4H Analysis: Breakout Toward $4,000?
Key Observations:
1. Potential Double Bottom Formation:
ETH appears to be forming a double bottom near the $3,000 support level, indicating a potential bullish reversal.
2. 200 EMA Resistance:
The 200 EMA ($3,324) is acting as resistance. A clear breakout above this level could confirm bullish momentum.
3. RSI Indicates Momentum Shift:
The Relative Strength Index (RSI) is at 56.85, trending upward, suggesting increasing buying pressure but not yet overbought.
4. Potential Scenarios:
Bullish Breakout: If ETH breaks and holds above $3,324, the next target could be around $4,000.
Rejection & Retest: If ETH faces rejection at $3,324, it may retest $3,000 before another attempt higher.
Conclusion:
ETH is showing bullish potential, especially if it clears $3,324 resistance.
A confirmed breakout could trigger a strong rally toward $3,800-$4,000.
Traders should watch for volume confirmation to validate the move.
Exness

EUR/JPY 4H Chart Analysis – Gap Fill Incoming?EUR/JPY 4H Chart Analysis 🏆📊
🚀 Current Price: 162.308
📍 200 EMA: 162.099 (Dynamic Support)
🔥 Key Levels & Insights:
🟥 Major Support Zone (Red Area - 162.000)
✅ Price recently bounced off this level, showing strong buying pressure.
✅ If price holds above 162.000, a bullish continuation is likely.
📈 Gap Zone (Orange - 163.000 - 163.500)
🔍 There’s a price imbalance above, meaning price could be drawn towards it.
🔼 Gaps act as magnets! A move up to fill the gap is likely.
📊 200 EMA (162.099) - Crucial Level
🚦 Price is hovering above the 200 EMA. If it remains above, we can expect further bullish momentum.
🔮 Price Prediction & Trade Idea
📌 If price breaks and holds above 162.500, expect a 🚀 move towards 163.500.
📌 Rejection from 163.500 could bring a pullback 📉 back to 162.500.
🚨 Risk Alert:
🔻 If price drops below 162.000, bears might take control, pushing it to 161.500 or lower.
💡 Final Thoughts:
👉 Bulls 🐂 need to break 162.500 to push towards 163.500.
👉 Bears 🐻 will gain control if price loses 162.000.
🔥 Verdict:
✅ Bullish Bias if price stays above 162.000.
🚀 Target: 163.500 (Gap Fill).
🔻 Invalidation: Below 162.000.

Bitcoin (BTC/USDT) Symmetrical Triangle Analysis: Next move?Bitcoin (BTC/USDT) 4H Chart Analysis
Key Observations:
1. Symmetrical Triangle Pattern:
The chart shows a symmetrical triangle formation, characterized by converging trendlines.
This pattern typically signals a breakout, but the direction (up or down) depends on market momentum.
2. Current Price Action:
BTC is trading around $102,979.98 at the time of the chart.
It is above the 200 EMA ($100,003.64), indicating bullish strength.
The price recently bounced off support and is moving towards resistance.
3. Support and Resistance Levels:
Support: Around $97,785.55 (blue line).
Resistance: Around $109,636.60 (blue line).
4. Potential Scenarios:
Bullish Breakout:
If BTC breaks above the upper trendline, it may rally towards $109,636.60 or higher.
A confirmed breakout could push BTC to $112,500+.
Bearish Breakdown:
If BTC rejects at resistance and breaks downward, it could retest the $100,000 level or lower.
A breakdown could target $97,785.55 or even $95,000.
Final Thoughts:
Watch for a breakout or breakdown from the triangle pattern.
Volume is crucial—a high-volume breakout confirms strength, while low volume can indicate a fakeout.
If BTC stays above $100,000 (200 EMA support), the bullish bias remains intact.

XAUUSD Analysis: Potential Bearish Pullback Towards Key Support📉 XAUUSD Daily Analysis 🔍
🚨 Potential for a Bearish Pullback 🚨
Gold (XAUUSD) is showing signs of a potential downward move after rejecting a key resistance level. If this momentum continues, we could see the price heading towards the support zone at 2680/2670.
💡 Key Insights:
📌 Market rejection at resistance = possible bearish momentum.
📌 Target support area: 2680/2670.
📌 Risk Management: Stick to 1-2% risk on trades.
⚠️ Historical Note:
When the market last hit an all-time high, it saw a sharp one-day drop. Stay cautious!
💬 Disclaimer: This is for educational purposes only. Always trade responsibly and manage your risk effectively.

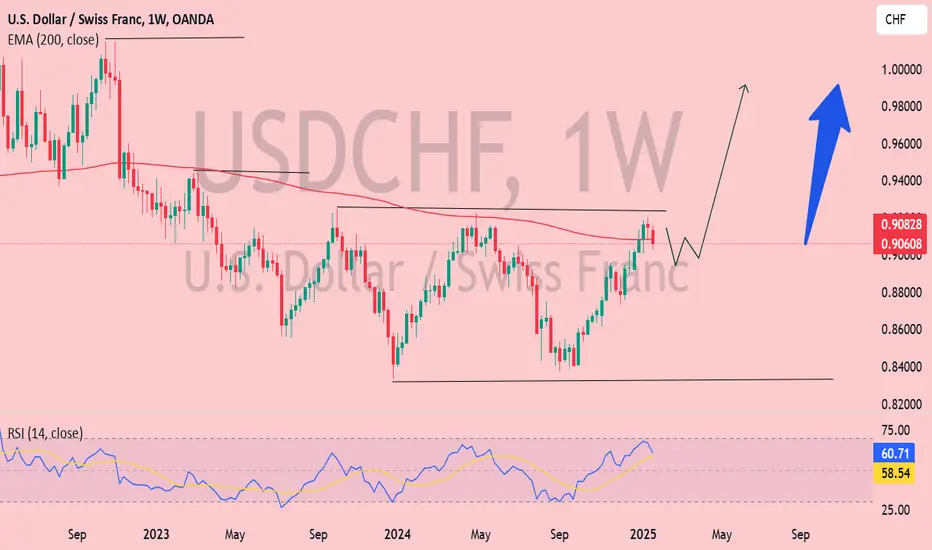
USD/CHF Poised for a Bullish Breakout: Path to Parity Bullish Scenario 🚀📈
1. Breakout Above the EMA (200) 🔺:
If the price closes above the 200-week EMA (0.9082), it could confirm a long-term bullish trend reversal.
A strong push may target key levels like 0.9500 and eventually 1.0000 (parity) 🎯, as shown by the projection arrow.
2. RSI Support 💪:
The RSI above 50 indicates that buyers are gaining momentum.
If RSI trends toward 70, it signals even stronger bullish momentum ✅📊.
3. Higher Highs and Higher Lows 📶:
The chart is forming higher highs and higher lows, a classic signal of an uptrend.
This pattern supports a move toward higher price levels 🚀.
🔥 Key Takeaway: A breakout above the EMA could spark a powerful rally, with parity (1.0000) as a major psychological target.
USD/JPY Market Update: Support Holds and Resistance Levels AheadUSD/JPY has held firm at the support level and is now returning to a buy zone. Currently, the market is at 156.500, with the next resistance level set at 159.000.
I’ve explained the market clearly in my chart analysis for easier understanding.
If anyone has questions, feel free to ask in the comments or send me a message in my inbox.
Thank you for your support—like, comment, and follow for more updates!

Trend Reversal in Progress Potential Pullback Before Further Up!Hello Everybody!
After experiencing a sharp decline, this currency pair has shifted momentum, breaking through its downward trendline and climbing higher. It is now expected that the price will retreat slightly, testing the broken trendline, before continuing its upward trajectory toward the designated resistance level.
please like follow comments and share this idea thanks for love.

ETH/USDT Setup: Trendline retest before next moveAfter a strong bullish move, ETH/USDT 🔥 broke below its downward trendline 📉 and started moving lower. A potential pullback to retest the broken trendline ⚠️ could be on the horizon before the price resumes its downward path, targeting the key support level 🛑. Traders should watch this zone closely for opportunities! 📊💡

Gold Price Forecast: Key Levels to Watch !!Gold Price Analysis: 🔑 Key Zones and 📉 Potential Reversal at MA200
1️⃣ Resistance Zone 🟥:
The red-highlighted area marks a strong resistance zone. A breakout 🚀 above this level could lead to bullish momentum.
2️⃣ Liquidity Zones 💧:
The "In LQ" region shows where liquidity may be resting, suggesting possible retracements or reversals near this point.
3️⃣ 200 EMA Support 📊:
The MA200 (2,734.059) is a critical support level. A breakdown 🔻 here could send prices lower, testing further support levels.
📈 Potential Scenarios:
🔼 Bullish: Break above resistance 🟥 with higher highs.
🔽 Bearish: Rejection from resistance 🟥 leading to a drop toward the MA200 support 📉.
Watch these levels closely! 🔎

USOIL remains under pressure USOIL remains under pressure, with the price approaching the support-turned-resistance zone at 72.00, which coincides with the 100% Fibonacci extension level. A reversal below the 72.00 resistance could prompt a further decline and a potential retest of the 66.00 support zone. The Ichimoku cloud also shows bearish pressure, indicating the potential for a further decline.
Conversely, a break above 72.00 could prompt a further rise, with 75.00 as the next potential resistance.
Analysis by: Li Xing Gan, Financial Market Strategist at Exness


GOLD UPDATE 17/7 WEEKplan gold this week please.
The trend continues to support gold's price increase in the weekly candle frame, the weekly candle closes, but the force is increasing gradually. Moreover, gold has not tested the weekly top once again from the long slide above the 208x level, so now continue. continue to hit the gold up according to the previous big frame trend.
In the short term, there are two buy zones: 50 53 and 45 43.
In addition, last month's CPI and PMI data were much worse than expected, causing large RMB to expect that the FED will not raise interest rates at least for the next 12 months to maintain a stable economy.
-----
In addition, in my experience, Friday decreases, Monday increases all day.

GbpusdI'm expecting an impulsive move to the upside ..sits a 📐 on smaller timeframes which awaits a long candkestick

EURUSD LONG OPPORTUNITY after the bulls rested for a few day it seems they are back, Its a Monday morning a not so good day to be fishing for pips, however the rules states trade your set up so lets look in to this. if you intend to take it do so with proper risk management

GOLD ZONES THAT GIVES YOU MORE PROFITSThe zones are high volatility zones . Gold must respect these zones and you can get more profits .
Lets see how gold can play in these zones.

XAUUSD 13/12 : sell view to 1766-1745XAUUSD 13/12
Sell 1786-1790, TP 1766-1745, the best stoploss to break this setup is 1813. However, you can put SL at 1796, in the bad situation when this SL hit, you can wait to sell again
At current price of 1783, you can sell a small trade first if you do not have any sell trades opening now

GOLD sell view with TPs 1666-1656-1650GOLD sell view with TPs 1666-1656-1650
My techical setup is based on R&D + AO divergence

Gold this week analysis H4 Here we don't need to argue it's straight forward, gold from 1817.000 it's a strong buy ,
Buy limit gold @1817.00
Sl @1815.550 💯 Tp@1834.000
4H ,lot 0.05
Add more trade once you enter profit then monitor your sl inside profit .
Thank me later

Daily analysis EURUSDExpecting a push to the upwards direction (Bullish Trend)
Will be holding these orders for the whole Expecting about 30% profits 📈fingers crossed

📉 FOREX : 🚀 XAU / USD 🚀
SELL : 1859 - 1861
TARGET 1 : 1855
TARGET 2 : 1850
TARGET 3 : 1845
Stop Loss : 1868

Gold should sell to 1800Okay so gold sells to the support level 1800
....where we will push back up.
This time we push to 1850
If you find my idea useful like and maybe share your comment


Gold trading rangeI sell Gold right now to 1765....where I place buy limit orders ....to push back up
