AUDUSD Eyes 0.64800 Support as Bullish Structure Holds FirmHey Traders,
In today’s session, we’re closely monitoring AUDUSD for a potential buying opportunity around the 0.64800 zone. The pair continues to trade within a broader uptrend, and the current pullback appears to be a healthy correction toward a key support and resistance confluence near 0.64800.
A sustained reaction from this level could reaffirm the bullish structure, opening the door for a continuation toward recent highs if momentum aligns with a weaker USD backdrop.
Trade safe,
Joe.
F-EUR

EURUSD possible ideaEURUSD is been overall bullish. It had recently made a deep retracement back into a demand it left behind during expansion. It has currently taken out all internal liquidity preceded by a rejection off the demand, giving an internal shift of structure to show the beginning of a potential bullish move to target the latest weak swing high.

Bearish reversal?The Fiber (EUR/USD) is rising towards the pivot which is a pullback resistance, and could drop to the 1st support which acts as an overlap support.
Pivot: 1.1689
1st Support: 1.1416
1st Resistance: 1.1868
Disclaimer:
The above opinions given constitute general market commentary, and do not constitute the opinion or advice of IC Markets or any form of personal or investment advice.
Any opinions, news, research, analyses, prices, other information, or links to third-party sites contained on this website are provided on an "as-is" basis, are intended only to be informative, is not an advice nor a recommendation, nor research, or a record of our trading prices, or an offer of, or solicitation for a transaction in any financial instrument and thus should not be treated as such. The information provided does not involve any specific investment objectives, financial situation and needs of any specific person who may receive it. Please be aware, that past performance is not a reliable indicator of future performance and/or results. Past Performance or Forward-looking scenarios based upon the reasonable beliefs of the third-party provider are not a guarantee of future performance. Actual results may differ materially from those anticipated in forward-looking or past performance statements. IC Markets makes no representation or warranty and assumes no liability as to the accuracy or completeness of the information provided, nor any loss arising from any investment based on a recommendation, forecast or any information supplied by any third-party.

EURUSD H4 | Sustained Bullish Push AheadEUR/USD is falling towards the buy entry, which is an overlap support and could bounce from this level to the upside.
Buy entry is at 1.1587, whichis an overlap support.
Stop loss is at 1.1535, whichis a pullback support.
Take profit is at 1.1665, which is a pullback resistance that aligns with the 50% Fibonacci retracement.
High Risk Investment Warning
Trading Forex/CFDs on margin carries a high level of risk and may not be suitable for all investors. Leverage can work against you.
Stratos Markets Limited (tradu.com ):
CFDs are complex instruments and come with a high risk of losing money rapidly due to leverage. 65% of retail investor accounts lose money when trading CFDs with this provider. You should consider whether you understand how CFDs work and whether you can afford to take the high risk of losing your money.
Stratos Europe Ltd (tradu.com ):
CFDs are complex instruments and come with a high risk of losing money rapidly due to leverage. 66% of retail investor accounts lose money when trading CFDs with this provider. You should consider whether you understand how CFDs work and whether you can afford to take the high risk of losing your money.
Stratos Global LLC (tradu.com ):
Losses can exceed deposits.
Please be advised that the information presented on TradingView is provided to Tradu (‘Company’, ‘we’) by a third-party provider (‘TFA Global Pte Ltd’). Please be reminded that you are solely responsible for the trading decisions on your account. There is a very high degree of risk involved in trading. Any information and/or content is intended entirely for research, educational and informational purposes only and does not constitute investment or consultation advice or investment strategy. The information is not tailored to the investment needs of any specific person and therefore does not involve a consideration of any of the investment objectives, financial situation or needs of any viewer that may receive it. Kindly also note that past performance is not a reliable indicator of future results. Actual results may differ materially from those anticipated in forward-looking or past performance statements. We assume no liability as to the accuracy or completeness of any of the information and/or content provided herein and the Company cannot be held responsible for any omission, mistake nor for any loss or damage including without limitation to any loss of profit which may arise from reliance on any information supplied by TFA Global Pte Ltd.
The speaker(s) is neither an employee, agent nor representative of Tradu and is therefore acting independently. The opinions given are their own, constitute general market commentary, and do not constitute the opinion or advice of Tradu or any form of personal or investment advice. Tradu neither endorses nor guarantees offerings of third-party speakers, nor is Tradu responsible for the content, veracity or opinions of third-party speakers, presenters or participants.

Bearish reversal off 50% Fibonacci resistance?EUR/USD is rising towards the resistance level, which is a pullback resistance that aligns with the 50% Fibonacci retracement and could reverse from this level to our take profit.
Entry: 1.1662
Why we like it:
There is a pullback resistance that aligns with the 50% Fibonacci retracement.
Stop loss: 1.1719
Why we like it:
There is an overlap resistance that is slightly below the 78.6% Fibonacci retracement.
Take profit: 1.1570
Why we like it:
There is an overlap support level.
Enjoying your TradingView experience? Review us!
Please be advised that the information presented on TradingView is provided to Vantage (‘Vantage Global Limited’, ‘we’) by a third-party provider (‘Everest Fortune Group’). Please be reminded that you are solely responsible for the trading decisions on your account. There is a very high degree of risk involved in trading. Any information and/or content is intended entirely for research, educational and informational purposes only and does not constitute investment or consultation advice or investment strategy. The information is not tailored to the investment needs of any specific person and therefore does not involve a consideration of any of the investment objectives, financial situation or needs of any viewer that may receive it. Kindly also note that past performance is not a reliable indicator of future results. Actual results may differ materially from those anticipated in forward-looking or past performance statements. We assume no liability as to the accuracy or completeness of any of the information and/or content provided herein and the Company cannot be held responsible for any omission, mistake nor for any loss or damage including without limitation to any loss of profit which may arise from reliance on any information supplied by Everest Fortune Group.

#031: EUR/GBP Long Investment Opportunity
In recent movements on EUR/GBP, the price has shown a corrective trend: it attempted to rebound towards medium resistance levels, but encountered significant obstacles. Hello, I'm Forex Trader Andrea Russo, an independent trader and prop trader with $200,000 in capital under management, and I thank you in advance for your time.
There is a narrative in which the market could breathe (correct) before attempting a new attack on the main resistance level. In this scenario, rather than immediately entering "at the current price," I preferred to place a BUY LIMIT in an already identified technical support zone, waiting for the market to decline there and "requalify" the zone as a starting point.
The market has shown weakness in the short term: it has retraced from high levels, but it is not yet clear whether buyers have taken over.
I only want to buy if the price shows that the zone has held. This happens if it drops to the level, hits the BUY LIMIT, and then reverses.
The retail position is now in a "COUNTERVAILING" pattern and therefore in my favor. I'll update you if there are any changes to the ongoing trade.

EURUSD More selling ahead after the 1D MA100 rejection.The EURUSD pair has been trading within a (red) Channel Down since the September 17 High, which is so far technically the Bearish Leg of the last valid Channel Up (since the July 01 High).
The break below its 1D MA100 (red trend-line) has the potential to start a new yearly Bear Cycle but on the short-term even, today's 1D MA100 re-test and rejection, validates the continuation of the Channel Down.
Given that the first Bearish Leg was -2.30%, we expect at least another such decline from the recent Lower High, which gives us a 1.15100 Target.
-------------------------------------------------------------------------------
** Please LIKE 👍, FOLLOW ✅, SHARE 🙌 and COMMENT ✍ if you enjoy this idea! Also share your ideas and charts in the comments section below! This is best way to keep it relevant, support us, keep the content here free and allow the idea to reach as many people as possible. **
-------------------------------------------------------------------------------
💸💸💸💸💸💸
👇 👇 👇 👇 👇 👇

Bearish drop off?EUR/JPY has rejected off the resistance level which is a pullback resistance that lines up with the 50% Fibonacci retracement and could drop from this level to our take profit.
Entry: 176.95
Why we like it:
There is a pullback resistance that aligns with the 50% Fibonacci retracement.
Stop loss: 177.72
Why we like it:
There is a swing high resistance level.
Take profit: 174.95
Why we like it:
There is a swing high resistance level.
Enjoying your TradingView experience? Review us!
Please be advised that the information presented on TradingView is provided to Vantage (‘Vantage Global Limited’, ‘we’) by a third-party provider (‘Everest Fortune Group’). Please be reminded that you are solely responsible for the trading decisions on your account. There is a very high degree of risk involved in trading. Any information and/or content is intended entirely for research, educational and informational purposes only and does not constitute investment or consultation advice or investment strategy. The information is not tailored to the investment needs of any specific person and therefore does not involve a consideration of any of the investment objectives, financial situation or needs of any viewer that may receive it. Kindly also note that past performance is not a reliable indicator of future results. Actual results may differ materially from those anticipated in forward-looking or past performance statements. We assume no liability as to the accuracy or completeness of any of the information and/or content provided herein and the Company cannot be held responsible for any omission, mistake nor for any loss or damage including without limitation to any loss of profit which may arise from reliance on any information supplied by Everest Fortune Group.

EURJPY | MarketoutlookThe policy divergence between the US Fed and SNB supports the pair at lower levels.
Jobless claims dropped to 227,000 for the week ending October 19, down from 242,000 the week before, suggesting some stability in the labor market. The four-week moving average rose by 6,750, reaching 231,000, which indicates that jobless claims are still showing fluctuations despite the recent decline.
The S&P Global Flash U.S. Manufacturing PMI increased slightly to 47.8 in October, up from 47.3 in September. However, this still shows that manufacturing activity is contracting for the fourth month in a row. On the other hand, the Flash Services PMI rose to 51.5, indicating modest growth in the services sector, which is important since it makes up a large part of the U.S. economy.

eurusdIn this case, it reacted to the daily trend line.
No new lows were recorded on the 4-hour timeframe.
We will wait to see the reaction to the 1-hour high.
If the 1-hour high is broken, we can buy with a good risk-reward.

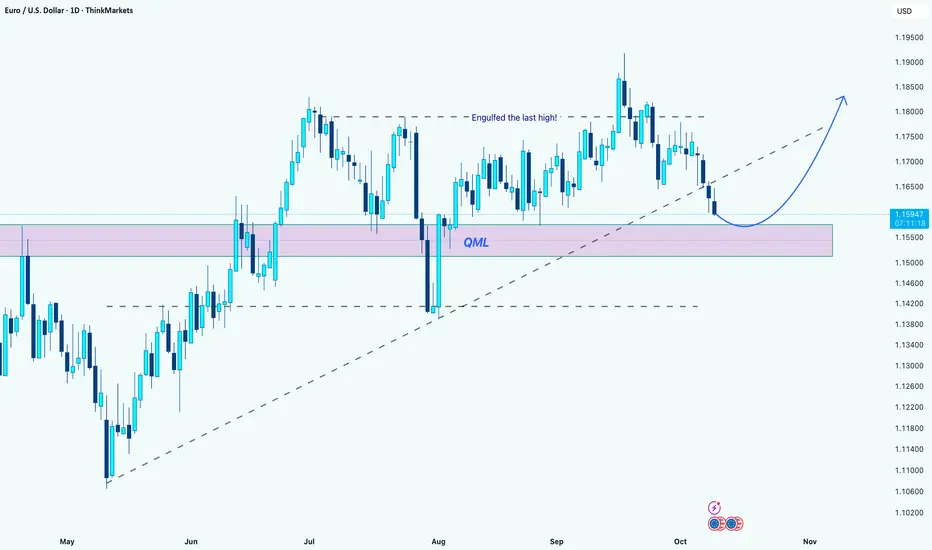
EUR/USD: Retesting QML Zone for a Potential Bullish ReversalHi Guys!
After breaking out from the previous range, EUR/USD has been respecting the ascending trendline quite well. Recently, the price pulled back toward the QML zone (marked in purple), which has acted as a strong demand area in the past.
We can see that price engulfed the last high before starting this correction phase, which indicates buyers are still dominant in the larger structure. Now the pair is retesting this demand area and the trendline simultaneously.
As long as the QML zone holds, I expect a reversal toward 1.175–1.185 in the coming days.
However, a clean break below 1.1550 would invalidate this setup and open the door for a deeper correction.
Bias: Bullish from demand zone
Key levels to watch:
Support: 1.1550 – 1.1580
Resistance: 1.1750 / 1.1850
Disclaimer: As part of ThinkMarkets’ Influencer Program, I am sponsored to share and publish their charts in my analysis.
Trend change in EURCAD and the start of a decline and correctionHello my friends. I hope you are full of sweet profits.
In the EURCAD currency pair, a 5-wave cycle has been completed. According to Elliott Wave 5, this cycle has ended with a diagonal ending move (a wedge pattern in classic technical analysis), and the classic trend line has also been broken by a strong candle on the daily time frame and closed below this line.
Under these conditions, and given the change in the movement shape and the formation of a pivot, we expect a downward and corrective movement in the EURCAD currency pair after the price pullback to the broken trend line.
From now on, traders can be market sellers in this currency pair. Friends, after some analysis and the formation of new waves from the corrective trend, I will update the continuation of the trend. So follow me so you don't miss the trading opportunities of the continuation of the trend.
Dear friends, follow my page so you don't miss my next analysis and be the first to reach a low-risk and successful trading position.
Please don't forget risk management and capital management. Be happy and profitable.
سلام دوستان من. امیدوارم پر از سود های شیرین باشید.
در جفت ارز EURCAD یک سیکل ۵ موج تکمیل شده است. از نظر الیوت موج ۵ این سیکل با یک حرکت اندینگ دیاگونال (الگوی گوه در تحلیل تکنیکال کلاسیک) به پایان رسیده است و خط روند کلاسیک نیز در تایم روزانه با کندلی قدرتمند شکسته است و زیر این خط کلوز داده است.
با این شرایط و با توجه به تغییر شکل حرکت و تشکیل پیوت، انتظار داریم در جفت ارز eurcad قیمت پس از پولبک دادن به خط روند شکسته شده یک حرکت نزولی و اصلاحی شکل گیرد.
از این به بعد تریدر ها در این جفت ارز میتوان سِلِر بازار باشند. دوستان با گذشت مقداری از تحلیل و شکل گیری امواج جدید از روند اصلاحی بروزرسانی ادامه روند رو انجام میدم. پس من رو فالو کن که موقعیت های معاملاتی ادامه روند رو از دست ندید.
دوستان عزیز برای این که تحلیل های بعدی من رو از دست ندید صفحه من رو فالو کنید تا اولین نفری باشی که به موقعیت معاملاتی کم ریسک و موفق دست پیدا میکنی.
لطفا مدیریت ریسک و مدیریت سرمایه را فراموش نکنید. خوشحال و پر سود باشید.

EURGBP Shifting to long-term Bearish.The EURGBP pair gave us a very efficient Channel Up buy signal last time (July 11, see chart below) that quickly hit our 0.87400 Target:
That pattern then broke and now we shift back to the longer term dynamics of the market as the trend is shifting from bullish to bearish. The strongest bearish indicator at the moment is the 1D RSI which has been on a Lower Highs Bearish Divergence for months, in contrast to the pair's Higher Highs.
The build up pattern to this (Channel Up into Channel Down following a 1D RSI Bearish Divergence) is similar to the 2022 - 2023 sequence. That fractal turned into a Channel Down following the first Lower High that initially formed a (temporary) Low marginally above the 0.618 Fibonacci retracement level.
As a result, we shift to long-term bearish on the EURGBP pair, targeting 0.84500.
-------------------------------------------------------------------------------
** Please LIKE 👍, FOLLOW ✅, SHARE 🙌 and COMMENT ✍ if you enjoy this idea! Also share your ideas and charts in the comments section below! This is best way to keep it relevant, support us, keep the content here free and allow the idea to reach as many people as possible. **
-------------------------------------------------------------------------------
💸💸💸💸💸💸
👇 👇 👇 👇 👇 👇

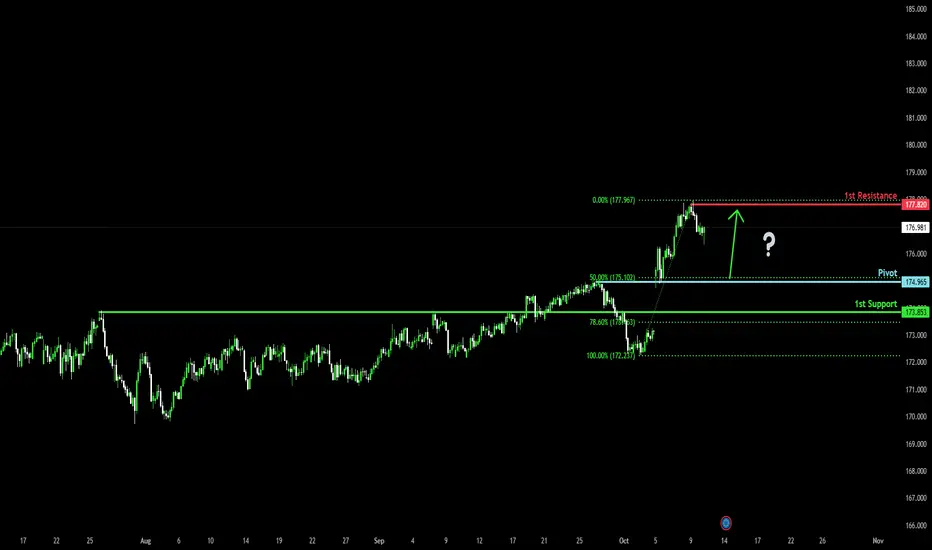
Potential bullish bounce?EUR/JPY is falling towards the pivot, which acts as an overlap support that aligns with the 50% Fibonacci retracemnt and could bounce to the swing high resistance.
Pivot: 174.96
1st Support: 173.85
1st Resistance: 177.82
Disclaimer:
The above opinions given constitute general market commentary, and do not constitute the opinion or advice of IC Markets or any form of personal or investment advice.
Any opinions, news, research, analyses, prices, other information, or links to third-party sites contained on this website are provided on an "as-is" basis, are intended only to be informative, is not an advice nor a recommendation, nor research, or a record of our trading prices, or an offer of, or solicitation for a transaction in any financial instrument and thus should not be treated as such. The information provided does not involve any specific investment objectives, financial situation and needs of any specific person who may receive it. Please be aware, that past performance is not a reliable indicator of future performance and/or results. Past Performance or Forward-looking scenarios based upon the reasonable beliefs of the third-party provider are not a guarantee of future performance. Actual results may differ materially from those anticipated in forward-looking or past performance statements. IC Markets makes no representation or warranty and assumes no liability as to the accuracy or completeness of the information provided, nor any loss arising from any investment based on a recommendation, forecast or any information supplied by any third-party.
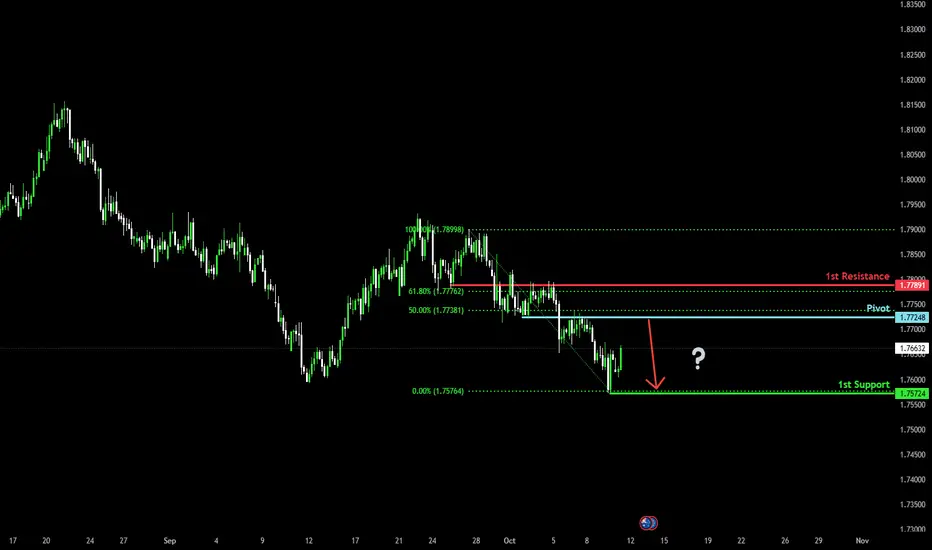
Bearish continuation?EUR/AUD is rising towards the pivot which acts as an overlap resistance and could reverse to the 1st support.
Pivot: 1.7724
1st Support: 1.7572
1st Resistance: 1.7789
Disclaimer:
The above opinions given constitute general market commentary, and do not constitute the opinion or advice of IC Markets or any form of personal or investment advice.
Any opinions, news, research, analyses, prices, other information, or links to third-party sites contained on this website are provided on an "as-is" basis, are intended only to be informative, is not an advice nor a recommendation, nor research, or a record of our trading prices, or an offer of, or solicitation for a transaction in any financial instrument and thus should not be treated as such. The information provided does not involve any specific investment objectives, financial situation and needs of any specific person who may receive it. Please be aware, that past performance is not a reliable indicator of future performance and/or results. Past Performance or Forward-looking scenarios based upon the reasonable beliefs of the third-party provider are not a guarantee of future performance. Actual results may differ materially from those anticipated in forward-looking or past performance statements. IC Markets makes no representation or warranty and assumes no liability as to the accuracy or completeness of the information provided, nor any loss arising from any investment based on a recommendation, forecast or any information supplied by any third-party.
Bullish bounce off?EUR/CAD has bounced off the pivot, which is a pullback support, and could rise to the 1st resistance.
Pivot: 1.6186
1st Support: 1.6119
1st Resistance: 1.6306
Disclaimer:
The above opinions given constitute general market commentary, and do not constitute the opinion or advice of IC Markets or any form of personal or investment advice.
Any opinions, news, research, analyses, prices, other information, or links to third-party sites contained on this website are provided on an "as-is" basis, are intended only to be informative, is not an advice nor a recommendation, nor research, or a record of our trading prices, or an offer of, or solicitation for a transaction in any financial instrument and thus should not be treated as such. The information provided does not involve any specific investment objectives, financial situation and needs of any specific person who may receive it. Please be aware, that past performance is not a reliable indicator of future performance and/or results. Past Performance or Forward-looking scenarios based upon the reasonable beliefs of the third-party provider are not a guarantee of future performance. Actual results may differ materially from those anticipated in forward-looking or past performance statements. IC Markets makes no representation or warranty and assumes no liability as to the accuracy or completeness of the information provided, nor any loss arising from any investment based on a recommendation, forecast or any information supplied by any third-party.

EURUSD H4 | Bearish Drop OffEUR/USD is rising towards the sell entry which is a pullback resistance and could reverse from this level to the downside.
Sell entry is at 1.1612, whichis a pullback resistance.
Stop loss is at 1.1664, whichis a pullback resistance that aligns with the 50% Fibonacci retracement.
Take profit is at 1.1530, which is a pullback support.
High Risk Investment Warning
Trading Forex/CFDs on margin carries a high level of risk and may not be suitable for all investors. Leverage can work against you.
Stratos Markets Limited (tradu.com ):
CFDs are complex instruments and come with a high risk of losing money rapidly due to leverage. 65% of retail investor accounts lose money when trading CFDs with this provider. You should consider whether you understand how CFDs work and whether you can afford to take the high risk of losing your money.
Stratos Europe Ltd (tradu.com ):
CFDs are complex instruments and come with a high risk of losing money rapidly due to leverage. 66% of retail investor accounts lose money when trading CFDs with this provider. You should consider whether you understand how CFDs work and whether you can afford to take the high risk of losing your money.
Stratos Global LLC (tradu.com ):
Losses can exceed deposits.
Please be advised that the information presented on TradingView is provided to Tradu (‘Company’, ‘we’) by a third-party provider (‘TFA Global Pte Ltd’). Please be reminded that you are solely responsible for the trading decisions on your account. There is a very high degree of risk involved in trading. Any information and/or content is intended entirely for research, educational and informational purposes only and does not constitute investment or consultation advice or investment strategy. The information is not tailored to the investment needs of any specific person and therefore does not involve a consideration of any of the investment objectives, financial situation or needs of any viewer that may receive it. Kindly also note that past performance is not a reliable indicator of future results. Actual results may differ materially from those anticipated in forward-looking or past performance statements. We assume no liability as to the accuracy or completeness of any of the information and/or content provided herein and the Company cannot be held responsible for any omission, mistake nor for any loss or damage including without limitation to any loss of profit which may arise from reliance on any information supplied by TFA Global Pte Ltd.
The speaker(s) is neither an employee, agent nor representative of Tradu and is therefore acting independently. The opinions given are their own, constitute general market commentary, and do not constitute the opinion or advice of Tradu or any form of personal or investment advice. Tradu neither endorses nor guarantees offerings of third-party speakers, nor is Tradu responsible for the content, veracity or opinions of third-party speakers, presenters or participants.


EURAUD to find buyers at previous swing low?EURAUD - 24h expiry
Pivot support is at 1.7600. We expect a reversal in this move.
Risk/Reward would be poor to call a buy from current levels.
A move through 1.7675 will confirm the bullish momentum.
The measured move target is 1.7775.
We look to Buy at 1.7600 (stop at 1.7525)
Our profit targets will be 1.7750 and 1.7775
Resistance: 1.7675 / 1.7700 / 1.7750
Support: 1.7600 / 1.7550 / 1.7525
Risk Disclaimer
The trade ideas beyond this page are for informational purposes only and do not constitute investment advice or a solicitation to trade. This information is provided by Signal Centre, a third-party unaffiliated with OANDA, and is intended for general circulation only. OANDA does not guarantee the accuracy of this information and assumes no responsibilities for the information provided by the third party. The information does not take into account the specific investment objectives, financial situation, or particular needs of any particular person. You should take into account your specific investment objectives, financial situation, and particular needs before making a commitment to trade, including seeking, under a separate engagement, as you deem fit.
You accept that you assume all risks in independently viewing the contents and selecting a chosen strategy.
Where the research is distributed in Singapore to a person who is not an Accredited Investor, Expert Investor or an Institutional Investor, Oanda Asia Pacific Pte Ltd (“OAP“) accepts legal responsibility for the contents of the report to such persons only to the extent required by law. Singapore customers should contact OAP at 6579 8289 for matters arising from, or in connection with, the information/research distributed.

Bearish reversal off pullback resistance?EUR/CAD is rising towards the resistance level, which is a pullback resistance that aligns with the 38.2% Fibonacci retracement and could reverse from this level to our take profit.
Entry: 1.62549
Why we like it:
There is a pullback resistance level that lines up with the 38.2% Fibonacci retracement.
Stop loss: 1.6398
Why we like it:
There is a swing high resistance level.
Take profit: 1.60909
Why we like it:
There is a pullback support level that is slightly below the 127.2% Fibonacci extension.
Enjoying your TradingView experience? Review us!
Please be advised that the information presented on TradingView is provided to Vantage (‘Vantage Global Limited’, ‘we’) by a third-party provider (‘Everest Fortune Group’). Please be reminded that you are solely responsible for the trading decisions on your account. There is a very high degree of risk involved in trading. Any information and/or content is intended entirely for research, educational and informational purposes only and does not constitute investment or consultation advice or investment strategy. The information is not tailored to the investment needs of any specific person and therefore does not involve a consideration of any of the investment objectives, financial situation or needs of any viewer that may receive it. Kindly also note that past performance is not a reliable indicator of future results. Actual results may differ materially from those anticipated in forward-looking or past performance statements. We assume no liability as to the accuracy or completeness of any of the information and/or content provided herein and the Company cannot be held responsible for any omission, mistake nor for any loss or damage including without limitation to any loss of profit which may arise from reliance on any information supplied by Everest Fortune Group.

EURCAD – Waiting for the Perfect ConfluenceEURCAD remains overall bullish while trading inside a rising channel.
At the moment, price is approaching the intersection of the channel’s lower trendline and the horizontal structure zone.
That’s where I’ll be watching closely for trend-following long setups, ideally a rejection or reversal confirmation around that confluence area.
As long as this structure holds, the bulls remain in control, and we could see a continuation toward the upper bound of the channel.
⚠️ Disclaimer: This is not financial advice. Always do your own research and manage risk properly.
📚 Stick to your trading plan regarding entries, risk, and management.
Good luck! 🍀
All Strategies Are Good; If Managed Properly!
~Richard Nasr

Bearish Reversal in PlayThe Fiber (EUR/USD is reacting off the pivot, which is a pullback resistance and could drop to the 1st support, which is a pullback support.
Pivot: 1.1639
1st Support: 1.2533
1st Resistance: 1.1691
Disclaimer:
The above opinions given constitute general market commentary, and do not constitute the opinion or advice of IC Markets or any form of personal or investment advice.
Any opinions, news, research, analyses, prices, other information, or links to third-party sites contained on this website are provided on an "as-is" basis, are intended only to be informative, is not an advice nor a recommendation, nor research, or a record of our trading prices, or an offer of, or solicitation for a transaction in any financial instrument and thus should not be treated as such. The information provided does not involve any specific investment objectives, financial situation and needs of any specific person who may receive it. Please be aware, that past performance is not a reliable indicator of future performance and/or results. Past Performance or Forward-looking scenarios based upon the reasonable beliefs of the third-party provider are not a guarantee of future performance. Actual results may differ materially from those anticipated in forward-looking or past performance statements. IC Markets makes no representation or warranty and assumes no liability as to the accuracy or completeness of the information provided, nor any loss arising from any investment based on a recommendation, forecast or any information supplied by any third-party.

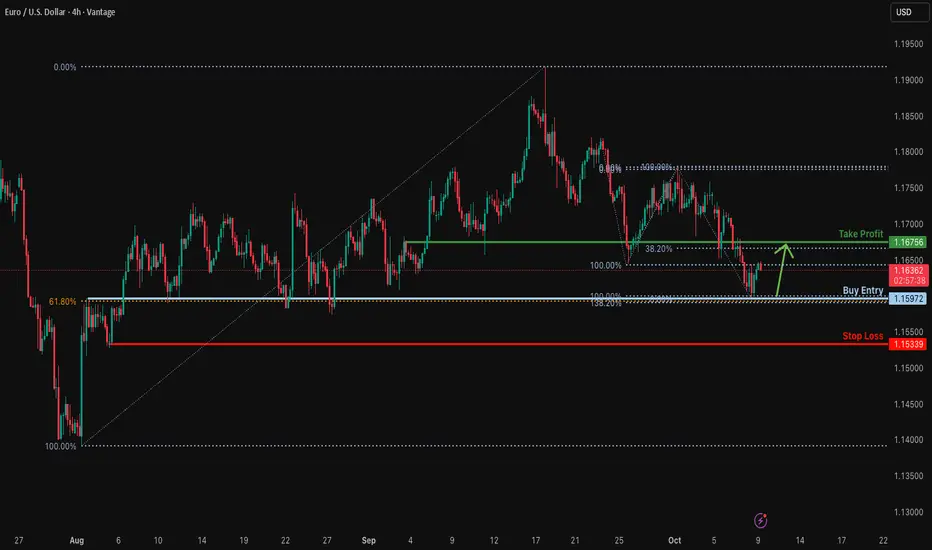
Bullish bounce off Fibonacci confluence?EUR/USD has rebounded from a support level, which is an overlap support aligning with the 100% Fibonacci projection, 132.2% Fibonacci extension, and the 61.8% Fibonacci retracement. The pair could potentially rise from this level toward the take-profit target.
Entry: 1.1597
Why we like it:
which is an overlap support aligning with the 100% Fibonacci projection, 132.2% Fibonacci extension, and the 61.8% Fibonacci retracement.
Stop loss: 1.1533
Why we like it: which is a pullback support.
Take profit: 1.1675
Why we like it:
There is an overlap resistance that aligns with the 38.2% Fibonacci retracement.
Enjoying your TradingView experience? Review us!
Please be advised that the information presented on TradingView is provided to Vantage (‘Vantage Global Limited’, ‘we’) by a third-party provider (‘Everest Fortune Group’). Please be reminded that you are solely responsible for the trading decisions on your account. There is a very high degree of risk involved in trading. Any information and/or content is intended entirely for research, educational and informational purposes only and does not constitute investment or consultation advice or investment strategy. The information is not tailored to the investment needs of any specific person and therefore does not involve a consideration of any of the investment objectives, financial situation or needs of any viewer that may receive it. Kindly also note that past performance is not a reliable indicator of future results. Actual results may differ materially from those anticipated in forward-looking or past performance statements. We assume no liability as to the accuracy or completeness of any of the information and/or content provided herein and the Company cannot be held responsible for any omission, mistake nor for any loss or damage including without limitation to any loss of profit which may arise from reliance on any information supplied by Everest Fortune Group.