EUR/USD - U.S Government Shutdown ? 📊 Setup:
EUR/USD has successfully broken out of the descending channel on the H1 timeframe. Price is holding above the breakout level, supported by the Ichimoku cloud and a nearby demand zone. With potential U.S. government shutdown news weighing on the dollar, EUR/USD shows strong upside potential.
📈 Trade Plan:
Buy Zone: 1.1710 – 1.1730 (support zone & breakout retest)
1st Resistance Target: 1.1837
2nd Resistance Target: 1.1891
Bias: Bullish as long as price holds above support zone and channel breakout.
✅ Support Factors:
Clear Channel Breakout on H1
Confluence with Ichimoku bullish bias
Fundamental support: Possible U.S. government shutdown → weaker USD outlook
Strong demand zone cushioning downside
#EURUSD #Forex #Trading #TechnicalAnalysis #PriceAction #ForexSignals #FXTrading #Euro #USD #Breakout #TradingView
⚠️ Disclaimer:
This analysis is for educational purposes only and not financial advice. Always do your own research and manage risk before trading.
💬 Support the Analysis:
If this setup adds value, don’t forget to Like 👍, Comment 💬, and Follow ✅ for more timely updates.
F-EUR

eurjpy on verge of breakout formed rising wedge, formed massive bearish divergence, but still we have to wait for downside breakout, upon successful breakout it can give 150 to 200 pips bearish rally.

EURUSD H4 | Bullish bounce from supportBased on the H4 chart analysis, we could see the price fall to the buy entry, which is a pullback support that lines up with the 38.2% Fibonacci retracement and could bounce from this level to our take profit.
Buy entry is at 1.1711, which is. pullback support that lines up with the 38.2% Fibonacci retracement.
Stop loss is at 1.1664, which his a pullback support.
Take profit is at 1.1825, which is a pullback resistance.
High Risk Investment Warning
Trading Forex/CFDs on margin carries a high level of risk and may not be suitable for all investors. Leverage can work against you.
Stratos Markets Limited (tradu.com ):
CFDs are complex instruments and come with a high risk of losing money rapidly due to leverage. 65% of retail investor accounts lose money when trading CFDs with this provider. You should consider whether you understand how CFDs work and whether you can afford to take the high risk of losing your money.
Stratos Europe Ltd (tradu.com ):
CFDs are complex instruments and come with a high risk of losing money rapidly due to leverage. 66% of retail investor accounts lose money when trading CFDs with this provider. You should consider whether you understand how CFDs work and whether you can afford to take the high risk of losing your money.
Stratos Global LLC (tradu.com ):
Losses can exceed deposits.
Please be advised that the information presented on TradingView is provided to Tradu (‘Company’, ‘we’) by a third-party provider (‘TFA Global Pte Ltd’). Please be reminded that you are solely responsible for the trading decisions on your account. There is a very high degree of risk involved in trading. Any information and/or content is intended entirely for research, educational and informational purposes only and does not constitute investment or consultation advice or investment strategy. The information is not tailored to the investment needs of any specific person and therefore does not involve a consideration of any of the investment objectives, financial situation or needs of any viewer that may receive it. Kindly also note that past performance is not a reliable indicator of future results. Actual results may differ materially from those anticipated in forward-looking or past performance statements. We assume no liability as to the accuracy or completeness of any of the information and/or content provided herein and the Company cannot be held responsible for any omission, mistake nor for any loss or damage including without limitation to any loss of profit which may arise from reliance on any information supplied by TFA Global Pte Ltd.
The speaker(s) is neither an employee, agent nor representative of Tradu and is therefore acting independently. The opinions given are their own, constitute general market commentary, and do not constitute the opinion or advice of Tradu or any form of personal or investment advice. Tradu neither endorses nor guarantees offerings of third-party speakers, nor is Tradu responsible for the content, veracity or opinions of third-party speakers, presenters or participants.

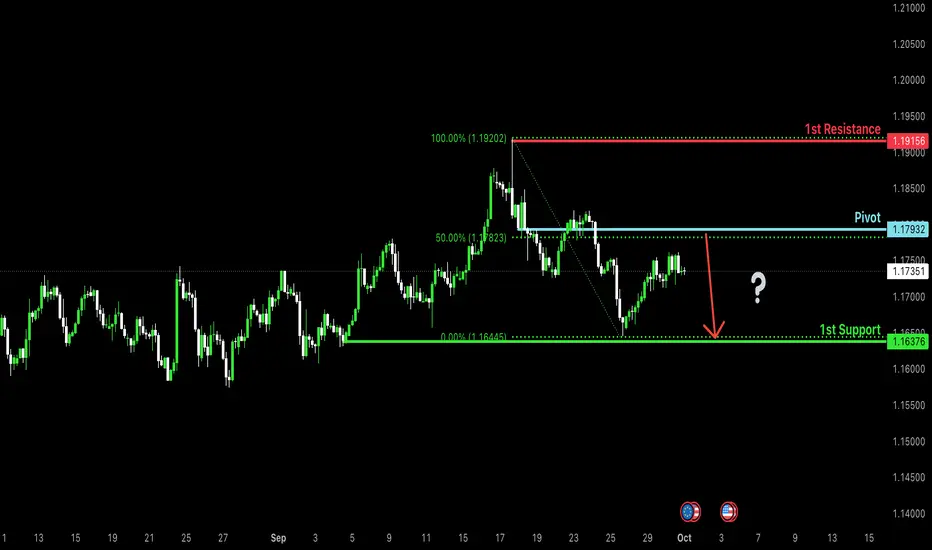
Bearish reversal off 50% Fibonacci resistance?The Fiber (EUR/USD) is rising towards the pivot and could reverse to the 1st support.
Pivot: 1.1793
1st Support: 1.1637
1st Resistance: 1.1915
Disclaimer:
The above opinions given constitute general market commentary, and do not constitute the opinion or advice of IC Markets or any form of personal or investment advice.
Any opinions, news, research, analyses, prices, other information, or links to third-party sites contained on this website are provided on an "as-is" basis, are intended only to be informative, is not an advice nor a recommendation, nor research, or a record of our trading prices, or an offer of, or solicitation for a transaction in any financial instrument and thus should not be treated as such. The information provided does not involve any specific investment objectives, financial situation and needs of any specific person who may receive it. Please be aware, that past performance is not a reliable indicator of future performance and/or results. Past Performance or Forward-looking scenarios based upon the reasonable beliefs of the third-party provider are not a guarantee of future performance. Actual results may differ materially from those anticipated in forward-looking or past performance statements. IC Markets makes no representation or warranty and assumes no liability as to the accuracy or completeness of the information provided, nor any loss arising from any investment based on a recommendation, forecast or any information supplied by any third-party.
Could we see a drop from here?EUR/USD is reacting off the resistance level, which is a pullback resistance that aligns with the 50% Fibonacci retracement and could drop from this level to our take profit.
Entry: 1.11734
Why we like it:
There is a pullback resistance that lines up with the 50% Fibonacci retracement.
Stop loss: 1.1815
Why we like it:
There is a pullback resistance level.
Take profit: 1.1638
Why we like it:
There is a pullback support level.
Enjoying your TradingView experience? Review us!
Please be advised that the information presented on TradingView is provided to Vantage (‘Vantage Global Limited’, ‘we’) by a third-party provider (‘Everest Fortune Group’). Please be reminded that you are solely responsible for the trading decisions on your account. There is a very high degree of risk involved in trading. Any information and/or content is intended entirely for research, educational and informational purposes only and does not constitute investment or consultation advice or investment strategy. The information is not tailored to the investment needs of any specific person and therefore does not involve a consideration of any of the investment objectives, financial situation or needs of any viewer that may receive it. Kindly also note that past performance is not a reliable indicator of future results. Actual results may differ materially from those anticipated in forward-looking or past performance statements. We assume no liability as to the accuracy or completeness of any of the information and/or content provided herein and the Company cannot be held responsible for any omission, mistake nor for any loss or damage including without limitation to any loss of profit which may arise from reliance on any information supplied by Everest Fortune Group.
usdt.d 30minHello friends
I am Mehdi, according to the Tether Dominance chart and the full targeting of the previous analysis in the 4-hour timeframe
According to the new analysis, I think the price is expected to reach the range of 4.49
1 Because the 4.57 level was broken with a strong candle in the 4-hour timeframe and now the price is rejecting this level
2 We are at the 382 fibo level
3 RSI divergence
Thank you for supporting me by liking and commenting and sharing this analysis

Bearish drop off?EUR/JPY has rejected off the pivot and could potentially drop to the overlap support.
Pivot: 174.41
1st Support: 173.78
1st Resistance: 174.98
Disclaimer:
The above opinions given constitute general market commentary, and do not constitute the opinion or advice of IC Markets or any form of personal or investment advice.
Any opinions, news, research, analyses, prices, other information, or links to third-party sites contained on this website are provided on an "as-is" basis, are intended only to be informative, is not an advice nor a recommendation, nor research, or a record of our trading prices, or an offer of, or solicitation for a transaction in any financial instrument and thus should not be treated as such. The information provided does not involve any specific investment objectives, financial situation and needs of any specific person who may receive it. Please be aware, that past performance is not a reliable indicator of future performance and/or results. Past Performance or Forward-looking scenarios based upon the reasonable beliefs of the third-party provider are not a guarantee of future performance. Actual results may differ materially from those anticipated in forward-looking or past performance statements. IC Markets makes no representation or warranty and assumes no liability as to the accuracy or completeness of the information provided, nor any loss arising from any investment based on a recommendation, forecast or any information supplied by any third-party.

Bullish bounce from support?EUR/GBP is falling towards the pivot and could bounce to the 1st resistance which aligns with the 161.8% Fibonacci extension.
Pivot: 0.8713
1st Support: 0.8685
1st Resistance: 0.876
Disclaimer:
The above opinions given constitute general market commentary, and do not constitute the opinion or advice of IC Markets or any form of personal or investment advice.
Any opinions, news, research, analyses, prices, other information, or links to third-party sites contained on this website are provided on an "as-is" basis, are intended only to be informative, is not an advice nor a recommendation, nor research, or a record of our trading prices, or an offer of, or solicitation for a transaction in any financial instrument and thus should not be treated as such. The information provided does not involve any specific investment objectives, financial situation and needs of any specific person who may receive it. Please be aware, that past performance is not a reliable indicator of future performance and/or results. Past Performance or Forward-looking scenarios based upon the reasonable beliefs of the third-party provider are not a guarantee of future performance. Actual results may differ materially from those anticipated in forward-looking or past performance statements. IC Markets makes no representation or warranty and assumes no liability as to the accuracy or completeness of the information provided, nor any loss arising from any investment based on a recommendation, forecast or any information supplied by any third-party.

Bearish drop off?EUR/JPY is reacting off the resistance level which is a pullback resistance and could drop from this level to our take profit.
Entry: 174.46
Why we like it:
There is a pullback resistance level.
Stop loss: 175.35
Why we like it:
There is a resistance level at the 78.6% Fibonacci projection.
Take profit: 172.58
Why we like it:
There is an overlap support level that aligns with the 61.8% Fibonacci retracement.
Enjoying your TradingView experience? Review us!
Please be advised that the information presented on TradingView is provided to Vantage (‘Vantage Global Limited’, ‘we’) by a third-party provider (‘Everest Fortune Group’). Please be reminded that you are solely responsible for the trading decisions on your account. There is a very high degree of risk involved in trading. Any information and/or content is intended entirely for research, educational and informational purposes only and does not constitute investment or consultation advice or investment strategy. The information is not tailored to the investment needs of any specific person and therefore does not involve a consideration of any of the investment objectives, financial situation or needs of any viewer that may receive it. Kindly also note that past performance is not a reliable indicator of future results. Actual results may differ materially from those anticipated in forward-looking or past performance statements. We assume no liability as to the accuracy or completeness of any of the information and/or content provided herein and the Company cannot be held responsible for any omission, mistake nor for any loss or damage including without limitation to any loss of profit which may arise from reliance on any information supplied by Everest Fortune Group.

EUR/AUD - Breakout Pattern|Buy Opportunity (26.09.2025)The EUR/AUD pair has been trading inside a descending wedge formation and is now showing a potential breakout to the upside.
🔹 Price successfully tested the trendline resistance and is gaining bullish momentum.
🔹 Buyers are stepping in after multiple rejections near the lower boundary (A–C trendline).
🔹 Breakout above 1.7860 zone opens the path toward higher resistance levels.
📊 Trading Plan:
Buy above breakout zone confirmation
1st Resistance: 1.7929
2nd Resistance: 1.7966
Maintain risk management and wait for candle confirmation.
✨ Trade safe & stay disciplined!
#EURAUD #Forex #Breakout #TradingView #FXAnalysis #PriceAction #ForexTrading #SwingTrading #TechnicalAnalysis #Kabhi_TA_Trading
✅ If you find this analysis helpful, don’t forget to like 👍, comment 💬, and follow 🔔 for more updates.
📌 Disclaimer: This analysis is for educational purposes only. Not financial advice. Trade at your own risk.

EURUSD 4H Channel Down targets 1.1600.The EURUSD pair is trading within a Channel Down on the 4H time-frame. As long as the 4H MA50 (blue trend-line) acts as Resistance, we expect the pattern to initiate its 3rd Bearish Leg, as at the same time, we have hit the 0.5 Fibonacci retracement level, which is where the previous Bearish Leg topped (Lower High).
If it repeats the recent Lower Low decline, we should see a 1.382 Fibonacci extension test. That more than covers our 1.16000 Target, which is where we believe contact can be made with the long-term Support of the 1D MA100 (red trend-line).
-------------------------------------------------------------------------------
** Please LIKE 👍, FOLLOW ✅, SHARE 🙌 and COMMENT ✍ if you enjoy this idea! Also share your ideas and charts in the comments section below! This is best way to keep it relevant, support us, keep the content here free and allow the idea to reach as many people as possible. **
-------------------------------------------------------------------------------
💸💸💸💸💸💸
👇 👇 👇 👇 👇 👇

#029: EUR/USD Long Investment Opportunity
The pair recently broke the 1.1700 support zone, showing strong rejection and signs of a possible bullish reversal. Volume confirms accumulation near the lows, while retail traders remain largely positioned on the short side. Hello, I'm Forex Trader Andrea Russo, an independent trader and prop trader with $200,000 in capital under management. Thank you in advance for your time.
From an institutional perspective, this creates favorable conditions for a potential continuation of the upside.
Momentum indicators are turning positive, and the next few sessions could be crucial for a breakout attempt.
Key Focus:
Support zone around 1.1690-1.1700
Resistance area near 1.1810
Retail sentiment is still strongly short-term → possible upward pressure from institutional investors
⏳ The trend remains bullish in the short term, with expectations of a progressive upward move in the next 24-32 hours.

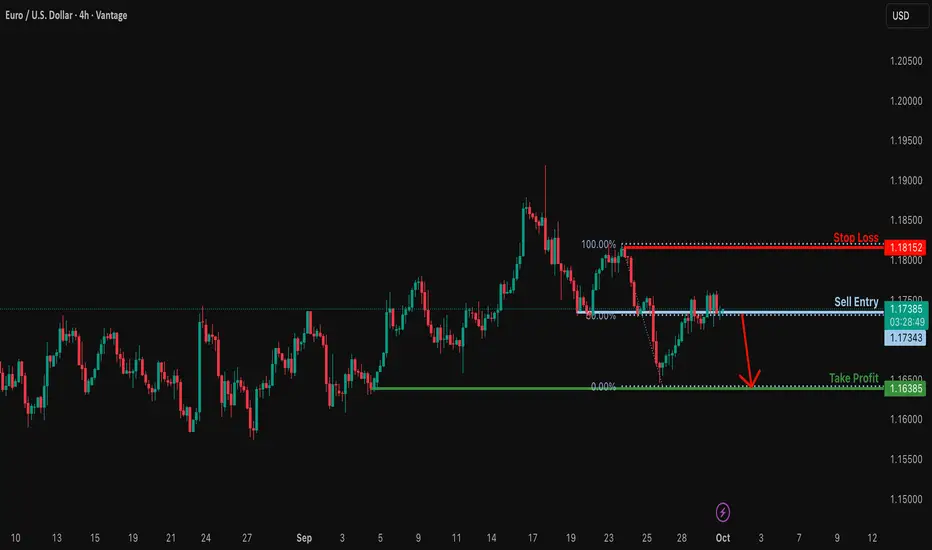
EURUSD H4 | Potential bearish reversalEUR/USD is reacting off the sell entry which is a pullback resistance that aligns with the 50% Fibonacci retracement and could drop from this levle to the downside.
Sell entry is at 1.1730, which is a pullback resistance that lines up with the 50% Fibonacci retracement.
Stop loss is at 1.1816, which is a pullback resistance.
Take profit is at 1.1615, which is a pullback support.
High Risk Investment Warning
Trading Forex/CFDs on margin carries a high level of risk and may not be suitable for all investors. Leverage can work against you.
Stratos Markets Limited (tradu.com ):
CFDs are complex instruments and come with a high risk of losing money rapidly due to leverage. 65% of retail investor accounts lose money when trading CFDs with this provider. You should consider whether you understand how CFDs work and whether you can afford to take the high risk of losing your money.
Stratos Europe Ltd (tradu.com ):
CFDs are complex instruments and come with a high risk of losing money rapidly due to leverage. 66% of retail investor accounts lose money when trading CFDs with this provider. You should consider whether you understand how CFDs work and whether you can afford to take the high risk of losing your money.
Stratos Global LLC (tradu.com ):
Losses can exceed deposits.
Please be advised that the information presented on TradingView is provided to Tradu (‘Company’, ‘we’) by a third-party provider (‘TFA Global Pte Ltd’). Please be reminded that you are solely responsible for the trading decisions on your account. There is a very high degree of risk involved in trading. Any information and/or content is intended entirely for research, educational and informational purposes only and does not constitute investment or consultation advice or investment strategy. The information is not tailored to the investment needs of any specific person and therefore does not involve a consideration of any of the investment objectives, financial situation or needs of any viewer that may receive it. Kindly also note that past performance is not a reliable indicator of future results. Actual results may differ materially from those anticipated in forward-looking or past performance statements. We assume no liability as to the accuracy or completeness of any of the information and/or content provided herein and the Company cannot be held responsible for any omission, mistake nor for any loss or damage including without limitation to any loss of profit which may arise from reliance on any information supplied by TFA Global Pte Ltd.
The speaker(s) is neither an employee, agent nor representative of Tradu and is therefore acting independently. The opinions given are their own, constitute general market commentary, and do not constitute the opinion or advice of Tradu or any form of personal or investment advice. Tradu neither endorses nor guarantees offerings of third-party speakers, nor is Tradu responsible for the content, veracity or opinions of third-party speakers, presenters or participants.

Bearish reversal of 50% Fibonacci resistance?EUR/USD is rising towards the resistance which is a pullback resistance that aligns with the 50% Fibonacci retracement and could reverse from this level to our take profit.
Entry: 1.1736
Why we like it:
There is a pullback resistance that aligns with the 50% Fibonacci retracement.
Stop loss: 1.1815
Why we like it:
There is a pullback resistance level.
Take profit: 1.1638
Why w like it:
There is a pullback support level.
Enjoying your TradingView experience? Review us!
Please be advised that the information presented on TradingView is provided to Vantage (‘Vantage Global Limited’, ‘we’) by a third-party provider (‘Everest Fortune Group’). Please be reminded that you are solely responsible for the trading decisions on your account. There is a very high degree of risk involved in trading. Any information and/or content is intended entirely for research, educational and informational purposes only and does not constitute investment or consultation advice or investment strategy. The information is not tailored to the investment needs of any specific person and therefore does not involve a consideration of any of the investment objectives, financial situation or needs of any viewer that may receive it. Kindly also note that past performance is not a reliable indicator of future results. Actual results may differ materially from those anticipated in forward-looking or past performance statements. We assume no liability as to the accuracy or completeness of any of the information and/or content provided herein and the Company cannot be held responsible for any omission, mistake nor for any loss or damage including without limitation to any loss of profit which may arise from reliance on any information supplied by Everest Fortune Group.

Bullish bounce?The Fiber (EUR/USD) is falling towards the pivot which acts as an overlap support that aligns with the 61.8% Fibonacci retracement and could bounce to the 1st resistance which is a pullback resistance.
Pivot: 1.1584
1st Support: 1.1398
1st Resistance: 1.1736
Disclaimer:
The above opinions given constitute general market commentary, and do not constitute the opinion or advice of IC Markets or any form of personal or investment advice.
Any opinions, news, research, analyses, prices, other information, or links to third-party sites contained on this website are provided on an "as-is" basis, are intended only to be informative, is not an advice nor a recommendation, nor research, or a record of our trading prices, or an offer of, or solicitation for a transaction in any financial instrument and thus should not be treated as such. The information provided does not involve any specific investment objectives, financial situation and needs of any specific person who may receive it. Please be aware, that past performance is not a reliable indicator of future performance and/or results. Past Performance or Forward-looking scenarios based upon the reasonable beliefs of the third-party provider are not a guarantee of future performance. Actual results may differ materially from those anticipated in forward-looking or past performance statements. IC Markets makes no representation or warranty and assumes no liability as to the accuracy or completeness of the information provided, nor any loss arising from any investment based on a recommendation, forecast or any information supplied by any third-party.

EUR/GBP Technical Outlook – Breakout Potential Toward Multi-YearThe Euro vs British Pound (EUR/GBP) is showing renewed strength, currently trading near 0.8730, with buyers pressing against a critical long-term resistance zone. Price has been consolidating in a broad range for years, but the recent rally suggests momentum may be shifting in favor of the euro.
Key technical levels to monitor:
0.8479 – major support zone, previously defended by buyers
0.8730 – current breakout area
0.8900 – dynamic resistance (descending trendline from 2020 highs)
0.9184 – next upside target if breakout confirms
The technical roadmap points to a possible breakout above the descending trendline, which would open the way toward 0.9180+, a level that aligns with prior liquidity grabs and institutional supply zones. A rejection at trendline resistance, however, could trigger a corrective pullback back toward 0.85–0.84.
📌 Summary:
Bias: Bullish while above 0.8479
Targets: 0.8900 → 0.9180
Risk: Failure at trendline could drag price back into range
This setup highlights a long-term structural shift in EUR/GBP, making it a key cross to watch for both institutional investors and retail traders seeking directional opportunities.

EURGBP Eyes 0.86700 Support for Potential BounceHey Traders, in tomorrow's trading session we are monitoring EURGBP for a buying opportunity around the 0.86700 zone. EURGBP is trading in an uptrend, with price currently correcting toward this key support/resistance level.
Structure: The broader trend remains bullish, with the current pullback potentially offering fresh entry opportunities.
Key level in focus: 0.86700 — a significant support zone where buyers may look to rejoin the trend.
Fundamentals: Ongoing EUR resilience against GBP could help support a continuation higher if this level holds.
Trade safe,
Joe.

EURUSD: 1.18 FORTRESS ATTACK! Dollar Weakness Exposed 🚀 EURUSD: 1.18 FORTRESS ATTACK! Dollar Weakness Exposed 📊
Current Price: 1.17020 | Date: Sept 27, 2025 ⏰
📈 INTRADAY TRADING SETUPS (Next 5 Days)
🎯 BULLISH SCENARIO
Entry Zone: 1.1680 - 1.1710 📍
Stop Loss: 1.1650 🛑
Target 1: 1.1750 🎯
Target 2: 1.1790 🚀
🎯 BEARISH SCENARIO
Entry Zone: 1.1720 - 1.1750 📍
Stop Loss: 1.1780 🛑
Target 1: 1.1650 🎯
Target 2: 1.1600 📉
🔍 TECHNICAL ANALYSIS BREAKDOWN
📊 KEY INDICATORS STATUS:
RSI (14): 62.1 ⚡ Euro Strength Building
Bollinger Bands: Expansion Mode 🔥
VWAP: 1.1695 - Dynamic Support 💪
EMA 20: 1.1675 ✅ Bullish Momentum
Volume: Institutional Flow Rising 📊
🌊 WAVE ANALYSIS:
Elliott Wave: Wave C Impulse Active 🌊
Fibonacci Target: 1.1850 (127.2%) 🎯
🔄 HARMONIC PATTERNS:
Bullish Gartley at 1.1660 Support ✨
Cypher PRZ targeting 1.1780 🔄
⚖️ SWING TRADING OUTLOOK (1-4 Weeks)
🚀 BULLISH TARGETS:
Psychological: 1.1800 🏆
Weekly Resistance: 1.1850 🌙
Gann Level: 1.1875 ⭐
📉 BEARISH INVALIDATION:
Weekly Support: 1.1600 ⚠️
Critical Break: 1.1550 🚨
🎭 MARKET STRUCTURE:
Trend: Ascending Channel 💪
Momentum: Dollar Weakness 🔥
Wyckoff Phase: Markup Phase 📈
Ichimoku: Bullish Cloud Break 🟢
🏰 1.18 FORTRESS BATTLE:
Key Resistance: 1.1780-1.1800 ⚔️
Volume Confirmation: Needed Above 1.1750 💥
Breakout Target: 1.1850 Major Level 🔓
⚡ RISK MANAGEMENT:
Max Risk per Trade: 50 pips 🛡️
R:R Ratio: Minimum 1:2 ⚖️
London/NY Sessions: Prime Time 📏
🌍 CENTRAL BANK DYNAMICS:
ECB Policy Divergence Bullish 🏛️
Fed Dovishness Supporting EUR 📈
Dollar Index Weakness Continues 💵
Rate Differential Narrowing 📊
🔥 CRITICAL LEVELS:
Breakout: 1.1750 decisive close 💥
Support: 1.1680 | 1.1650 | 1.1620 🛡️
Resistance: 1.1750 | 1.1780 | 1.1800 🚧
📈 DXY CORRELATION:
Dollar Index: Bearish Divergence 📉
EUR Strength: Independent Rally 💪
Cross-Currency: Bullish Flow 🔄
🎯 FINAL VERDICT:
EURUSD storming 1.18 RESISTANCE! 🚀
Dollar weakness = Euro rocket fuel! 💎
Multi-timeframe bullish alignment! 📈
Trade Management: Scale in above 1.1680 💰
Breakout Alert: Watch 1.1750 hold! 🔔
---
⚠️ Disclaimer: FX trading involves significant risk. Use proper position sizing. Educational analysis only.
For individuals seeking to enhance their trading abilities based on the analyses provided, I recommend exploring the mentoring program offered by Shunya Trade. (Website: shunya dot trade)
I would appreciate your feedback on this analysis, as it will serve as a valuable resource for future endeavors.
Sincerely,
Shunya.Trade
Website: shunya dot trade
🔔 Follow FX Market Updates | 💬 What's Your 1.18 Target Timeline?

EUR/USD - Multi time frame Analysis 🕰 Weekly View
Price recently tapped weekly demand around 1.1600 and reacted strong.
But that wick rejection above 1.1900 screams liquidity sweep 🧹—it failed to hold as a true breakout.
Until we see a clean weekly BOS (Break of Structure) above 1.1900, this is still looking like a range play between 1.16–1.19.
📉 Daily Structure
We’ve got a failed break at the highs, confirming liquidity grab.
Daily is chilling near the 71% fib retracement + demand zone. That’s the hot buy area 🏦.
If price bounces here → eyes on 1.1750–1.1800.
If it fails → expect a sweep into 1.1500 zone before any rocket 🚀.
⏱ 4H Breakdown
Two clear scenarios loading…
1️⃣ Idea 1 (deeper dip): Price breaks below current lows, sweeps liquidity into 1.1550–1.1600 (4H demand). Then we catch buys for a run back to 1.1700+.
2️⃣ Idea 2 (bullish push): Price flips short-term highs at 1.1750 → confirms momentum → next stop 1.1850–1.1900 retest.
Both ideas align with higher-timeframe liquidity games—just depends which way market makers want to hunt first 🎯.
🎯 Summary
Weekly = Range between 1.16–1.19 until proven otherwise.
Daily = Sitting on golden demand/discount.
4H = Watch for liquidity sweep down or break above 1.1750.
Big picture → Still bullish bias if demand holds, but don’t be surprised by one more dip before the climb.

EURUSD H4 | Bullish reversalEUR/USD is falling towards the buy entry which is a pullback support and oculd bounce from this level to the take profit.
Buy entry is at 1.1616, whichis a pullback support.
Stop loss is at 1.1537, which is a pullback support.
Take profit is at 1.1729, which is a pullback resistance that aligns with the 50% Fibonacci retracement.
High Risk Investment Warning
Trading Forex/CFDs on margin carries a high level of risk and may not be suitable for all investors. Leverage can work against you.
Stratos Markets Limited (tradu.com ):
CFDs are complex instruments and come with a high risk of losing money rapidly due to leverage. 65% of retail investor accounts lose money when trading CFDs with this provider. You should consider whether you understand how CFDs work and whether you can afford to take the high risk of losing your money.
Stratos Europe Ltd (tradu.com ):
CFDs are complex instruments and come with a high risk of losing money rapidly due to leverage. 66% of retail investor accounts lose money when trading CFDs with this provider. You should consider whether you understand how CFDs work and whether you can afford to take the high risk of losing your money.
Stratos Global LLC (tradu.com ):
Losses can exceed deposits.
Please be advised that the information presented on TradingView is provided to Tradu (‘Company’, ‘we’) by a third-party provider (‘TFA Global Pte Ltd’). Please be reminded that you are solely responsible for the trading decisions on your account. There is a very high degree of risk involved in trading. Any information and/or content is intended entirely for research, educational and informational purposes only and does not constitute investment or consultation advice or investment strategy. The information is not tailored to the investment needs of any specific person and therefore does not involve a consideration of any of the investment objectives, financial situation or needs of any viewer that may receive it. Kindly also note that past performance is not a reliable indicator of future results. Actual results may differ materially from those anticipated in forward-looking or past performance statements. We assume no liability as to the accuracy or completeness of any of the information and/or content provided herein and the Company cannot be held responsible for any omission, mistake nor for any loss or damage including without limitation to any loss of profit which may arise from reliance on any information supplied by TFA Global Pte Ltd.
The speaker(s) is neither an employee, agent nor representative of Tradu and is therefore acting independently. The opinions given are their own, constitute general market commentary, and do not constitute the opinion or advice of Tradu or any form of personal or investment advice. Tradu neither endorses nor guarantees offerings of third-party speakers, nor is Tradu responsible for the content, veracity or opinions of third-party speakers, presenters or participants.

Bearish reversal off pullback resistance?The Fiber (EUR/USD) is rising towards the pivot which is a pullback resistance that aligns with the 50% Fibonacci retracement and could reverse eto hr 1st support.
Pivot: 1.1726
1st Support: 1.1618
1st Resistance: 1.1818
Disclaimer:
The above opinions given constitute general market commentary, and do not constitute the opinion or advice of IC Markets or any form of personal or investment advice.
Any opinions, news, research, analyses, prices, other information, or links to third-party sites contained on this website are provided on an "as-is" basis, are intended only to be informative, is not an advice nor a recommendation, nor research, or a record of our trading prices, or an offer of, or solicitation for a transaction in any financial instrument and thus should not be treated as such. The information provided does not involve any specific investment objectives, financial situation and needs of any specific person who may receive it. Please be aware, that past performance is not a reliable indicator of future performance and/or results. Past Performance or Forward-looking scenarios based upon the reasonable beliefs of the third-party provider are not a guarantee of future performance. Actual results may differ materially from those anticipated in forward-looking or past performance statements. IC Markets makes no representation or warranty and assumes no liability as to the accuracy or completeness of the information provided, nor any loss arising from any investment based on a recommendation, forecast or any information supplied by any third-party.

EURAUD to find buyers at current support?EURAUD - 24H expiry
Price action looks to be forming a bottom.
Short term RSI has turned positive.
Risk/Reward would be poor to call a buy from current levels.
A move through 1.7859 will confirm the bullish momentum.
The measured move target is 1.7975.
We look to Buy at 1.7800 (stop at 1.7725)
Our profit targets will be 1.7950 and 1.7975
Resistance: 1.7850 / 1.7900 / 1.7950
Support: 1.7825 / 1.7800 / 1.7750
Risk Disclaimer
The trade ideas beyond this page are for informational purposes only and do not constitute investment advice or a solicitation to trade. This information is provided by Signal Centre, a third-party unaffiliated with OANDA, and is intended for general circulation only. OANDA does not guarantee the accuracy of this information and assumes no responsibilities for the information provided by the third party. The information does not take into account the specific investment objectives, financial situation, or particular needs of any particular person. You should take into account your specific investment objectives, financial situation, and particular needs before making a commitment to trade, including seeking, under a separate engagement, as you deem fit.
You accept that you assume all risks in independently viewing the contents and selecting a chosen strategy.
Where the research is distributed in Singapore to a person who is not an Accredited Investor, Expert Investor or an Institutional Investor, Oanda Asia Pacific Pte Ltd (“OAP“) accepts legal responsibility for the contents of the report to such persons only to the extent required by law. Singapore customers should contact OAP at 6579 8289 for matters arising from, or in connection with, the information/research distributed.

Could we see a reversal on the Fiber?The price is falling towards the support level, which is an overlap support that could act as a bounce point and potentially lead to our take profit.
Entry: 1.1645
Why we like it:
There is an overlap support level.
Stop loss: 1.1585
Why we like it:
There is a multi-swing low support level.
Take profit: 1.1727
Why we like it:
There is an overlap resistance level.
Enjoying your TradingView experience? Review us!
Please be advised that the information presented on TradingView is provided to Vantage (‘Vantage Global Limited’, ‘we’) by a third-party provider (‘Everest Fortune Group’). Please be reminded that you are solely responsible for the trading decisions on your account. There is a very high degree of risk involved in trading. Any information and/or content is intended entirely for research, educational and informational purposes only and does not constitute investment or consultation advice or investment strategy. The information is not tailored to the investment needs of any specific person and therefore does not involve a consideration of any of the investment objectives, financial situation or needs of any viewer that may receive it. Kindly also note that past performance is not a reliable indicator of future results. Actual results may differ materially from those anticipated in forward-looking or past performance statements. We assume no liability as to the accuracy or completeness of any of the information and/or content provided herein and the Company cannot be held responsible for any omission, mistake nor for any loss or damage including without limitation to any loss of profit which may arise from reliance on any information supplied by Everest Fortune Group.
