Bullish bounce?EUR/GBP is falling towards the pivot and could bounce to the 1st resistance.
Pivot: 0.8713
1st Support: 0.8680
1st Resistance: 0.8763
Disclaimer:
The above opinions given constitute general market commentary, and do not constitute the opinion or advice of IC Markets or any form of personal or investment advice.
Any opinions, news, research, analyses, prices, other information, or links to third-party sites contained on this website are provided on an "as-is" basis, are intended only to be informative, is not an advice nor a recommendation, nor research, or a record of our trading prices, or an offer of, or solicitation for a transaction in any financial instrument and thus should not be treated as such. The information provided does not involve any specific investment objectives, financial situation and needs of any specific person who may receive it. Please be aware, that past performance is not a reliable indicator of future performance and/or results. Past Performance or Forward-looking scenarios based upon the reasonable beliefs of the third-party provider are not a guarantee of future performance. Actual results may differ materially from those anticipated in forward-looking or past performance statements. IC Markets makes no representation or warranty and assumes no liability as to the accuracy or completeness of the information provided, nor any loss arising from any investment based on a recommendation, forecast or any information supplied by any third-party.
F-EUR

Bullish bounce off?EUR/AUD has bounced off the support level which is a pullback support that aligns with the 38.2% Fibonacci retracement and could rise from this level to our take profit.
Entry: 1.7806
Why we like it:
There is a pullback support that aligns with the 38.2% Fibonacci retracement.
Stop loss: 1.7702
Why we like it:
There is a pullback support that is slightly below the 61.8% Fibonacci retracement.
Take profit: 1.7968
Why we like it:
There is a pullback resistance that is slightly above the 61.8% Fibonacci retracement.
Enjoying your TradingView experience? Review us!
Please be advised that the information presented on TradingView is provided to Vantage (‘Vantage Global Limited’, ‘we’) by a third-party provider (‘Everest Fortune Group’). Please be reminded that you are solely responsible for the trading decisions on your account. There is a very high degree of risk involved in trading. Any information and/or content is intended entirely for research, educational and informational purposes only and does not constitute investment or consultation advice or investment strategy. The information is not tailored to the investment needs of any specific person and therefore does not involve a consideration of any of the investment objectives, financial situation or needs of any viewer that may receive it. Kindly also note that past performance is not a reliable indicator of future results. Actual results may differ materially from those anticipated in forward-looking or past performance statements. We assume no liability as to the accuracy or completeness of any of the information and/or content provided herein and the Company cannot be held responsible for any omission, mistake nor for any loss or damage including without limitation to any loss of profit which may arise from reliance on any information supplied by Everest Fortune Group.

Bearish reversal off multi swing high resistance?EUR/GBP is reacting off the resistance level which is a multi-swing high resistance that aligns with the 127.2% Fibonacci extension and could drop from this level to our take profit.
Entry: 0.8737
Why we like it:
There is a multi-swing high resistance that lines up with the 127.2% Fibonacci extension.
Stop loss: 0.8762
Why we like it:
There is a resistance level at the 161.8% Fibonacci extension.
Take profit: 0.8681
Why we like it:
There is a pullback support that is slightly below the 50% Fibonacci retracement.
Enjoying your TradingView experience? Review us!
Please be advised that the information presented on TradingView is provided to Vantage (‘Vantage Global Limited’, ‘we’) by a third-party provider (‘Everest Fortune Group’). Please be reminded that you are solely responsible for the trading decisions on your account. There is a very high degree of risk involved in trading. Any information and/or content is intended entirely for research, educational and informational purposes only and does not constitute investment or consultation advice or investment strategy. The information is not tailored to the investment needs of any specific person and therefore does not involve a consideration of any of the investment objectives, financial situation or needs of any viewer that may receive it. Kindly also note that past performance is not a reliable indicator of future results. Actual results may differ materially from those anticipated in forward-looking or past performance statements. We assume no liability as to the accuracy or completeness of any of the information and/or content provided herein and the Company cannot be held responsible for any omission, mistake nor for any loss or damage including without limitation to any loss of profit which may arise from reliance on any information supplied by Everest Fortune Group.

EURUSD Pullback Toward 1.17400 as DXY Struggles Below 99Hey Traders, in today's trading session we are monitoring EURUSD for a buying opportunity around the 1.17400 zone. The pair is trading in an uptrend, with price currently correcting toward this key support/resistance level.
Structure: The broader bias remains bullish, but price is pulling back after recent highs.
Key level in focus: 1.17400 — a significant zone where buyers may look to rejoin the trend.
Fundamentals: The U.S. Dollar Index (DXY) remains in a downtrend and is correcting toward the 99.000 resistance area. If DXY fails to break higher, it could reinforce USD weakness and support a bullish continuation in EURUSD.
Trade safe,
Joe.

EUR/USD Trend Watch – Critical Supports & ResistanceEUR/USD Update
On the low time frame, EUR/USD is moving sideways around 1.1780, holding just below the 1.1810 zone.
Key levels:
1.1810 – 1.1846 → resistance zone. A breakout and hold above would confirm bullish continuation toward 1.1922.
1.1774 → immediate support on the low time frame. Losing this level increases pressure on the main trend.
Upside scenario: If EUR/USD can reclaim 1.1810+, momentum may shift bullish, with the next target at 1.1922.
Downside risk: Failure to hold above 1.1774 opens the door for a correction toward 1.1660 and possibly 1.1568 – 1.1530 cycle support.
Cycle support: 1.1530 – 1.1568 remains the must-hold long-term zone to keep the bullish cycle alive.
📌 Summary
Above 1.1810 – 1.1846 → bullish continuation toward 1.1922.
Below 1.1774 → risk of deeper correction, watch 1.1660 next.
Cycle zone 1.1530 – 1.1568 → critical long-term support.

EURUSD H4 | Bearish reversalBased on the H4 chart analysis, we can see that the price is reacting off the sell entry which is a pullback resistance that aligns with the 50% Fibonacci retracement and could reverse from this level to the take profit.
Sell entry is at 1.1815, which is a pullback resistance that aligns with the 50% Fibonacci retracement.
Stop loss is at 1.1867, which is a pullback resistance.
Take profit is at 1.1737, which is a pullback support.
High Risk Investment Warning
Trading Forex/CFDs on margin carries a high level of risk and may not be suitable for all investors. Leverage can work against you.
Stratos Markets Limited (tradu.com ):
CFDs are complex instruments and come with a high risk of losing money rapidly due to leverage. 65% of retail investor accounts lose money when trading CFDs with this provider. You should consider whether you understand how CFDs work and whether you can afford to take the high risk of losing your money.
Stratos Europe Ltd (tradu.com ):
CFDs are complex instruments and come with a high risk of losing money rapidly due to leverage. 66% of retail investor accounts lose money when trading CFDs with this provider. You should consider whether you understand how CFDs work and whether you can afford to take the high risk of losing your money.
Stratos Global LLC (tradu.com ):
Losses can exceed deposits.
Please be advised that the information presented on TradingView is provided to Tradu (‘Company’, ‘we’) by a third-party provider (‘TFA Global Pte Ltd’). Please be reminded that you are solely responsible for the trading decisions on your account. There is a very high degree of risk involved in trading. Any information and/or content is intended entirely for research, educational and informational purposes only and does not constitute investment or consultation advice or investment strategy. The information is not tailored to the investment needs of any specific person and therefore does not involve a consideration of any of the investment objectives, financial situation or needs of any viewer that may receive it. Kindly also note that past performance is not a reliable indicator of future results. Actual results may differ materially from those anticipated in forward-looking or past performance statements. We assume no liability as to the accuracy or completeness of any of the information and/or content provided herein and the Company cannot be held responsible for any omission, mistake nor for any loss or damage including without limitation to any loss of profit which may arise from reliance on any information supplied by TFA Global Pte Ltd.
The speaker(s) is neither an employee, agent nor representative of Tradu and is therefore acting independently. The opinions given are their own, constitute general market commentary, and do not constitute the opinion or advice of Tradu or any form of personal or investment advice. Tradu neither endorses nor guarantees offerings of third-party speakers, nor is Tradu responsible for the content, veracity or opinions of third-party speakers, presenters or participants.

Bearish reversal off major resistance?EUR/AUD has rejected off the pivot and could fall to the pullback support.
Pivot: 1.79173
1st Support: 1.77007
1st Resistance: 1.80540
Disclaimer:
The above opinions given constitute general market commentary, and do not constitute the opinion or advice of IC Markets or any form of personal or investment advice.
Any opinions, news, research, analyses, prices, other information, or links to third-party sites contained on this website are provided on an "as-is" basis, are intended only to be informative, is not an advice nor a recommendation, nor research, or a record of our trading prices, or an offer of, or solicitation for a transaction in any financial instrument and thus should not be treated as such. The information provided does not involve any specific investment objectives, financial situation and needs of any specific person who may receive it. Please be aware, that past performance is not a reliable indicator of future performance and/or results. Past Performance or Forward-looking scenarios based upon the reasonable beliefs of the third-party provider are not a guarantee of future performance. Actual results may differ materially from those anticipated in forward-looking or past performance statements. IC Markets makes no representation or warranty and assumes no liability as to the accuracy or completeness of the information provided, nor any loss arising from any investment based on a recommendation, forecast or any information supplied by any third-party.

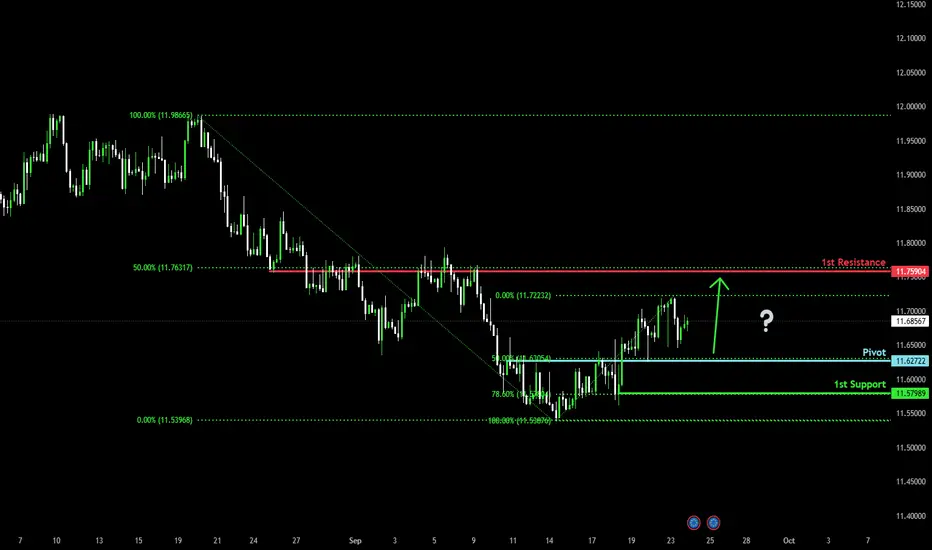
Bullish bounce off 50% Fibonacci support?EUR/NOK is falling towards the pivot which acts as an overlap support that lines up with the 50% Fibonacci retracement and could bounce to the 1st resistance.
Pivot: 11.62722
1st Support: 11.57989
1st Resistance: 11.75904
Disclaimer:
The above opinions given constitute general market commentary, and do not constitute the opinion or advice of IC Markets or any form of personal or investment advice.
Any opinions, news, research, analyses, prices, other information, or links to third-party sites contained on this website are provided on an "as-is" basis, are intended only to be informative, is not an advice nor a recommendation, nor research, or a record of our trading prices, or an offer of, or solicitation for a transaction in any financial instrument and thus should not be treated as such. The information provided does not involve any specific investment objectives, financial situation and needs of any specific person who may receive it. Please be aware, that past performance is not a reliable indicator of future performance and/or results. Past Performance or Forward-looking scenarios based upon the reasonable beliefs of the third-party provider are not a guarantee of future performance. Actual results may differ materially from those anticipated in forward-looking or past performance statements. IC Markets makes no representation or warranty and assumes no liability as to the accuracy or completeness of the information provided, nor any loss arising from any investment based on a recommendation, forecast or any information supplied by any third-party.
Potential bullish continuation ahead?EUR/USD has bounced off the support level which is a pullback support and could rise from this level to our take profit.
Entry: 1.1774
Why we like it:
There is a pullback support level.
Stop loss: 1.1690
Why we like it:
There is a pullback support level.
Take profit: 1.1877
Why we like it:
There is a swing high resistance level.
Enjoying your TradingView experience? Review us!
Please be advised that the information presented on TradingView is provided to Vantage (‘Vantage Global Limited’, ‘we’) by a third-party provider (‘Everest Fortune Group’). Please be reminded that you are solely responsible for the trading decisions on your account. There is a very high degree of risk involved in trading. Any information and/or content is intended entirely for research, educational and informational purposes only and does not constitute investment or consultation advice or investment strategy. The information is not tailored to the investment needs of any specific person and therefore does not involve a consideration of any of the investment objectives, financial situation or needs of any viewer that may receive it. Kindly also note that past performance is not a reliable indicator of future results. Actual results may differ materially from those anticipated in forward-looking or past performance statements. We assume no liability as to the accuracy or completeness of any of the information and/or content provided herein and the Company cannot be held responsible for any omission, mistake nor for any loss or damage including without limitation to any loss of profit which may arise from reliance on any information supplied by Everest Fortune Group.

EUR/USD forecast (1H)⚡ EUR/USD – Top-Down Breakdown ⚡
🕰 Weekly View
Big picture shows price tapping into HTF resistance zone (1.1850–1.1900).
Structure is still heavy long-term, but bulls have carved a corrective leg upward.
📅 Daily View
Price reacted off discount demand earlier in August, shifting order flow bullish.
Now, price has tested the HTF resistance and left a strong wick → sellers showing interest.
Room below for a deeper retrace into demand.
⏳ 4H View
Multiple i-BOS along the way up, confirming bullish order flow.
Current correction pulled back into a 4H reaction zone → Buy Zone 1 (1.1720s).
If this fails, next major support sits at Buy Zone 2 (1.1580s) aligned with 71% fib & imbalance fill.
⏱ 1H View
Price swept BSL at the top, then sold off into the 4H reaction zone.
Buyers defending here for now, but structure isn’t super clean → liquidity still resting below.
If bulls hold above Buy Zone 1 → bounce back toward 1.1820–1.1850.
If it breaks, we dip deeper into Buy Zone 2 (1.1580s) before bulls reload.
🎯 Forecast Summary
📍 Bias : Bullish corrective, but expecting deeper retrace
🎯 Upside Target: 1.1820–1.1850
🪙 Buy Zones:
Zone 1 → 1.1720s (current)
Zone 2 → 1.1580s (HTF demand)
❌ Invalidation: Break below 1.1550 swing low

EURUSD H4 | Bearish reversal off 50% Fibonacci resistanceThe Fiber (EUR/USD) is reacting off the sell entry which is a pullback resistance that aligns with the 50% Fibonacci retracement and could drop from this levle to the take profit.
Sell entry is at 1.1815, which is a pullback resistance that aligns with the 50% Fibonacci retracement.
Stop loss is at 1.1867, which is a pullback resistance.
Take profit is at 1.1737, which is a pullback support.
High Risk Investment Warning
Trading Forex/CFDs on margin carries a high level of risk and may not be suitable for all investors. Leverage can work against you.
Stratos Markets Limited (tradu.com ):
CFDs are complex instruments and come with a high risk of losing money rapidly due to leverage. 65% of retail investor accounts lose money when trading CFDs with this provider. You should consider whether you understand how CFDs work and whether you can afford to take the high risk of losing your money.
Stratos Europe Ltd (tradu.com ):
CFDs are complex instruments and come with a high risk of losing money rapidly due to leverage. 66% of retail investor accounts lose money when trading CFDs with this provider. You should consider whether you understand how CFDs work and whether you can afford to take the high risk of losing your money.
Stratos Global LLC (tradu.com ):
Losses can exceed deposits.
Please be advised that the information presented on TradingView is provided to Tradu (‘Company’, ‘we’) by a third-party provider (‘TFA Global Pte Ltd’). Please be reminded that you are solely responsible for the trading decisions on your account. There is a very high degree of risk involved in trading. Any information and/or content is intended entirely for research, educational and informational purposes only and does not constitute investment or consultation advice or investment strategy. The information is not tailored to the investment needs of any specific person and therefore does not involve a consideration of any of the investment objectives, financial situation or needs of any viewer that may receive it. Kindly also note that past performance is not a reliable indicator of future results. Actual results may differ materially from those anticipated in forward-looking or past performance statements. We assume no liability as to the accuracy or completeness of any of the information and/or content provided herein and the Company cannot be held responsible for any omission, mistake nor for any loss or damage including without limitation to any loss of profit which may arise from reliance on any information supplied by TFA Global Pte Ltd.
The speaker(s) is neither an employee, agent nor representative of Tradu and is therefore acting independently. The opinions given are their own, constitute general market commentary, and do not constitute the opinion or advice of Tradu or any form of personal or investment advice. Tradu neither endorses nor guarantees offerings of third-party speakers, nor is Tradu responsible for the content, veracity or opinions of third-party speakers, presenters or participants.

EURUSD POSSIBLE SELL SETUP💡 EURUSD 2H Outlook – Bearish Setup in Play
After a strong bounce from demand, price is now retesting the supply zone around 1.1820 – 1.1840. Structure shows a possible distribution phase forming here, with sellers waiting to step back in.
🔽 Bearish Scenario
If rejection confirms, price could drop toward the demand zone at 1.1720 – 1.1740.
A clean break below 1.1720 would open deeper downside continuation.
🔼 Bullish Scenario
Buyers would need a strong breakout above 1.1840 supply to invalidate this bearish outlook and push toward higher levels.
⚔️ Key Levels to Watch
Resistance: 1.1820 | 1.1840
Support: 1.1760 | 1.1720
📊 Current structure favors short setups from supply, with confirmation entries being the safest.
✅ If this analysis adds value, don’t forget to boost & follow for more updates across Forex, Crypto, and Indices.
💼 If you need account management (personal or funded), I provide professional trading strategies designed for consistency and growth.

Bullish rise?EUR/AUD has bounced off the support which is a pullback support and could rise from this level to our take profit.
Entry: 1.78067
Why we like it:
There is a pullback support level.
Stop loss: 1.77024
Why we like it:
There is a pullback support level.
Take profit: 1.79685
Why we like it:
There is a pullback resistance that is slightly above the 61.8% Fibonacci retracement.
Enjoying your TradingView experience? Review us!
Please be advised that the information presented on TradingView is provided to Vantage (‘Vantage Global Limited’, ‘we’) by a third-party provider (‘Everest Fortune Group’). Please be reminded that you are solely responsible for the trading decisions on your account. There is a very high degree of risk involved in trading. Any information and/or content is intended entirely for research, educational and informational purposes only and does not constitute investment or consultation advice or investment strategy. The information is not tailored to the investment needs of any specific person and therefore does not involve a consideration of any of the investment objectives, financial situation or needs of any viewer that may receive it. Kindly also note that past performance is not a reliable indicator of future results. Actual results may differ materially from those anticipated in forward-looking or past performance statements. We assume no liability as to the accuracy or completeness of any of the information and/or content provided herein and the Company cannot be held responsible for any omission, mistake nor for any loss or damage including without limitation to any loss of profit which may arise from reliance on any information supplied by Everest Fortune Group.

EURUSD Buy Signal triggered on the 4H MA100.The EURUSD pair has been trading within a Channel Up for almost 2 months and today it is rising after hitting the 4H MA100 (green trend-line). This is technically the bottom of the pattern and potentially the start of its new Bullish Leg.
The typical rallies within this pattern have ranged between +1.41% and +1.51%, so expecting a minimum of +1.41% is valid. Our Target is 1.18900.
On a side-note, the 4H RSI has also rebounded on its own Support Zone, strengthening the current Buy Signal.
-------------------------------------------------------------------------------
** Please LIKE 👍, FOLLOW ✅, SHARE 🙌 and COMMENT ✍ if you enjoy this idea! Also share your ideas and charts in the comments section below! This is best way to keep it relevant, support us, keep the content here free and allow the idea to reach as many people as possible. **
-------------------------------------------------------------------------------
💸💸💸💸💸💸
👇 👇 👇 👇 👇 👇

EUR/AUD - Selling Pressure Below 1.7850 (22.09.2025)#EURAUD #Forex #Trading #TechnicalAnalysis
EUR/AUD – Channel Breakout Pattern (30M)
EUR/AUD has broken below the rising channel, confirming a bearish reversal after completing a Head & Shoulders pattern at the top.
🔹 Market Structure:
Clear rejection from the resistance zone (1.7850 – 1.7860)
Breakdown of the bullish channel support
Head & Shoulders formation adding to bearish momentum
🔹 Key Levels:
1st Support: 1.7715
2nd Support: 1.7710
📉 Trading Idea:
As long as EUR/AUD stays below the channel resistance, selling pressure could drive price toward the support levels.
🎁 Please hit the like button and
🎁 Leave a comment to support for My Post !
Your likes and comments are incredibly motivating and will encourage me to share more analysis with you.
Best Regards, KABHI_TA_TRADING
Thank you.

EURUSD H4 | Bearish drop confirmedEUR/USD has reacted off the sell entry which is a pullback resistance that aligns with the 23.6% Fibonacci retracement and oculd drop from this levle to the take profit.
Sell entry is at 1.1773, which is a pullback resistance that lines up with the 23.6% Fibonacci retracement.
Stop loss is at 1.1867, which is a pullback resistance that is slightly above the 61.8% FIbonacci retracement.
Take profit is at 1.1678, whichis an overlap support that aligns with the 78.6% Fibonacci retracement.
High Risk Investment Warning
Trading Forex/CFDs on margin carries a high level of risk and may not be suitable for all investors. Leverage can work against you.
Stratos Markets Limited (tradu.com ):
CFDs are complex instruments and come with a high risk of losing money rapidly due to leverage. 65% of retail investor accounts lose money when trading CFDs with this provider. You should consider whether you understand how CFDs work and whether you can afford to take the high risk of losing your money.
Stratos Europe Ltd (tradu.com ):
CFDs are complex instruments and come with a high risk of losing money rapidly due to leverage. 66% of retail investor accounts lose money when trading CFDs with this provider. You should consider whether you understand how CFDs work and whether you can afford to take the high risk of losing your money.
Stratos Global LLC (tradu.com ):
Losses can exceed deposits.
Please be advised that the information presented on TradingView is provided to Tradu (‘Company’, ‘we’) by a third-party provider (‘TFA Global Pte Ltd’). Please be reminded that you are solely responsible for the trading decisions on your account. There is a very high degree of risk involved in trading. Any information and/or content is intended entirely for research, educational and informational purposes only and does not constitute investment or consultation advice or investment strategy. The information is not tailored to the investment needs of any specific person and therefore does not involve a consideration of any of the investment objectives, financial situation or needs of any viewer that may receive it. Kindly also note that past performance is not a reliable indicator of future results. Actual results may differ materially from those anticipated in forward-looking or past performance statements. We assume no liability as to the accuracy or completeness of any of the information and/or content provided herein and the Company cannot be held responsible for any omission, mistake nor for any loss or damage including without limitation to any loss of profit which may arise from reliance on any information supplied by TFA Global Pte Ltd.
The speaker(s) is neither an employee, agent nor representative of Tradu and is therefore acting independently. The opinions given are their own, constitute general market commentary, and do not constitute the opinion or advice of Tradu or any form of personal or investment advice. Tradu neither endorses nor guarantees offerings of third-party speakers, nor is Tradu responsible for the content, veracity or opinions of third-party speakers, presenters or participants.

Bearish drop off?EUR/USD has reacted off the resistance level which is a pullback resistance and could drop from this level to our take profit.
Entry: 1.1774
Why we like it:
There is a pullback resistance.
Stop loss: 1.1866
Why we like it:
There is a pullback resistance level.
Take profit: 1.1614
Why we like it:
There is a pullback support level.
Enjoying your TradingView experience? Review us!
Please be advised that the information presented on TradingView is provided to Vantage (‘Vantage Global Limited’, ‘we’) by a third-party provider (‘Everest Fortune Group’). Please be reminded that you are solely responsible for the trading decisions on your account. There is a very high degree of risk involved in trading. Any information and/or content is intended entirely for research, educational and informational purposes only and does not constitute investment or consultation advice or investment strategy. The information is not tailored to the investment needs of any specific person and therefore does not involve a consideration of any of the investment objectives, financial situation or needs of any viewer that may receive it. Kindly also note that past performance is not a reliable indicator of future results. Actual results may differ materially from those anticipated in forward-looking or past performance statements. We assume no liability as to the accuracy or completeness of any of the information and/or content provided herein and the Company cannot be held responsible for any omission, mistake nor for any loss or damage including without limitation to any loss of profit which may arise from reliance on any information supplied by Everest Fortune Group.

Unlocking EUR's Value: A Data-Driven Analysis of Macro Factors📊 EURUSD Technical Forecast | Intraday & Swing Outlook 🚀💶💵
Asset Class: EURUSD (CFD) Closing Price: 1.17432 (20th Sept 2025, 12:50 AM UTC+4)
🔎 Technical Overview
Trend Context: EURUSD has been consolidating near 1.1740, with mixed signals across short- and mid-term charts.
Momentum Check: RSI (H1/H4) → Neutral, close to 50 ⚖️
Volatility: Bollinger Bands tightening → Expect breakout soon 💥
Volume Flow: Anchored VWAP → Buyers defending 1.1720 📈
🕵️ Chart Patterns & Theories
Elliott Wave: Wave 4 correction nearing completion – possible Wave 5 uptrend. 🌊
Wyckoff: Signs of re-accumulation in H4 range. 📦
Ichimoku: Price hovering near cloud → watch for bullish breakout ☁️
Gann Levels: Key resistance around 1.1785, support at 1.1700 ⏳
H&S Watch: No clear head & shoulders yet, but traps possible around 1.1760/1.1720 ⚠️
📈 Intraday Levels (Next 24–48H)
🔹 Buy Zone: 1.1710 – 1.1730 (tight stop below 1.1690)
🎯 Targets: 1.1760 → 1.1785
🔻 Sell Zone: 1.1785 – 1.1805 (stop above 1.1825)
🎯 Targets: 1.1745 → 1.1720
📊 Swing Trading Outlook (Weekly)
Bullish Scenario: Sustained break above 1.1805 → eyeing 1.1880 – 1.1925 🌟
Bearish Scenario: Breakdown below 1.1690 → drop toward 1.1625 – 1.1580 🕳️
⚖️ Strategy Recap
Intraday: Range trading between 1.1720 – 1.1785 🎯
Swing: Watch breakout levels for trend confirmation 🚀 or ❌
🌍 Market Context
Geopolitics & ECB vs Fed divergence → driving sentiment.
Dollar Index (DXY) consolidation near highs → closely linked.
📌 Key Takeaways
✅ Buy dips near 1.1710–30, target 1.1760–85.
✅ Sell rallies near 1.1785–1.1805, target 1.1720.
⚠️ Major breakout zones: Above 1.1805 = bullish 🚀 | Below 1.1690 = bearish ⛔
For individuals seeking to enhance their trading abilities based on the analyses provided, I recommend exploring the mentoring program offered by Shunya Trade. (Website: shunya dot trade)
I would appreciate your feedback on this analysis, as it will serve as a valuable resource for future endeavors.
Sincerely,
Shunya.Trade
Website: shunya dot trade
📝 TRADING CHECKLIST
Before entering any position:
- ✅ Confirm volume supports move
- ✅ Check RSI for divergences
- ✅ Verify multiple timeframe alignment
- ✅ Set stop loss before entry
- ✅ Calculate position size
- ✅ Review correlation with DXY
- ✅ Check economic calendar
- ✅ Assess market sentiment
⚠️Disclaimer: This post is intended solely for educational purposes and does not constitute investment advice, financial advice, or trading recommendations. The views expressed herein are derived from technical analysis and are shared for informational purposes only. The stock market inherently carries risks, including the potential for capital loss. Therefore, readers are strongly advised to exercise prudent judgment before making any investment decisions. We assume no liability for any actions taken based on this content. For personalized guidance, it is recommended to consult a certified financial advisor.

EUR/USD UpdateEUR/USD Update
We use advanced data that counts the start of the cycle and all important key levels.
On the low time frame, EUR/USD is pulling back after rejecting the 1.1848 resistance zone.
Key levels:
1.1760 – 1.1762 → current support area. Holding above this keeps the short-term bullish structure intact.
1.1848 → major resistance and confirmation level for continuation of the main uptrend. A close above this would signal strength for higher targets.
If price breaks below 1.1760, downside pressure could increase, with 1.1665 as the next important support.
Cycle level: 1.1530 is the critical long-term support. EUR/USD must hold this level to remain in the green cycle.
📌 Summary
Above 1.1760 → bullish structure can continue.
Breakout above 1.1848 → confirms strong uptrend continuation.
Below 1.1760 → correction risk, targeting 1.1665 support.
1.1530 → cycle must-hold level for long-term trend.

EURGBP - Testing Supply at the Channel TopEURGBP has been grinding higher on the 4H, respecting a rising channel. Price is now tagging the overbought zone near the upper bound and a 0.873–0.875 supply area.
This confluence is key 🔑. If sellers react here, I’ll look for short setups on rejection, aiming for 0.867 first, then 0.863 toward demand and the lower channel.
If price breaks and holds above 0.875, the short idea is invalidated and 0.880+ could follow. Until then, it’s a “look for shorts at supply” play.
What’s your take - fade the touch at supply, or wait for a confirmed break and retest? 🤔
⚠️ Disclaimer: This is not financial advice. Always do your own research and manage risk properly.
📚 Stick to your trading plan regarding entries, risk, and management.
Good luck! 🍀
All Strategies Are Good; If Managed Properly!
~Richard Nasr

EUR/USD - Rising Wedge Breakout @ H1 CMCMARKETS:EURUSD EUR/USD - Wedge Pattern Strong breakout - @ H1 with high volume. Expecting Strong Bearish outlook today and Fundamental also play major role today.
"The Fed is still signalling more rate cuts, but at the same time still sees okay growth, which is a positive combination for share markets"
The Fed reduced rates by a quarter point on Wednesday, as expected, and indicated it will steadily lower borrowing costs for the rest of this year, initially sending the dollar plunging.
Support by Likes and Comments.
Thank you.

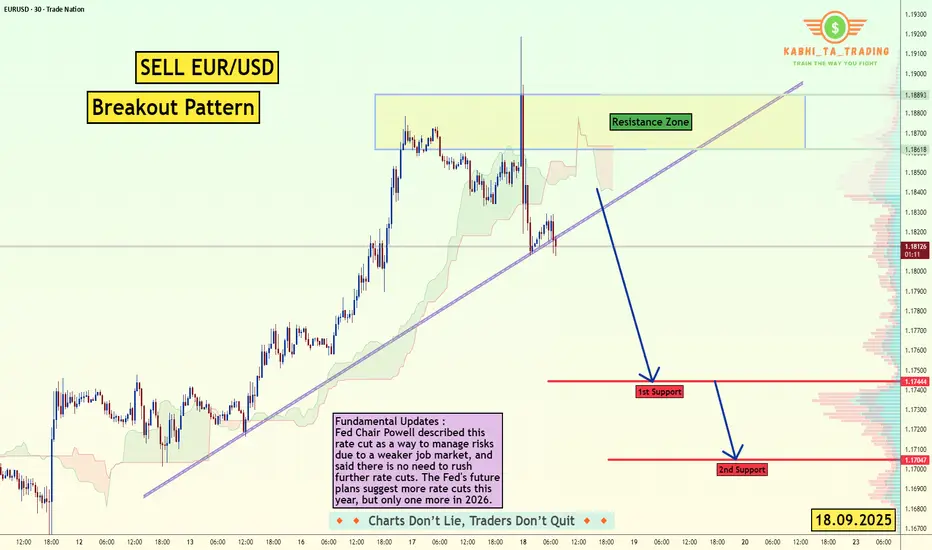
EUR/USD - Fundamental Move (18.09.2025)The EUR/USD Pair on the M30 timeframe presents a Potential Selling Opportunity due to a recent Formation of a Breakout Pattern.
This suggests a shift in momentum towards the downside in the coming hours.
Possible Short Trade:
Entry: Consider Entering A Short Position around Trendline Of The Pattern.
Target Levels:
1st Support – 1.1744
2nd Support – 1.1704
Fundamental Updates :
Fed Chair Powell described this rate cut as a way to manage risks due to a weaker job market, and said there is no need to rush further rate cuts. The Fed's future plans suggest more rate cuts this year, but only one more in 2026.
🎁 Please hit the like button and
🎁 Leave a comment to support for My Post !
Your likes and comments are incredibly motivating and will encourage me to share more analysis with you.
Best Regards, KABHI_TA_TRADING
Thank you.
EUR/USD 4H Trade Setup🔎 Bias
Mid-term bullish continuation after corrective pullback into demand.
📊 Technical Breakdown
Weekly/Daily: Structure remains bullish after breaking out of consolidation.
4H : Clear impulsive leg (i-ii-iii) with current correction into the 71% fib retracement.
Demand zone: 1.1730 – 1.1770 aligns with BOS retest + liquidity sweep.
Confluence : Trendline support + untested 4H demand.
🎯 Entry / Exit
Entry zone : 1.1740 – 1.1770 demand
Targets:
TP1: 1.1860
TP2: 1.1960
TP3 (extended): 1.2050+ (wave (v) projection)
Invalidation : Below 1.1685
⚖️ Risk Management
Risk only 1–2% per trade.
Stop loss tucked under 1.1685 demand break.
📌 Outlook
Expecting a corrective dip into demand before continuation higher. If demand holds → strong bullish wave (v) towards 1.20+.
Bias: Pullback → Mid-term bullish 🚀
